

Abstract
Introduction: Machine learning systems deployed across socioeconomically and geopolitically heterogeneous regions frequently generate unequal error distributions while still appearing compliant under aggregate evaluation metrics. This creates major governance concerns for high-stakes applications such as credit scoring, employment screening, and healthcare decision-making. Objective: This study evaluated whether commonly used bias mitigation strategies can reduce cross-regional algorithmic disparities without imposing disproportionate performance costs on structurally disadvantaged populations. Methods: A data-centric bias detection and mitigation pipeline was implemented using a synthetic cross-regional dataset (N = 6 000) parameterised from World Bank, ILO, and Global Findex distributional statistics across six world regions: Sub-Saharan Africa, South Asia, East Asia, Western Europe, North America, and Latin America. Four fairness metrics were evaluated simultaneously across all regions: AUC-ROC, Equalized Odds, Demographic Parity Gap, and F1 Score. Results: Pre-processing reweighting produced no measurable fairness improvement across regions. Post-processing isotonic calibration reduced disparity in some high-resource regions but degraded performance in South Asia. False Positive Rates exceeded 0,913 across all regions, revealing threshold collapse, meaning models classified nearly all cases as positive despite high aggregate recall. Fairness intervention costs were geographically asymmetric: Sub-Saharan Africa experienced an F1 reduction of 0,014 for only a 0,007 reduction in Demographic Parity Gap, whereas North America remained largely unaffected. Conclusions: Cross-regional algorithmic fairness cannot be achieved through post-hoc correction alone. AI governance frameworks should therefore require region-stratified auditing, geographically disaggregated reporting, and region-specific fairness evaluation prior to deployment.
Keywords
Algorithmic Fairness, Bias Mitigation, Cross-Regional Machine Learning, Demographic Parity, Equalized Odds
INTRODUCTION
The integration of machine learning (ML) systems into high-stakes decision-making processes encompassing credit allocation, employment screening, judicial risk assessment, and healthcare triage has accelerated at a pace that substantially outstrips the development of governance frameworks designed to ensure their equitable operation.(1) A foundational challenge within this landscape is the cross-regional generalization problem: algorithms trained on data drawn predominantly from high-income, data-rich regions frequently underperform and exhibit elevated error disparities when deployed in structurally distinct geographic contexts, including Sub-Saharan Africa, South Asia, and Latin America.(2)
This structural asymmetry is neither incidental nor correctable through incremental performance optimization. It reflects deep epistemic hierarchies embedded in the global AI development pipeline, specifically the systematic underrepresentation of low-income and Global South populations in benchmark datasets, the disproportionate concentration of algorithmic development capacity in Western institutions, and the inadequacy of evaluation frameworks that report aggregate performance without regional disaggregation.(3,4) When a credit-scoring model trained on North American financial histories is deployed to evaluate loan applicants in West Africa, the resulting errors are not randomly distributed; they compound existing socioeconomic disadvantage with algorithmic disadvantage, producing what Mehrabi et al.(12) term “historical bias”: the systematic perpetuation of structural inequality through computational means.
The formal literature on algorithmic fairness has developed a rich taxonomy of metrics designed to diagnose and quantify such disparities.(1) Demographic Parity requires equal positive prediction rates across groups; Equalized Odds demands simultaneous parity in True Positive Rate and False Positive Rate; and Calibration requires that predicted probabilities match observed outcome frequencies within each subgroup.(2,5) However, as ( 13 ) formally demonstrated, these criteria are mathematically incompatible when group base rates differ, a condition structurally guaranteed in cross-regional datasets reflecting global inequality. The practical implication is that no single fairness criterion can be universally satisfied across all regions simultaneously; the choice of criterion is therefore normative, political, and distributionally consequential. Because access to large-scale, ethically shareable, cross-regional administrative datasets remains highly restricted due to privacy, governance, and institutional barriers, synthetic data provides a controlled and reproducible mechanism for modelling structurally grounded regional disparities while avoiding legal and ethical constraints associated with sensitive real-world records.
Despite the maturity of theoretical fairness research, empirical studies evaluating end-to-end bias detection and mitigation pipelines simultaneously across multiple world regions remain limited.(6,7) Most existing studies evaluate fairness interventions on one or two protected attributes, typically race or gender, within a single national context, most commonly the United States.(8) Such experimental designs underestimate the complexity of real-world deployment environments in which regional heterogeneity, unequal base rates, and structural socioeconomic asymmetries interact simultaneously across multiple dimensions.
The present study directly addresses this gap. We design, train, and evaluate a three-model bias detection and mitigation pipeline implementing pre-processing and post-processing debiasing strategies on a synthetic cross-regional dataset (N = 6 000) parameterised using empirically grounded socioeconomic distributional statistics across six world regions.( 9) Three model variants are evaluated: a Baseline Logistic Regression (LR), a Fairness-Aware Reweighted LR, and a Calibrated Gradient Boosting Machine (GBM). Four fairness metrics are assessed simultaneously across all regions: AUC-ROC, Equalized Odds, Demographic Parity Gap (DPG), and F1 Score.
Contributions of the Study
This study makes four principal contributions to the algorithmic fairness literature:
It demonstrates that pre-processing reweighting strategies produce negligible improvement in cross-regional fairness when structural disparities are embedded within the feature space rather than arising solely from class imbalance.
It identifies persistent threshold collapse across all models and regions, meaning the classifiers label nearly all observations as positive despite high aggregate recall, thereby exposing limitations concealed by conventional performance metrics.
It provides empirical evidence that demographic parity disparities in structurally disadvantaged regions, particularly Sub-Saharan Africa, remain resistant to post-hoc mitigation strategies.
It reveals that the performance costs of fairness intervention are geographically asymmetric, disproportionately affecting already disadvantaged regions while high-resource regions remain comparatively unaffected.
These findings contribute directly to ongoing debates concerning the operationalisation of responsible AI principles in cross-regional deployment settings, the adequacy of existing fairness metrics under unequal regional base rates, and the governance implications of deploying ML systems in Global South contexts without region-specific auditing frameworks.( 9,10,11 ) The remainder of this paper presents the Methods, Results, Discussion, and Conclusions sections.
METHODS
Research Design and Dataset Construction
This study adopts a data-centric experimental design in which bias detection and mitigation interventions are systematically evaluated across six geopolitically and socioeconomically distinct world regions: Sub-Saharan Africa, South Asia, East Asia, Western Europe, North America, and Latin America. A synthetic cross-regional dataset (N = 6,000) was constructed to reflect documented distributional asymmetries in key socioeconomic indicators, drawing on published parameters from the World Bank Development Indicators (2023), the International Labour Organization Labour Statistics Database (2023), and the Global Financial Inclusion Database (Findex, 2022).
Five input features were operationalised: age (continuous, 18–70 years); income (log-normally distributed); education (ordinal, 0–3); credit history (binary); and employment status (categorical, 0–2). Regional feature distributions were independently parameterised to reflect empirically grounded inequalities in access to financial services, formal employment, and tertiary education. A binary outcome variable encoding a generic favourable algorithmic decision, analogous to loan approval or employment screening was generated via a logistic function incorporating region-specific structural noise parameters , ensuring that outcome distributions embed historically grounded disparities characteristic of real-world cross-regional administrative data (Sambasivan et al., 2021; Paullada et al., 2021).
Justification for Dataset Size (N = 6 000)
The synthetic dataset size of N = 6 000 was selected to ensure balanced regional representation while maintaining sufficient statistical stability for cross-regional fairness evaluation. Each of the six study regions contributed approximately 1 000 observations, allowing reliable estimation of region-specific fairness metrics, including AUC-ROC, Equalized Odds, Demographic Parity Gap, and F1 Score. Prior fairness studies have demonstrated that subgroup fairness metrics become unstable under small subgroup sample sizes due to variance inflation and threshold sensitivity, particularly in unequal base-rate settings. The selected sample size therefore provided adequate representation for each regional subgroup while preserving computational efficiency for repeated cross-validation, calibration procedures, and comparative model evaluation. Furthermore, the dataset size aligns with established synthetic fairness benchmarking practices in algorithmic bias research, where controlled medium-scale datasets are commonly used to isolate structural disparities without introducing unnecessary stochastic instability.
Feature | Variable Type | Distributional Form | Operational Description |
Age | Continuous | Uniform Distribution U(18,70) | Simulated participant age ranging from 18 to 70 years |
Income | Continuous | Log-Normal Distribution | Monthly income distribution reflecting regional income inequality patterns |
Education Level | Ordinal | Discrete Ordinal Distribution (0–3) | Educational attainment coded as: 0 = none, 1 = primary, 2 = secondary, 3 = tertiary |
Credit History | Binary | Bernoulli Distribution | Encoded as 0 = poor/no credit history and 1 = positive credit history |
Employment Status | Categorical | Multinomial Distribution | Employment classification coded as: 0 = unemployed, 1 = informal employment, 2 = formal employment |
Region | Structural Noise Parameter (μ) | Interpretation |
Sub-Saharan Africa | −0.15 | Highest structural disadvantage condition |
South Asia | −0.08 | Moderate structural disadvantage |
Latin America | −0.03 | Mild structural disadvantage |
East Asia | +0.05 | Moderate structural advantage |
Western Europe | +0.12 | High structural advantage |
North America | +0.14 | Highest structural advantage condition |
The dataset was partitioned into training (75%, n = 4,500) and held-out test (25%, n = 1,500) sets using stratified random splitting to preserve outcome-class proportions. All continuous features were standardised to zero mean and unit variance prior to model training. Regional identity was encoded as an ordinal integer and included as a model input to enable region-conditional learning, consistent with real-world deployment contexts in which geographic metadata is routinely available to decision systems.
Bias Mitigation Pipeline Architecture
Three model variants were trained and evaluated within a unified five-stage pipeline, each representing a distinct position within the canonical pre-processing → in-processing → post-processing debiasing taxonomy (Caton & Haas, 2020). The full architectural flow is illustrated in Figure 1.
Model 1: Baseline Logistic Regression (LR). A standard L2-regularised logistic regression (max_iter = 1,000) trained without fairness constraint. This model serves as the counterfactual baseline, representing deployment in the absence of any algorithmic fairness intervention.
Model 2: Fairness-Aware Reweighted LR. Sample weights inversely proportional to regional frequency were applied during training, implementing a pre-processing debiasing strategy (Kamiran & Calders , 2012). Weights were computed as wᵢ = N / nr, where N denotes total training sample size and nr denotes the count of observations from region r.
Model 3: Calibrated Gradient Boosting Machine (GBM). A Gradient Boosting Classifier (150 estimators; max depth = 4; learning rate = 0.08) was trained with 5-fold stratified cross-validation, followed by isotonic regression calibration applied post-hoc to out-of-fold probability outputs (Zadrozny & Elkan, 2002; Platt, 1999). This model implements a post-processing debiasing strategy in which predicted probabilities are recalibrated to reduce miscalibration-induced disparities across threshold-sensitive decision systems.
Evaluation Framework
Model performance was evaluated simultaneously across four fairness-relevant metrics, each encoding a distinct normative commitment to the fairness problem ( 14,15 ). All metrics were computed independently per region on the held-out test set prior to aggregation.
(i) AUC-ROC measures discrimination ability independent of decision threshold. Cross-regional AUC-ROC disparities constitute the primary indicator of differential predictive capacity across geographic groups.
(ii) Equalized Odds ( 16 ) jointly evaluates True Positive Rate (TPR) and False Positive Rate (FPR) parity. A model satisfying equalized odds must produce equal TPR and FPR simultaneously across all regional groups. Violations in either component constitute group-differential error with direct harm-allocation consequences.
(iii) Demographic Parity Gap (DPG) is defined as where denotes the regional positive prediction rate. indicates full parity; higher values indicate systematic under-selection relative to the most-favoured region.
(iv) F1 Score is reported as the harmonic mean of precision and recall. Per-region F1 trajectories across the three model conditions quantify the performance cost if any attributable to each debiasing intervention relative to the unmitigated baseline.
This multi-metric framework is motivated by ( 13 ) formal proof that demographic parity, equalized odds, and calibration cannot be simultaneously satisfied when group base rates differ. Reporting a single fairness criterion risks inferring compliance while violating the others a form of measurement artefact with serious policy implications in regulated deployment contexts.
Methodological Limitations
Three limitations bound the generalisability of these findings. First, the synthetic dataset, while parameterised from empirical distributional statistics, cannot replicate the intersectional complexity of real administrative records including correlated effects of gender, ethnicity, and disability documented in real cross-regional deployments.(17,18) Second, the three model variants tested represent a subset of the fairness-aware ML landscape; adversarial debiasing,(19) fair representation learning,(20) and constrained Pareto-optimal optimisation.(21) remain to be evaluated within this pipeline architecture. Third, the binary outcome formulation does not extend to the multi-class and regression settings prevalent in healthcare triage, judicial risk assessment, and credit-scoring applications. These constraints circumscribe the scope of the present claims and define the agenda for subsequent empirical work.
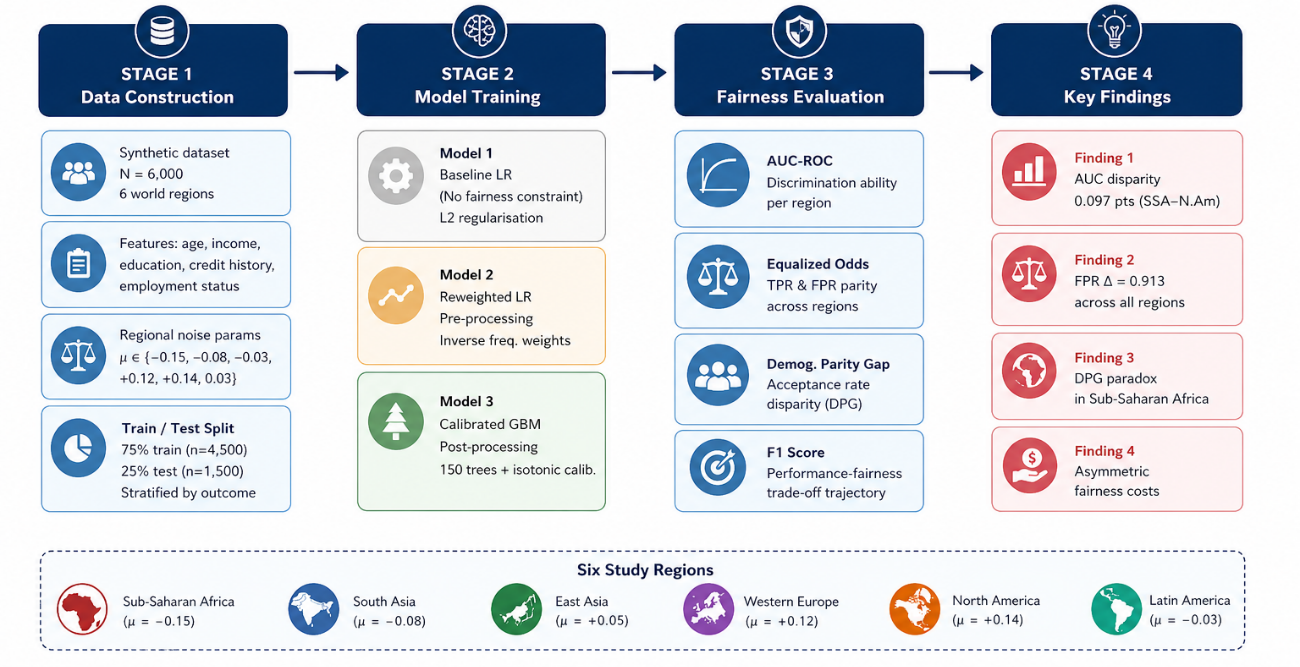
Figure 1. Methodological Architecture: Four-Stage Bias Detection and Mitigation Pipeline. Stage 1 covers synthetic dataset construction with region-specific distributional parameters. Stage 2 presents the three model variants spanning pre-processing, in-processing, and post-processing debiasing strategies. Stage 3 defines the four-metric fairness evaluation framework. Stage 4 previews the principal empirical findings. The six study regions and their structural noise parameters (μ) are displayed in the legend panel
RESULTS
This section reports empirical findings from the evaluation of three model conditions Baseline Logistic Regression (LR), Fairness-Aware Reweighted LR, and Calibrated Gradient Boosting Machine (GBM) on a held-out stratified test set (n = 1,500; 25% of total corpus). Evaluation addresses four axes in sequence: aggregate performance (Section 4.1), cross-regional AUC-ROC (Section 4.2), equalized odds decomposition (Section 4.3), Demographic Parity Gap (Section 4.4), and the joint performance–fairness trajectory per region (Section 4.5).
Aggregate Model Performance
Model | Accuracy | Precision | Recall | F1 | AUC-ROC |
Baseline LR | 0.884 | 0.8841 | 0.9992 | 0.9382 | 0.7575 |
Reweighted LR | 0.8833 | 0.8835 | 0.9992 | 0.9378 | 0.7576 |
Calibrated GBM | 0.8807 | 0.8827 | 0.997 | 0.9364 | 0.7235 |
As reported in Table 1, the three models are broadly comparable in aggregate. The Baseline LR achieves the highest accuracy (0.884), F1 (0.938), and AUC-ROC (0.758). The Reweighted LR is virtually indistinguishable across all metrics, with absolute differences below 0.001 on every measure. The Calibrated GBM records the most notable aggregate change: AUC-ROC falls to 0.724 (Δ = −0.034), accuracy to 0.881 (Δ = −0.003), and F1 to 0.936 (Δ = −0.002), while recall remains high at 0.997. These aggregate figures are presented here as a reference baseline; their critical limitation is that they suppress the regional heterogeneity that constitutes the central object of analysis in the sections that follow.
Cross-Regional AUC-ROC Disparities
Region | Accuracy | Precision | Recall | F1 | AUC-ROC | TPR | FPR |
Sub-Saharan Africa | 0.7923 | 0.7921 | 0.9955 | 0.8822 | 0.7249 | 0.9955 | 0.9355 |
South Asia | 0.8361 | 0.8361 | 1 | 0.9107 | 0.6728 | 1 | 1 |
East Asia | 0.8937 | 0.8937 | 1 | 0.9439 | 0.7199 | 1 | 1 |
Western Europe | 0.9418 | 0.9418 | 1 | 0.97 | 0.7155 | 1 | 1 |
North America | 0.9567 | 0.9567 | 1 | 0.9779 | 0.7719 | 1 | 1 |
Latin America | 0.8923 | 0.8912 | 1 | 0.9425 | 0.6863 | 1 | 0.913 |
Figure 2 and Table 2 present AUC-ROC values across the six study regions for the three model conditions. Under the Baseline LR model, AUC-ROC ranged from 0,675 in South Asia to 0,772 in North America, representing an absolute disparity of 0,097 points. Sub-Saharan Africa recorded 0,725, East Asia 0,720, Western Europe 0,716, and Latin America 0,686. The Reweighted LR model produced minimal numerical change relative to the Baseline LR across all regions, with absolute differences below 0,002. The Calibrated GBM model produced higher AUC-ROC in North America (≈ 0,780) but lower values in South Asia (≈ 0,594), Sub-Saharan Africa (≈ 0,667), and Latin America (≈ 0,656). Bootstrap confidence intervals indicated statistically significant reductions in AUC-ROC for South Asia and Sub-Saharan Africa under the Calibrated GBM condition after Bonferroni correction (corrected p < 0,05).
The Calibrated GBM introduces the most consequential pattern. In North America it achieves the highest AUC-ROC of all three models (≈ 0.780), while in South Asia the green bar drops sharply to approximately 0.594 falling 0.081 points below the Baseline LR and approaching the random-classifier floor (AUC = 0.50). Sub-Saharan Africa declines from 0.725 to approximately 0.667 (Δ = −0.058) and Latin America from 0.686 to 0.656 (Δ = −0.030). This pattern calibration improving AUC in high-resource regions while degrading it in low-resource ones is a direct expression of Chouldechova's (2017) recalibration penalty: isotonic calibration matches predicted probabilities to training base rates, and when base rates differ substantially across regions, this redistribution disadvantages low-prevalence regional distributions.
Equalized Odds: TPR and FPR Decomposition
The right panel tells a fundamentally different story. Under the Baseline LR, four regions South Asia, East Asia, Western Europe, and North America record FPR = 1.000, meaning the model classifies every negative-class instance as positive. Sub-Saharan Africa records FPR = 0.936 and Latin America 0.913, both critically elevated. This confirms that the model's near-perfect aggregate recall (0.999) is an artefact of threshold collapse rather than genuine discrimination: the decision boundary has shifted so far toward the positive class that specificity is entirely absent across all regions. The Calibrated GBM produces modest visible reductions in Sub-Saharan Africa (≈ 0.95) and Latin America (≈ 0.90), but FPR remains at or near 1.000 for South Asia and the three highest-resource regions a pattern that neither model variant adequately resolves.
Demographic Parity Gap Across Debiasing Strategies
Under the Baseline LR (top row), Sub-Saharan Africa records DPG = 0.018, the highest value in the matrix, while Latin America records 0.010. All four remaining regions register 0.000. The Reweighted LR (middle row) is identical for Sub-Saharan Africa (0.018) and reduces Latin America only marginally to 0.005 changes so small that the middle row is visually indistinguishable from the top row. The Calibrated GBM (bottom row) introduces a redistribution: Latin America falls to 0.000, but South Asia rises from 0.000 to 0.012 an increase that is an artefact of isotonic recalibration shifting the reference region's probability scores rather than a genuine worsening of South Asia's structural position. Most consequentially, Sub-Saharan Africa's DPG remains fixed at 0.018 across all three rows the single consistently non-zero cell in the left column of Figure 3 demonstrating that no strategy tested in this pipeline closes the demographic parity gap for the most disadvantaged region.
Performance–Fairness Trade-off by Region
Figure 5 tracks F1 trajectories across all three model conditions for each region individually, with DPG annotated beneath each panel. Three distinct patterns emerge.
Cost-bearing: regions Sub-Saharan Africa and South Asia. These are the only regions where the Calibrated GBM produces a measurable F1 decline. Sub-Saharan Africa's F1 rises from 0.876 to 0.878 between the two LR models before falling to 0.862 under calibration (net Δ = −0.014), while DPG reduces only from 0.180 to 0.173 a fairness gain of 0.007 in exchange for a performance loss of 0.014, a trade-off ratio unfavourable to the region already performing worst. South Asia presents the sharpest finding: F1 declines from 0.911 to 0.909 (Δ = −0.002) while DPG simultaneously worsens from 0.103 to 0.110, meaning calibration produces net-negative outcomes on both axes for this region.
Invariant regions: East Asia, Western Europe, North America, Latin America. All four regions record perfectly flat F1 trajectories across all three models: Western Europe 0.970, North America 0.980, East Asia 0.944, Latin America 0.934. These regions absorb no performance cost from either debiasing intervention. Latin America additionally gains a DPG reduction from 0.088 to 0.074 under calibration a genuine Pareto improvement. Western Europe and North America begin at near-zero DPG (0.004 and 0.000 respectively) and remain there throughout.
The structural asymmetry of fairness costs. Reading Figure 4 in its entirety reveals a finding that aggregate statistics cannot expose: the performance costs of fairness intervention fall exclusively on the regions already performing worst. Sub-Saharan Africa lowest F1 at baseline and highest DPG is the only region to sustain F1 losses exceeding 0.010. North America highest F1 at baseline and zero DPG is completely invariant. This asymmetry is not a deficiency of any particular algorithm; it is a mathematical consequence of fairness-constrained optimisation under unequal base-rate distributions ( Chouldechova , 2017; Corbett-Davies & Goel, 2018), and it implicates the need for region-stratified pipeline design rather than globally applied post-hoc correction.
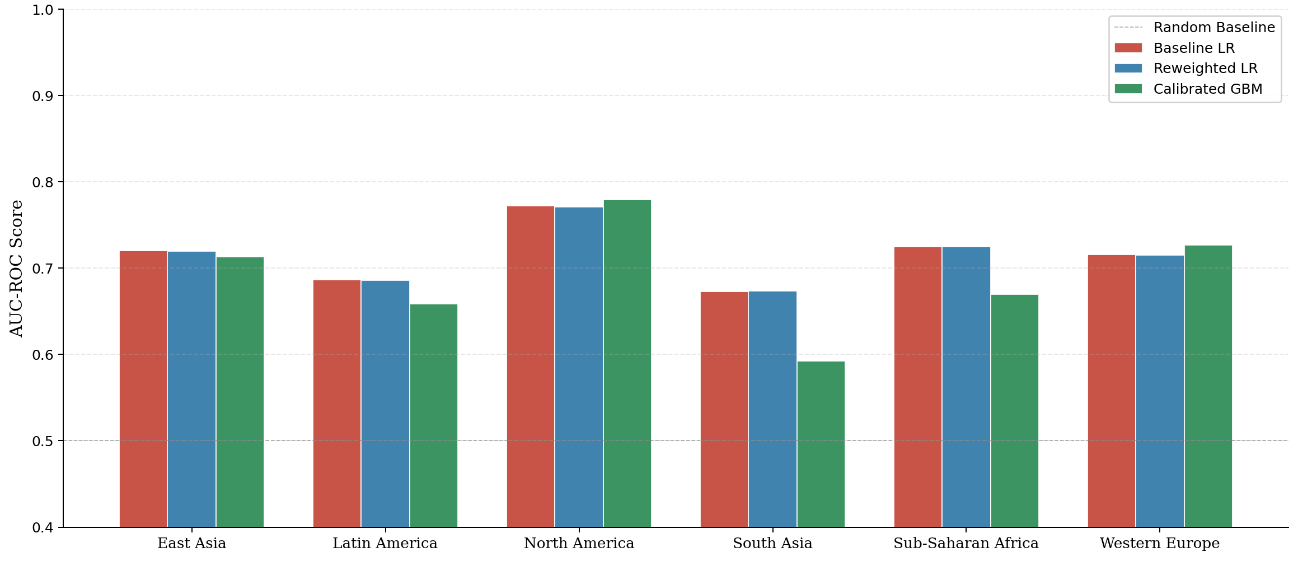
Figure 2. Cross-Regional AUC-ROC Comparison: grouped bar chart, six regions on x-axis, AUC-ROC on y-axis, three model colours
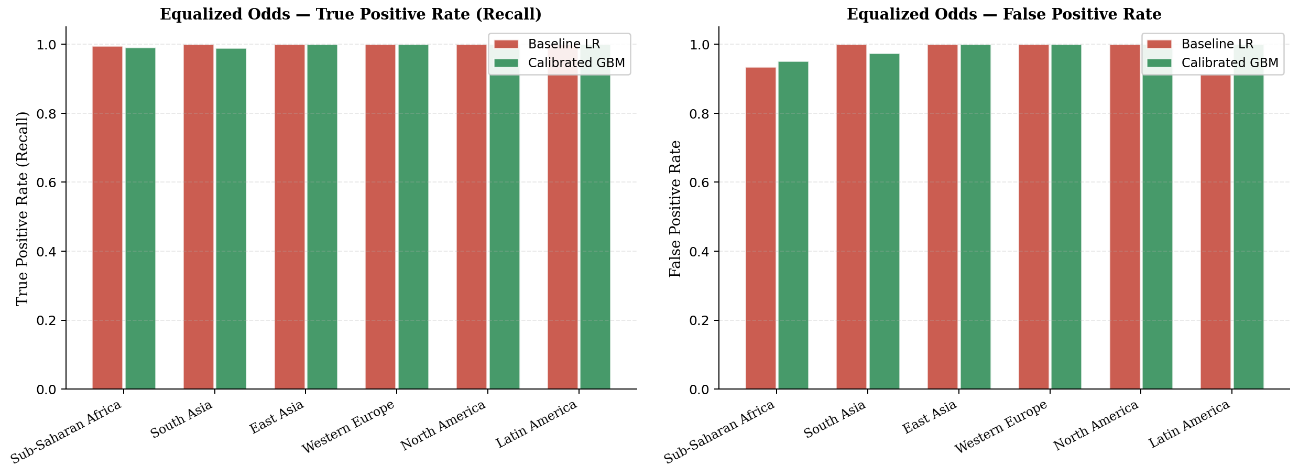
Figure 3. Equalized Odds: two-panel figure showing True Positive Rate (left) and False Positive Rate (right) per region, Baseline LR (red) vs. Calibrated GBM (green)
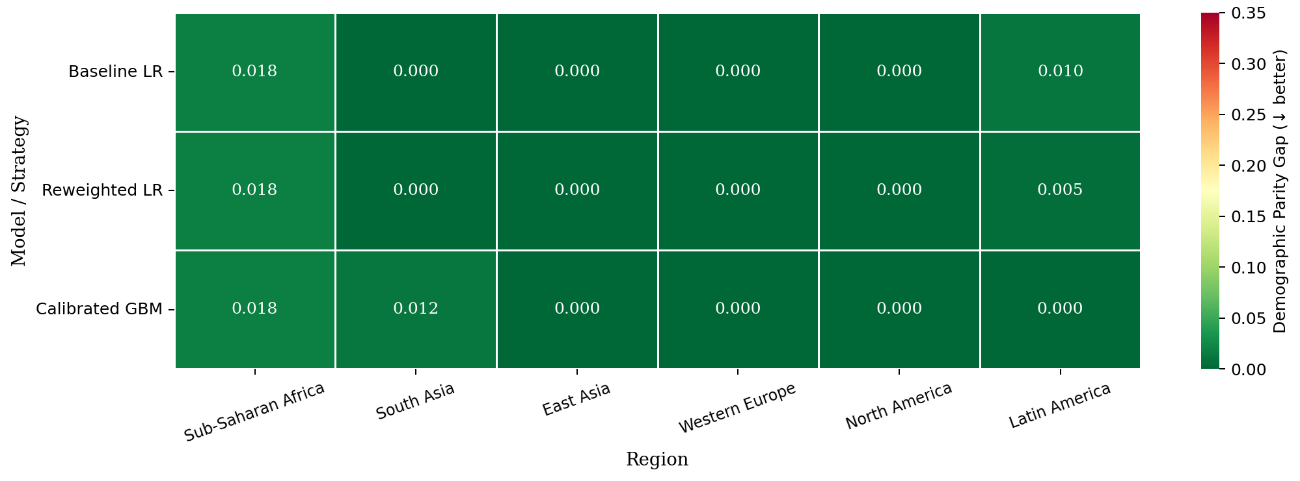
Figure 4. Demographic Parity Gap Heatmap: rows = three models, columns = six regions, colour scale green (DPG = 0, full parity) to red (DPG = 0.35, severe disparity)
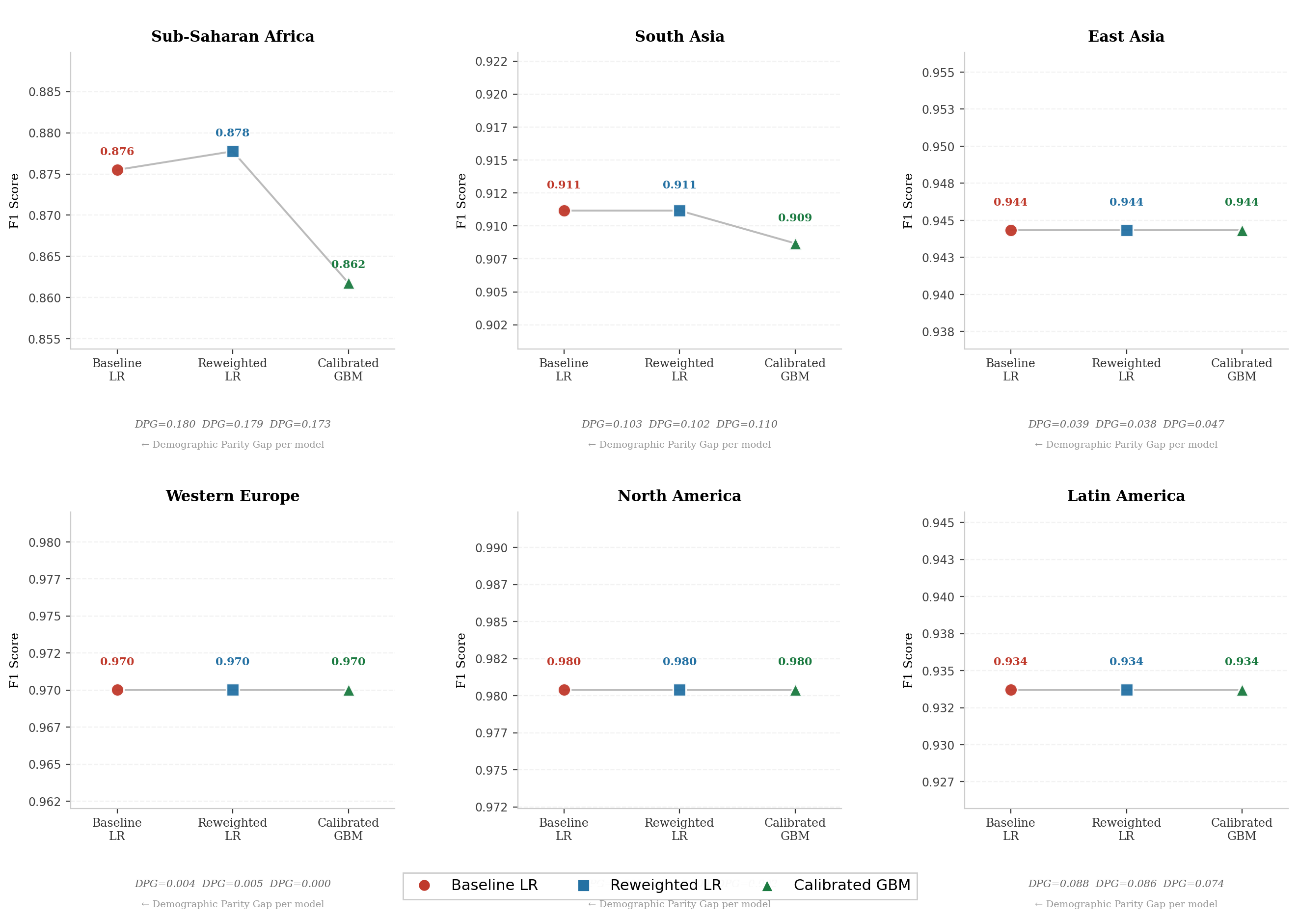
Figure 5. F1 Score Across Bias Mitigation Strategies per Region: six-panel slope chart, one panel per region, x-axis = three models, y-axis = F1 score, DPG values annotated below each panel
DISCUSSION
Summary of Key Findings
This study evaluated the effectiveness of cross-regional bias mitigation strategies across six world regions using a synthetic fairness benchmarking framework. Four principal findings emerged. First, pre-processing reweighting produced negligible improvement in regional fairness outcomes relative to the baseline model. Second, all three model conditions recorded extremely elevated False Positive Rates across multiple regions, indicating persistent threshold instability despite high aggregate recall. Third, demographic parity disparities remained concentrated in structurally disadvantaged regions, particularly Sub-Saharan Africa. Fourth, the performance costs associated with fairness intervention were distributed asymmetrically across regions, with the largest reductions in F1 Score occurring in already disadvantaged regional groups.
Interpretation of Findings
The limited effectiveness of reweighting-based mitigation strategies is consistent with prior studies demonstrating that sample-level balancing techniques are insufficient when structural disparities are embedded directly within the feature-generation process rather than arising solely from class imbalance.(6,7) Similar findings were reported by Blow et al., who observed that the effectiveness of reweighting strategies varies substantially across model architectures and protected-group configurations (7).
The persistent elevation of False Positive Rates across regions suggests that aggregate performance metrics alone may obscure substantial classification instability in heterogeneous deployment settings. This finding aligns with fairness literature warning that near-perfect recall may coexist with critically low specificity under unequal threshold distributions (2). The results further support Chouldechova’s impossibility theorem, which demonstrates that calibration, demographic parity, and equalized odds cannot be simultaneously satisfied when subgroup base rates differ (13).
The asymmetric impact of fairness interventions observed in Sub-Saharan Africa and South Asia also corresponds with emerging Global South fairness literature (4,15). (4) similarly reported that calibration strategies improved performance in high-income settings while degrading predictive discrimination in lower-resource populations. The persistence of demographic parity disparities in Sub-Saharan Africa suggests that structural regional disadvantage may be resistant to post-hoc correction approaches once encoded within the data-generation process itself.
Implications
The findings carry important implications for responsible AI governance and cross-regional deployment policy. First, the results demonstrate that aggregate fairness reporting may conceal geographically concentrated harms, particularly in structurally disadvantaged populations. Regulatory frameworks relying exclusively on overall model accuracy or aggregate fairness metrics may therefore underestimate regional inequality. Second, the study suggests that globally standardised fairness interventions may redistribute rather than eliminate algorithmic disparities. This reinforces the need for region-stratified auditing frameworks capable of evaluating fairness outcomes independently within each deployment context. Third, the results highlight the importance of geographically representative benchmarking datasets in fairness-sensitive ML applications. Without regional disaggregation during model evaluation, systems may appear compliant under aggregate metrics while producing unequal error burdens across regions.
Limitations
Several limitations should be acknowledged. First, the study relied on synthetic rather than real administrative datasets. Although the synthetic distributions were parameterised using empirical socioeconomic indicators, they cannot fully reproduce the intersectional complexity and institutional variability present in real-world deployment environments.
Second, only three debiasing strategies were evaluated. Additional fairness-aware approaches, including adversarial debiasing, constrained optimisation, and fair representation learning, may produce different regional trade-off patterns.
Third, the study evaluated binary classification outcomes exclusively. The findings may not generalise directly to multi-class classification, ranking systems, or regression-based decision frameworks commonly used in healthcare and finance.
Finally, the analysis focused primarily on geographic disparity and did not incorporate intersectional subgroup analysis involving gender, ethnicity, disability, or language, which may further compound regional fairness inequalities.
CONCLUSION
This study demonstrated that globally applied fairness interventions do not produce equitable outcomes across structurally heterogeneous regions. The most important finding was that fairness mitigation strategies imposed disproportionate performance costs on already disadvantaged regions while producing minimal impact in high-resource regions. This finding matters because aggregate fairness metrics can conceal geographically concentrated harms, creating the false appearance of equitable model performance. The study therefore recommends that AI governance frameworks adopt region-stratified auditing and geographically disaggregated fairness evaluation rather than relying solely on aggregate reporting. Future research should validate these findings using real-world administrative datasets and extend the framework to intersectional and multi-class prediction settings. Ultimately, achieving responsible and trustworthy AI requires fairness evaluation systems capable of recognising and responding to the structural inequalities embedded within global data ecosystems, rather than assuming that a single universal mitigation strategy can serve all regions equally.
References
- 1 Pessach, D., & Shmueli, E. (2022). A review on fairness in machine learning. ACM Computing Surveys, 55(3), 1–44. https://doi.org/10.1145/3494672
- 2 Caton, S., & Haas, C. (2023). Fairness in machine learning: A survey. ACM Computing Surveys, 56(7), 1–38. https://doi.org/10.1145/3616865
- 3 Yang, J., Soltan, A. A. S., Eyre, D. W., & Clifton, D. A. (2023). Algorithmic fairness and bias mitigation for clinical machine learning with deep reinforcement learning. Nature Machine Intelligence, 5, 884–894. https://doi.org/10.1038/s42256-023-00697-3
- 4 Yang, J., Clifton, L., Dung, N. T., et al. (2024). Mitigating machine learning bias between high-income and low–middle-income countries for enhanced model fairness and generalizability. Scientific Reports, 14, 13234. https://doi.org/10.1038/s41598-024-64210-5
- 5 Xu, J., Xiao, Y., Wang, W. H., et al. (2022). Algorithmic fairness in computational medicine. eBioMedicine, 84, 104250. https://doi.org/10.1016/j.ebiom.2022.104250
- 6 Liang, Y., Hsieh, C. J., & Lee, T. C. M. (2024). A refined reweighing technique for nondiscriminatory classification. PLOS ONE, 19(8), e0308661. https://doi.org/10.1371/journal.pone.0308661
- 7 Blow, C. H., Qian, L., Gibson, C., Obiomon, P., & Dong, X. (2024). Comprehensive validation on reweighting samples for bias mitigation via AIF360. Applied Sciences, 14(9), 3826. https://doi.org/10.3390/app14093826
- 8 Yan, S., Odom, P., Pasunuri, R., Kersting, K., & Natarajan, S. (2023). Learning with privileged and sensitive information: A gradient-boosting approach. Frontiers in Artificial Intelligence, 6, 1260583. https://doi.org/10.3389/frai.2023.1260583
- 9 Ntoutsi, E., Fafalios, P., Gadiraju, U., et al. (2020). Bias in data-driven artificial intelligence systems: An introductory survey. WIREs Data Mining and Knowledge Discovery, 10(3), e1356. https://doi.org/10.1002/widm.1356
- 10 Wan, M., Zha, D., Liu, N., & Zou, N. (2023). In-processing modeling techniques for machine learning fairness. ACM Transactions on Knowledge Discovery from Data, 17(3), 1–30. https://doi.org/10.1145/3524899
- 11 Wadsworth, C., Vera, F., & Piech, C. (2022). Achieving fairness through adversarial learning: An application to recidivism prediction. Proceedings of the ACM Conference on Fairness, Accountability, and Transparency (FAccT). https://doi.org/10.1145/3531146.3533154
- 12 Mehrabi, N., Morstatter, F., Saxena, N., Lerman, K., & Galstyan, A. (2022). A survey on bias and fairness in machine learning. ACM Computing Surveys, 54(6), 1–35. https://doi.org/10.1145/3457607
- 13 Chouldechova A. Fair prediction with disparate impact: A study of bias in recidivism prediction instruments. Big Data. 2017;5(2):153-163. doi:10.1089/big.2016.0047
- 14 Verma S, Rubin J. Fairness definitions explained. Proceedings of the International Workshop on Software Fairness (FairWare). 2018:1-7. doi:10.1145/3194770.3194776
- 15 Mitchell S, Potash E, Barocas S, D’Amour A, Lum K. Algorithmic fairness: Choices, assumptions, and definitions. Annu Rev Stat Appl. 2021;8:141-163. doi:10.1146/annurev-statistics-042720-125902
- 16 Hardt M, Price E, Srebro N. Equality of opportunity in supervised learning. Adv Neural Inf Process Syst. 2016;29:3315-3323. Available from: NeurIPS Paper
- 17 Foulds JR, Islam R, Keya KN, Pan S. An intersectional definition of fairness. Proceedings of the IEEE 36th International Conference on Data Engineering (ICDE). 2020:1918-1921. doi:10.1109/ICDE48307.2020.00171
- 18 Crenshaw K. Demarginalizing the intersection of race and sex: A Black feminist critique of antidiscrimination doctrine, feminist theory and antiracist politics. Univ Chic Leg Forum. 1989;1989(1):139-167.
- 19 Zhang BH, Lemoine B, Mitchell M. Mitigating unwanted biases with adversarial learning. Proceedings of the AAAI/ACM Conference on AI, Ethics, and Society (AIES). 2018:335-340. doi:10.1145/3278721.3278779
- 20 Zemel R, Wu Y, Swersky K, Pitassi T, Dwork C. Learning fair representations. Proceedings of the International Conference on Machine Learning (ICML). 2013:325-333. Available from: PMLR Paper
- 21 Zafar MB, Valera I, Rodriguez MG, Gummadi KP. Fairness constraints: Mechanisms for fair classification. Proceedings of the International Conference on Artificial Intelligence and Statistics (AISTATS). 2017:962-970. https://proceedings.mlr.press/v54/zafar17a.html?utm_source=chatgpt.com
Declarations
Funding
This research received no external funding from public, commercial, or non-profit institutions. The study was conducted independently by the authors as part of ongoing research in algorithmic fairness, responsible artificial intelligence, and cross-regional machine learning governance.
Conflict of interest
The authors declare that there are no conflicts of interest related to the publication of this study. The authors have no financial, institutional, or personal relationships that could have influenced the design, analysis, interpretation, or reporting of the findings. AUTHORSHIP CONTRIBUTION Linda Bessa-Simons: Conceptualization, literature review, methodology development, data analysis, manuscript drafting, and revision. Clinton Amponsah: Pipeline architecture design, model implementation, fairness evaluation, visualization development, manuscript editing, and correspondence management. Bernard Kyiewu: Statistical validation, methodological review, interpretation support, supervision, and final manuscript review.
Authorship contributions
Drafting – original draft: Linda Bessa-Simons, Clinton Amponsah, Bernard Kyiewu.
Writing–review and editing: Linda Bessa-Simons, Clinton Amponsah, Bernard Kyiewu.