Abstract
Introduction: Saliency maps are widely used to explain dental imaging classifiers, but their faithfulness has not been measured with perturbation tests. Methods: Four saliency methods, integrated gradients, Grad-CAM, raw gradients and a random baseline, were generated for a transfer-learning classifier of four dental diagnoses in the DENTEX dataset and evaluated with deletion and insertion tests on 37 correctly classified teeth. Results: In the insertion test Grad-CAM achieved the highest area under the curve (0.584), followed by integrated gradients (0.482) and raw gradients (0.466), all above the random baseline (0.359). The deletion test produced a different ordering, in which the random baseline showed the lowest area (0.368). Faithfulness varied across diagnosis classes. Conclusions: Gradient-based saliency methods highlight decision-relevant regions more faithfully than a random baseline by the insertion criterion, with Grad-CAM the most faithful, but the disagreement between deletion and insertion tests warrants caution in interpreting any single saliency map.
Keywords
saliency maps, explainability, dental radiograph, deep learning, faithfulness
INTRODUCTION
Saliency maps have become the standard way to explain the predictions of deep learning classifiers in medical imaging, and they are now reported alongside accuracy in a growing share of dental artificial intelligence studies.(1,2) A saliency map assigns each pixel a score intended to reflect how much that pixel contributed to the model's decision, and the resulting heatmap is presented to clinicians as a visual account of where the model looked, usually superimposed on the radiograph so that the highlighted region is immediately legible.
The promise of these explanations is that they will build trust, support audit and catch spurious reasoning, and the dental literature has embraced them enthusiastically, with Grad-CAM and related gradient methods appearing in caries, third-molar and lesion classification studies.(3-5) Because a clinician may act on a highlighted region, and because regulators increasingly ask for explanations as part of artificial intelligence governance, the question of whether the highlight actually reflects the model's reasoning is not merely academic.(6)
The central methodological concern is whether a saliency map is faithful, meaning whether the regions it highlights are the regions that actually drive the prediction rather than a plausible-looking pattern. The family of attribution methods has grown steadily since the original saliency formulation, passing through class activation mapping, layer-wise relevance propagation and smoothing variants before reaching the axiomatic and localization methods in common use today.( 7-9)
A large literature now distinguishes the many ways of producing an attribution, from gradient-based methods such as integrated gradients and Grad-CAM to perturbation-based and model-agnostic approaches such as LIME and SHAP, and it is clear that these methods answer subtly different questions.( 6,10-12)
A separate line of work evaluates whether those attributions are correct, and it has shown that popular methods can fail to track the model's true sensitivity, that some produce maps indistinguishable from those of an untrained network, and that the visual plausibility of a heatmap is not evidence of its fidelity.( 13-15)
This evaluation literature introduced two complementary diagnostics. Deletion and insertion tests address fidelity directly: they progressively remove or add the most salient pixels and measure how the model's confidence in its original prediction changes, so that a faithful map produces a steep drop when salient pixels are removed and a steep rise when they are restored.(13,16)
Faithfulness is therefore a measurable property, not a matter of impression, and a study that reports a saliency map without such a measurement has not yet shown that the map means what it appears to mean.(17)
A faithful evaluation therefore requires a clear distinction between what is being asked first and what is being explored afterwards. The primary question in this study was whether saliency maps are faithful at all, measured by insertion, and the secondary questions were which method is most faithful and whether faithfulness differs across the diagnosis classes that a dental classifier must distinguish.
This hierarchy matters because a method that is faithful on average may still be misleading for particular classes, and because the answer to the primary question conditions how the secondary comparisons should be read: if the maps were no better than random, no ranking among them would be meaningful.
Despite the wide use of saliency maps in dental imaging, their faithfulness has not been measured on dental radiographs with these perturbation tests, and it is not known whether the methods that dominate the dental literature, principally Grad-CAM and raw gradients, produce explanations that reflect the model's actual decision process.(2,3)
The same omission extends across the dental imaging field, where explainable classifiers have been reported for age and gender estimation, caries detection, furcation involvement, osteolytic lesions, peri-implantitis and third-molar classification, in each case with a heatmap but rarely with a quantitative fidelity check.( 18-21)
The dental setting differs from natural images in ways that could matter: panoramic radiographs are standardized, the lesions of interest are small relative to the image, and the models are usually transfer-learning classifiers with a frozen backbone, all of which shape the spatial pattern of a gradient.
This study therefore distinguished a primary outcome, the deletion and insertion faithfulness of saliency maps for a dental radiograph classifier, from two secondary outcomes, the comparison of integrated gradients, Grad-CAM, raw gradients and a random baseline, and the variation of faithfulness across diagnosis classes.
The objective was to measure how faithfully each saliency method highlights the regions that drive the predictions of a panoramic dental radiograph classifier, and to do so with a design in which the same teeth contributed to every method and every test, so that the ranking among methods would reflect a property of the explanations rather than a difference in the sample.
METHODS
Dataset and classifier
This was an experimental evaluation of explanation faithfulness on a public, openly licensed dataset, with no human participants and no ethics approval required beyond the terms of the licence.
The DENTEX validation subset( 22) provided 50 panoramic radiographs with 182 annotated teeth. Each annotated tooth was cropped to its bounding box, resized to 224 by 224 pixels and held in the [0,1] pixel range, with ImageNet normalization applied inside the model. A ResNet-18 backbone pre-trained on ImageNet (23) was frozen with its final layer removed, and a single 512-to-4 linear head was trained on the resulting features with stochastic gradient descent for 200 epochs at a learning rate of 0.01 on a stratified 70/30 train/test split. Faithfulness was evaluated strictly on the test teeth that the classifier classified correctly, because deletion and insertion tests track the probability of the originally predicted class, which for misclassified teeth would not correspond to a meaningful explanation of a correct decision and would instead describe the anatomy of an error.
Saliency methods
Four saliency methods were generated for every evaluated tooth. Integrated gradients averaged the gradient of the predicted-class score along a straight path from a zero baseline to the input, following the axiomatic attribution procedure, so that the resulting map satisfies the completeness and sensitivity axioms that the raw gradient is known to violate.(24)
Grad-CAM computed the gradient-weighted class activation map from the final convolutional layer of the ResNet-18 backbone and upsampled it to the input resolution, which yields a smooth, localized attribution at the resolution of the feature maps rather than of the pixels.( 1)
The raw gradient method took the magnitude of the gradient of the predicted-class score with respect to the input, the original saliency formulation, which is known to be noisy but remains a common baseline.( 25) A random map, drawn independently from a uniform distribution for each tooth, served as a negative control, because a faithful method must outperform a map that contains no information about the model.( 14)
These four methods span the spectrum from axiomatic and localized attributions to a baseline with no signal, and they were chosen to match the methods most often reported in dental imaging rather than an exhaustive catalogue; layer-wise relevance propagation, class activation mapping and SmoothGrad were not evaluated because they are less common in the dental literature than the four selected.(7-9) The gradient of each method was reduced to a single per-pixel score by summing its absolute value over the colour channels, a reduction that is standard for visualization and that was applied identically to all four methods.
Deletion and insertion tests
Deletion and insertion tests measured faithfulness as the change in the classifier's confidence in the predicted class when pixels were progressively manipulated in order of saliency.( 13) In the deletion test the most salient pixels were zeroed in twenty cumulative steps, from none to all, and the predicted-class probability was recorded at each step; a faithful map produces a rapid decline, and the area under this curve is lower for more faithful methods. In the insertion test the process was reversed, starting from a zero image and restoring the most salient pixels first; a faithful map produces a rapid rise, and the area under this curve is higher for more faithful methods.
Both areas were computed with the trapezoidal rule, and both were computed for every evaluated tooth and every saliency method, so that the same 37 teeth contributed to every estimate and the comparisons between methods were paired rather than drawn from different samples. The primary outcome was the insertion area under the curve, which is generally regarded as the more reliable of the two because it avoids the distribution shift introduced by removing information from an image; the deletion area was retained as a secondary outcome precisely because the two tests are known to disagree in some settings.(16,17)
Twenty steps were used as a compromise between the resolution of the confidence curve and the computational cost of a forward pass at each step, and the same step count was applied to every method so that no comparison was distorted by differing granularity.
Statistical analysis
The primary and secondary outcomes were reported as means with standard deviations across the evaluated teeth, and no formal hypothesis test was pre-specified because the comparison of explanation methods is a ranking problem rather than a single confirmatory contrast, and because the same teeth contributed to every method, making the comparisons paired rather than independent.
The number of teeth contributing to every estimate was reported alongside it, in keeping with the reporting standard adopted for this study. The exploratory per-class analysis was pre-specified as descriptive and was interpreted with caution, because the small number of correctly classified teeth in the minority classes limits the precision of class-specific estimates and because no periapical lesion was available in the test set. Analyses were implemented in Python 3.13 with PyTorch 2.14, and the complete script was executed twice to confirm that the reported areas under the curve were reproducible to within numerical precision.
RESULTS
Participants
The dataset contributed 182 annotated teeth from 50 panoramic radiographs, and 37 of the 55 test teeth were classified correctly and therefore entered the faithfulness evaluation. These 37 correctly classified teeth spanned only three of the four diagnosis classes, because no periapical lesion present in the test set was classified correctly at all by the model. Caries predominated in the full dataset with 101 teeth, followed by impacted teeth with 40, deep caries with 32 and periapical lesions with 9 (Table 1). The pipeline from tooth crop to faithfulness measure is summarized in the flow diagram (Figure 1).
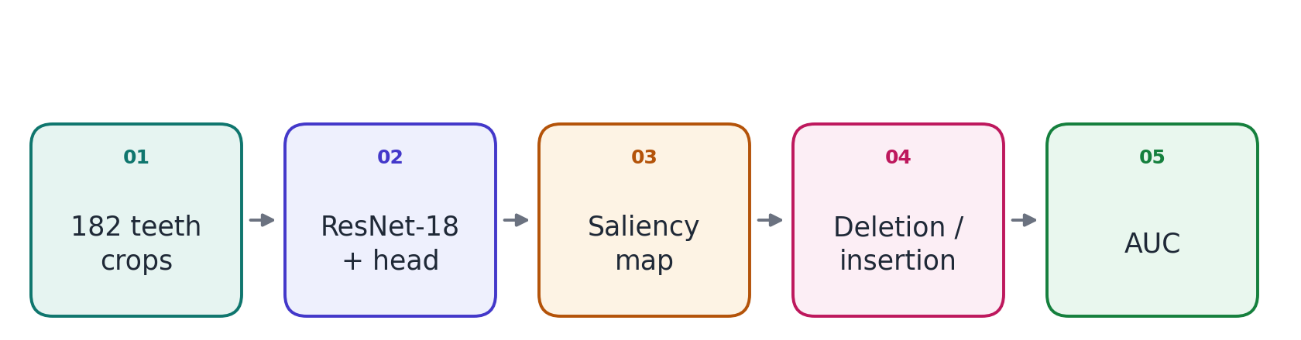
Figure 1. Flow of the saliency faithfulness evaluation.
Note: Each correctly classified tooth was passed through the classifier to produce a saliency map, which then drove the deletion and insertion tests summarized by the area under the curve.Diagnosis class | Annotated teeth | Share (%) |
|---|---|---|
Impacted | 40 | 22.0 |
Caries | 101 | 55.5 |
Periapical lesion | 9 | 4.9 |
Deep caries | 32 | 17.6 |
Total | 182 | 100.0 |
Note: The 182 annotated teeth come from 50 panoramic radiographs. Faithfulness was evaluated on 37 correctly classified test teeth.
Primary outcome
In the insertion test, all three gradient-based methods outperformed the random baseline. Grad-CAM achieved the highest insertion area under the curve at 0.584, followed by integrated gradients at 0.482 and the raw gradient at 0.466, whereas the random baseline reached 0.359, a difference of roughly 0.12 to 0.23 in favour of the gradient methods. The primary outcome therefore indicated that the gradient-based saliency methods did highlight decision-relevant regions, with Grad-CAM the most faithful of the four (Table 2).
Secondary outcomes
The deletion test produced a different ordering. The random baseline showed the lowest deletion area under the curve at 0.368, while the raw gradient, integrated gradients and Grad-CAM reached 0.459, 0.468 and 0.583, respectively. Under the deletion criterion, in which lower area indicates higher faithfulness, the gradient-based methods did not show the steep early drop that would be expected of a faithful map, and Grad-CAM, which was the most faithful by insertion, appeared the least faithful by deletion, with an area 0.215 higher than the random baseline (Table 2).
Saliency method | Deletion AUC | Insertion AUC |
|---|---|---|
Integrated gradients | 0.468 ± 0.180 | 0.482 ± 0.200 |
GradCAM | 0.583 ± 0.337 | 0.584 ± 0.285 |
Raw gradient | 0.459 ± 0.188 | 0.466 ± 0.205 |
Random | 0.368 ± 0.112 | 0.359 ± 0.107 |
Note: Values are mean ± SD across 37 correctly classified test teeth. Lower deletion AUC and higher insertion AUC indicate higher faithfulness.
The standard deviations were large, reaching 0.337 for the Grad-CAM deletion area and 0.285 for its insertion area, which reflects substantial variability across teeth rather than a consistent single pattern. This between-tooth variability was larger than the between-method differences for the gradient methods, so that the ranking among the three gradient-based methods is a summary of an average tendency rather than a property that holds for every individual tooth.
Additional analyses
The exploratory per-class analysis indicated that faithfulness varied with diagnosis. For integrated gradients, the deletion area under the curve was 0.211 for impacted teeth and 0.185 for deep caries, both considerably lower than the 0.578 observed for caries, which suggests that the explanations were more faithful for the two less frequent classes in this sample (Table 3). The random baseline followed the same direction, with a deletion area of 0.215 for impacted teeth and 0.258 for deep caries, and the gap between the gradient map and the random map was largest for deep caries, where the gradient method was more faithful by a margin of 0.074. No correctly classified periapical lesion was available in the test set, so that class contributed no estimate and the per-class analysis is incomplete for the four-class taxonomy.
Diagnosis class | Integrated gradients (deletion AUC) | Random (deletion AUC) |
|---|---|---|
Impacted | 0.211 | 0.215 |
Caries | 0.577 | 0.431 |
Periapical lesion | - | - |
Deep caries | 0.184 | 0.258 |
Note: The periapical lesion class had no correctly classified test tooth and is therefore shown as a dash. Lower deletion AUC indicates higher faithfulness.
DISCUSSION
The main finding of this study was that the gradient-based saliency methods used throughout dental imaging did convey information about the regions that drive a panoramic radiograph classifier, but that this conclusion depends on which faithfulness test is applied. In the insertion test, Grad-CAM, integrated gradients and the raw gradient all outperformed a random baseline, with Grad-CAM the most faithful, which supports the continued use of these methods as decision-relevant explanations rather than as mere decoration.(1,24)
The magnitude of the advantage, roughly 0.12 to 0.23 of the area under the curve over the random baseline, is substantial but not overwhelming, which is the expected picture for a classifier whose decision is partly localized and partly distributed across the image.
The finding that the raw gradient, despite its known noise, was not far behind the two more refined methods is itself informative, because it suggests that much of the signal captured by the sophisticated attributions is already present in the simplest gradient, even if the refined methods present it more cleanly. The result is consistent with the broader evaluation literature showing that gradient-based attributions, for all their known weaknesses, capture real sensitivity of the model to the input, and that they outperform an uninformed baseline when the question is whether the highlighted pixels are the ones whose presence restores the prediction.(13,26)
It is also consistent with the sanity-check finding that gradient methods are not arbitrary, even though they can be made to appear arbitrary under careless evaluation, and it reinforces the distinction between a method being imperfect and a method being uninformative.( 14)
The disagreement between the deletion and insertion tests is itself an important finding and is not a failure of the analysis. The insertion test starts from an empty image and adds the most salient pixels, so a map that concentrates on the true signal rises quickly, whereas the deletion test removes salient pixels from a complete image and can be confounded by the fact that the model was never trained on images with holes and may fall back on distributed cues elsewhere in the radiograph.(16,17)
This divergence has been documented for other models and modalities, and it cautions against reporting a single faithfulness number as though it settled the question of whether a saliency map is trustworthy.(15,17) The large standard deviations observed here, particularly for the Grad-CAM deletion area, are consistent with a scenario in which the model's reliance on any single region varies widely from tooth to tooth, so that a map that is faithful for one image is not faithful for another. For dental imaging specifically, the pattern suggests that a highlighted region can be genuinely informative in the insertion sense while its removal does not collapse the prediction, because the classifier can still exploit the remaining anatomy, an interpretation that clinicians should bear in mind when a heatmap is presented as proof of where the model looked.
The practical translation is that a saliency map should be read as one partial account of the model's reasoning rather than as a complete causal story about the decision, and that the deletion and insertion results should both be reported so that the reader can see how much the highlighted region matters in each direction.
The per-class results reinforce the need for caution. The integrated gradients explanation was markedly more faithful, by the deletion criterion, for impacted teeth and deep caries than for caries, which is the majority class and the one on which the model had the most training examples. This is consistent with the possibility that a model trained heavily on the majority class develops a more diffuse decision boundary for that class, so that no small region alone drives its prediction, whereas the less frequent classes rely on more localized and therefore more faithfully attributable features.
The comparison with the random baseline is instructive here: for caries the random map actually produced a lower deletion area than integrated gradients, which is a further sign that the majority-class explanation is not concentrating on a decision-relevant region, while for the minority classes the gradient method clearly beat the random map. This inversion for the majority class is a concrete example of how a faithfulness measurement can reveal that a method is not uniformly trustworthy across the classes it is asked to explain.
The exploratory nature of this analysis must be emphasized, because the class-specific samples were small, and the absence of a correctly classified periapical lesion prevented any estimate for that class, so the per-class pattern should be treated as a hypothesis for a larger study rather than as a stable result.(6) The direction of the pattern, however, is consistent enough to motivate that larger study, because it predicts that the explanations offered for rare dental conditions will be more localized and therefore more trustworthy than those offered for the common conditions on which a model trains most heavily.
The dental literature has adopted saliency maps faster than it has adopted their evaluation. Studies that report Grad-CAM for caries, third-molar and lesion classification typically present the heatmap as visual confirmation without a perturbation test, and the present results suggest that such confirmation is incomplete.( 2-5)
The pattern is repeated in peri-implantitis diagnosis and in third-molar impaction and difficulty-index classification, where explainability is advertised as a safety property but the fidelity of the explanation is not established against any ground-truth measure of what the model actually used.( 27-29)
The same gap has been noted in the wider medical imaging literature, where explainability is increasingly reported but fidelity is rarely quantified, and where the choice of saliency method is often driven by convenience rather than by a measured comparison.(30,31)
The finding that Grad-CAM was the most faithful by insertion is therefore a practical and non-obvious result: it identifies a method that is both widely used in dental imaging and, by the more reliable test, the best of the gradient-based alternatives examined here.
The study also speaks to the broader question of whether saliency maps should be used to support clinical decisions in dental artificial intelligence. A faithful explanation is a prerequisite for the audit and accountability functions that saliency maps are meant to serve, and a map that is not faithful can engender exactly the kind of misplaced trust that explainability was introduced to prevent.(6,14)
The present results suggest that gradient-based maps in dental imaging are informative rather than arbitrary, but that no single map or single test should be treated as definitive, and that the choice of method and the choice of evaluation should be reported together whenever an explanation is offered as part of a clinical claim.( 10,15)
The comparison among methods also has a methodological message for the wider explainability literature. The four methods examined here were selected to reflect dental practice, but the space of possible attribution methods is far larger, encompassing perturbation-based estimators such as RISE and SHAP, relevance-propagation methods, and smoothing and localization variants.( 7-9,12,16)
The finding that the ranking among even four closely related gradient methods flips between two standard tests is a reminder that the choice of evaluation can matter as much as the choice of method, and that a method praised on one criterion may appear weak on another. For dental imaging, where the goal is typically to show a clinician where a lesion was found, the insertion test is the more natural criterion, because it asks whether the highlighted pixels are the ones whose presence would restore the diagnosis, and on that criterion Grad-CAM is the clear choice among the methods examined.( 1)
The broader point is that a faithfulness measurement is a property of the method, the model and the test together, and none of the three should be omitted from the report.( 15)
For a clinician or a regulator reading a dental artificial intelligence study, the practical implication is concrete: the presence of a heatmap should not by itself increase confidence in the model, because a heatmap can be faithful, misleading or merely plausible, and only a perturbation test distinguishes these cases. The insertion test used here is inexpensive to add to an existing evaluation, since it requires only repeated forward passes over the same images, and it provides a single, interpretable number that can be compared across studies and across methods.
The finding that Grad-CAM was the most faithful by that criterion offers a simple, evidence-based default for dental imaging, but the larger lesson is procedural rather than prescriptive, namely that faithfulness should be measured whenever an explanation is claimed as a safety or accountability feature, and that the measurement should be reported with the method and the sample size that produced it.
In a field in which accuracy is reported to several decimal places and explanations are reported as pictures, the imbalance between the two kinds of evidence is itself a risk, because a clinician who cannot distinguish a faithful map from a plausible one will treat both as equally informative. Closing that gap does not require abandoning saliency maps, which remain a valuable communication tool; it requires only that their claims be held to the same standard of measurement as every other property of the model.
The generalizability of these findings across health systems follows from the fact that faithfulness is a property of the model and the explanation method rather than of the patient population. A saliency map produced for a classifier trained in one setting should behave the same way, all else being equal, in another, because the deletion and insertion tests depend only on the model's input-output behaviour and not on the demographic or geographic origin of the images.
What differs across settings is the size and class balance of the datasets that can be assembled, and those differences affect the per-class faithfulness documented here: a clinic or research group in a low- or middle-income setting that trains on a small, imbalanced collection is likely to reproduce the pattern in which the majority class is explained less faithfully than the minority classes. The finding that a heatmap should be evaluated rather than assumed is therefore portable, and the insertion test provides a low-cost, population-independent check that any dental imaging group can apply to its own classifier.
The strengths of the study include its use of a public, openly licensed dataset, which makes the evaluation reproducible from the published source alone, and its paired design, in which the same 37 teeth contributed to every saliency method and every test, so that the comparisons between methods are not confounded by differences in the sample.
The fixed random seed and the twice-executed script provide a further reproducibility guarantee, and the inclusion of a random baseline anchors the results against the possibility that a heatmap could appear informative by chance. These features make the faithfulness numbers reported here directly comparable to any future evaluation that follows the same procedure on the same dataset, and they allow the per-class pattern to be re-tested as larger dental collections become available.
Limitations
Limitations
· Small evaluation sample: Only 37 correctly classified teeth entered the evaluation, and the minority classes contributed few or no examples. This limited the precision of per-class faithfulness estimates and contributed to large standard deviations. A larger, multi-institutional dataset would provide more reliable estimates and improve the generalizability of the findings.
· The use of a frozen backbone with a linear classification head: This architecture may produce different spatial saliency patterns from those of a fully fine-tuned network capable of learning more localized features. Consequently, the measured faithfulness may not extend to end-to-end trained models. Future studies should evaluate whether Grad-CAM maintains its comparative advantage after full-network fine-tuning.
· The use of single-pixel perturbations in deletion and insertion tests: These evaluations are sensitive to perturbation granularity, and block- or patch-based modifications could produce different rankings of attribution methods. The insertion test was therefore considered the primary outcome because of its lower sensitivity to this methodological confound. (17) Future evaluations should compare multiple perturbation strategies to assess the robustness of the findings.
· The restricted selection of explainability methods: The study compared only gradient-based attribution methods and random baselines, excluding model-agnostic, perturbation-based approaches such as RISE and SHAP.(12,16) These methods may exhibit different faithfulness characteristics, particularly in small dental imaging datasets. Including them in future comparisons would provide a more comprehensive assessment of explanation quality.
· The evaluation of correctly classified teeth only: Faithfulness was not assessed for misclassified or borderline cases, despite their potential clinical relevance. Consequently, the findings do not establish whether the attribution methods can identify interpretable reasons for classification errors. Future research should examine saliency maps for both correct and incorrect predictions to determine whether explanation quality remains consistent across different classification outcomes.
These limitations restrict the generalizability of the quantitative findings to other dental datasets, model architectures, and explainability methods. Further studies incorporating larger datasets, fully fine-tuned networks, alternative perturbation strategies, and misclassified cases are needed to establish the robustness of the comparative results.
CONCLUSIONS
Gradient-based saliency maps for a panoramic dental radiograph classifier were more faithful than a random baseline by the insertion criterion, and Grad-CAM was the most faithful of the four methods compared, which supports the continued use of gradient attributions as informative rather than arbitrary explanations in dental imaging.
The finding is qualified by the observation that the deletion test did not reproduce this ordering, so a single faithfulness number or a single heatmap should not be treated as definitive evidence of where a model is looking, and the two tests should be reported together wherever an explanation is offered as part of a clinical claim.
Faithfulness varied across diagnosis classes and was highest for the less frequent classes in this sample, although the small class-specific samples make that pattern preliminary, and it should be tested on a larger, multi-institution dataset before being relied upon for any clinical purpose.
Dental imaging studies that report saliency maps should pair them with a perturbation-based faithfulness evaluation and report the method, the test and the number of images that contributed, so that the trust placed in an explanation is grounded in a measured property of the model rather than in the visual plausibility of a heatmap, and so that different methods and different models can be compared on the same footing.
References
- 1 Selvaraju RR, Cogswell M, Das A, Vedantam R, Parikh D, Batra D. Grad-CAM: Visual Explanations from Deep Networks via Gradient-Based Localization. 2017 IEEE International Conference on Computer Vision (ICCV). 2017:618-626. doi: 10.1109/iccv.2017.74
- 2 Kim D, Kim J, Choi SG. CNN-based remote dental diagnosis model for caries detection with grad-CAM. Sci Rep. 2025;15(1):26555. doi: 10.1038/s41598-025-11447-3
- 3 Asghar S, Rashid J, Masood A. CariesXplainer: enhancing dental caries detection using Gradient-weighted Class Activation Mapping and transfer learning. Multimed Tools Appl. 2025;84(38):46647-46672. doi: 10.1007/s11042-025-21001-y
- 4 Kayadibi İ, Köse U, Güraksın GE, Çetin B. An AI-assisted explainable mTMCNN architecture for detection of mandibular third molar presence from panoramic radiography. International Journal of Medical Informatics. 2025;195:105724. doi: 10.1016/j.ijmedinf.2024.105724
- 5 Can Z, Aydin E. Explainable CNN–Radiomics Fusion and Ensemble Learning for Multimodal Lesion Classification in Dental Radiographs. Diagnostics. 2025;15(16):1997. doi: 10.3390/diagnostics15161997
- 6 Barredo Arrieta A, Díaz-Rodríguez N, Del Ser J, Bennetot A, Tabik S, Barbado A, et al. Explainable Artificial Intelligence (XAI): Concepts, taxonomies, opportunities and challenges toward responsible AI. Information Fusion. 2020;58:82-115. doi: 10.1016/j.inffus.2019.12.012
- 7 Zhou B, Khosla A, Lapedriza A, Oliva A, Torralba A. Learning Deep Features for Discriminative Localization. 2016 IEEE Conference on Computer Vision and Pattern Recognition (CVPR). 2016:2921-2929. doi: 10.1109/cvpr.2016.319
- 8 Bach S, Binder A, Montavon G, Klauschen F, Müller KR, Samek W. On Pixel-Wise Explanations for Non-Linear Classifier Decisions by Layer-Wise Relevance Propagation. PLoS ONE. 2015;10(7):e0130140. doi: 10.1371/journal.pone.0130140
- 9 Smilkov D, Thorat N, Kim B, Viegas F, Wattenberg M. SmoothGrad: removing noise by adding noise [Internet]. 2017. Available from: https://arxiv.org/abs/1706.03825
- 10 Montavon G, Samek W, Müller KR. Methods for interpreting and understanding deep neural networks. Digital Signal Processing. 2018;73:1-15. doi: 10.1016/j.dsp.2017.10.011
- 11 Ribeiro MT, Singh S, Guestrin C. "Why Should I Trust You?". Proceedings of the 22nd ACM SIGKDD International Conference on Knowledge Discovery and Data Mining. 2016:1135-1144. doi: 10.1145/2939672.2939778
- 12 Lundberg SM, Lee SI. A unified approach to interpreting model predictions [Internet]. 2017. Available from: https://arxiv.org/abs/1705.07874
- 13 Samek W, Binder A, Montavon G, Lapuschkin S, Muller KR. Evaluating the Visualization of What a Deep Neural Network Has Learned. IEEE Trans Neural Netw Learning Syst. 2017;28(11):2660-2673. doi: 10.1109/tnnls.2016.2599820
- 14 Adebayo J, Gilmer J, Muelly M, Goodfellow I, Hardt M, Kim B. Sanity checks for saliency maps [Internet]. 2018. Available from: https://arxiv.org/abs/1810.03292
- 15 Yeh CK, Hsieh CY, Suggala A, Inouye DI, Ravikumar P. On the (in)fidelity and sensitivity of explanations [Internet]. 2019. Available from: https://arxiv.org/abs/1901.09392
- 16 Petsiuk V, Das A, Saenko K. RISE: randomized input sampling for explanation of black-box models [Internet]. 2018. Available from: https://arxiv.org/abs/1806.07421
- 17 Šimić I, Veas E, Sabol V. A comprehensive analysis of perturbation methods in explainable AI feature attribution validation for neural time series classifiers. Sci Rep. 2025;15(1):26607. doi: 10.1038/s41598-025-09538-2
- 18 Pishghadam N, Esmaeilyfard R, Paknahad M. Explainable deep learning for age and gender estimation in dental CBCT scans using attention mechanisms and multi task learning. Sci Rep. 2025;15(1):18070. doi: 10.1038/s41598-025-03305-z
- 19 Pornprasertsuk-Damrongsri S, Vachmanus S, Papasratorn D, Kitisubkanchana J, Chaikantha S, Arayasantiparb R, et al. Clinical application of deep learning for enhanced multistage caries detection in panoramic radiographs. Sci Rep. 2025;15(1):33491. doi: 10.1038/s41598-025-16591-4
- 20 Zhang X, Guo E, Liu X, Zhao H, Yang J, Li W, et al. Enhancing furcation involvement classification on panoramic radiographs with vision transformers. BMC Oral Health. 2025;25(1):153. doi: 10.1186/s12903-025-05431-6
- 21 van Nistelrooij N, Ghanad I, Bigdeli AK, Thiem DGE, von See C, Rendenbach C, et al. Automated detection and classification of osteolytic lesions in panoramic radiographs using CNNs and vision transformers. BMC Oral Health. 2025;25(1):950. doi: 10.1186/s12903-025-06209-6
- 22 Ibrahimi Hamamci et al. DENTEX: an abnormal tooth detection with dental enumeration and diagnosis benchmark for panoramic X-rays [Internet]. 2023. Available from: https://huggingface.co/datasets/ibrahimhamamci/DENTEX
- 23 He K, Zhang X, Ren S, Sun J. Deep Residual Learning for Image Recognition. 2016 IEEE Conference on Computer Vision and Pattern Recognition (CVPR). 2016:770-778. doi: 10.1109/cvpr.2016.90
- 24 Sundararajan M, Taly A, Yan Q. Axiomatic attribution for deep networks [Internet]. 2017. Available from: https://arxiv.org/abs/1703.01365
- 25 Simonyan K, Vedaldi A, Zisserman A. Deep inside convolutional networks: visualising image classification models and saliency maps [Internet]. 2014. Available from: https://arxiv.org/abs/1312.6034
- 26 Ancona M, Ceolini E, Oztireli C, Gross M. Towards better understanding of gradient-based attribution methods for deep neural networks [Internet]. 2018. Available from: https://arxiv.org/abs/1711.06104
- 27 Lee JH, Kim YT, Schwendicke F. Performance of artificial intelligence-based diagnosis and classification of peri-implantitis compared with periodontal surgeon assessment: a pilot study of panoramic radiograph analysis. J Periodontal Implant Sci. 2025;55(6):436. doi: 10.5051/jpis.2500280014
- 28 Balel Y, Sağtaş K. Deep learning-based approach to third molar impaction analysis with clinical classifications. Sci Rep. 2025;15(1):23688. doi: 10.1038/s41598-025-93783-y
- 29 Achararit P, Manaspon C, Jongwannasiri C, Kulthanaamondhita P, Itthichaisri C, Chantarangsu S, et al. Impacted lower third molar classification and difficulty index assessment: comparisons among dental students, general practitioners and deep learning model assistance. BMC Oral Health. 2025;25(1):152. doi: 10.1186/s12903-025-05425-4
- 30 Müller-Franzes G, Khader F, Siepmann R, Han T, Kather JN, Nebelung S, et al. Medical slice transformer for improved diagnosis and explainability on 3D medical images with DINOv2. Sci Rep. 2025;15(1):23979. doi: 10.1038/s41598-025-09041-8
- 31 Afnaan K, Arunbalaji CG, Singh T, Kumar R, Naik GR. Boosting brain tumor detection with an optimized ResNet and explainability via Grad-CAM and LIME. Brain Inf. 2025;12(1):33. doi: 10.1186/s40708-025-00279-6
Declarations
Funding
No financing
Conflict of interest
None
Authorship contributions
Drafting – original draft: Teng He, Wenya Long, Yingjuan Xie.
Writing–review and editing: Teng He, Wenya Long, Yingjuan Xie.