

Abstract
Introduction: Blind and low-vision individuals continue to encounter substantial barriers when accessing public transportation. Although technological solutions and design strategies have been developed to improve accessibility, their effectiveness has not been comprehensively synthesized. Methods: A systematic review was conducted in accordance with PRISMA 2020 guidelines. The methodological quality of included studies was assessed using the Mixed Methods Appraisal Tool (MMAT), and findings were integrated through a narrative synthesis structured according to the outcome hierarchy. Results: Of 912 records identified, 703 underwent screening, and 10 studies met the inclusion criteria. For the primary outcome, encompassing wayfinding and environmental detection, vehicle and route identification accuracy ranged from 96.89% to 100%, while in-station sign detection reached 0.97. An electronic travel aid also reduced cane use and collisions among 13 participants. Regarding secondary outcomes, perceived accessibility of a transit plaza ranged from 72% to 89%, while interface redesign improved task completion in simulated scenarios and reduced errors. Conclusions: Technological interventions demonstrate high levels of technical accuracy; however, only six studies included individuals with visual impairments in outcome assessments. Consequently, confidence in their effectiveness for supporting independent public transport use remains limited. Future research should prioritize direct assessments of users' travel behaviour and functional performance in real-world mobility settings.
Keywords
visual impairment, blindness, public transport, wayfinding, assistive technology, accessibility
INTRODUCTION
People who are blind or have low vision depend on public transport more than the general population, yet the built and digital environments of transit systems remain oriented toward sighted users.(1)
An estimated 43 million people worldwide were blind and a further 295 million had moderate or severe vision impairment in 2020, and most lived in low and middle income countries where accessible transport infrastructure is scarcest.(2)
For these travellers, the journey chain that links trip planning, walking to a stop, waiting, boarding, riding and alighting is interrupted at multiple points by information that is presented only visually, by uneven or obstructed walking surfaces, and by the absence of consistent audible or tactile cues.(1,3)
Surveys of blind and low vision adults describe the same recurring failures: stops whose identity cannot be confirmed from the vehicle, vehicles that arrive without audible route announcements, and stations in which braille signs exist but are placed where they cannot be found.(1,3)
The consequence is measurable: persons with visual impairments report elevated stress during transit use and reduced independent mobility, which restricts employment, health care and social participation.(4,5)
In response, two broad families of intervention have developed. The first family comprises technological aids, including smartphone navigation applications, computer vision systems that detect vehicles and route numbers, Bluetooth beacons and electronic travel aids that convert spatial information into audio or haptic output.(6,7)
More recently this family has incorporated artificial intelligence, with adaptive assistants that describe the environment, collective intelligence across internet of things devices and behaviour adaptive interfaces that respond to individual users, all of which remain mostly at the prototype stage.(8-11)
The second family comprises design interventions embedded in infrastructure, such as tactile paving, braille signage, audible announcements and the physical configuration of stations and transit plazas.(12,13)
Systematic reviews of wayfinding and mobility technologies have been published, but they concentrate on general pedestrian navigation rather than on public transport specifically, and they rarely separate the two families of intervention.(14-16)
A scoping review of access to public transport for people with visual disability confirmed that intervention studies are scarce and heterogeneous, which prevents decision makers from distinguishing what works from what has merely been prototyped.(12)
The primary outcome of interest in this review is wayfinding and detection performance, defined as the accuracy with which a technological or design intervention lets a traveller locate, identify or move through the elements of a public transport journey, and the secondary outcomes are usability, satisfaction, perceived safety and reported travel independence.
The distinction matters because technical accuracy does not automatically translate into independent use by people with visual impairments, a gap documented repeatedly in assistive technology research.(17,18)
Studies of walking environments also show that physical barriers and tactile surfaces condition what any assistive device can achieve, which makes the interaction between technology and infrastructure part of the outcome rather than a constant background.(19,20)
Several recent systems report near perfect detection in controlled conditions, but few are tested with the intended users, and even fewer measure whether travel behaviour changes.(21,22)
Needs assessments in diverse cities repeat the same finding: users ask for reliable orientation information and warning signals more than for additional sensing capacity.(23,24)
The objective of this systematic review was to synthesize the evidence on technological and design interventions intended to improve the independent use of public transport by people with visual impairments.
The review question was which technological and design interventions improve that independent use, examined through the primary outcome of wayfinding and detection performance and the secondary outcomes of usability, satisfaction, perceived safety and independence. The review deliberately included both technical validations and user centred evaluations, so that the distance between what a system detects and what a user accomplishes could be made visible, and it restricted its scope to the public transport journey while drawing on the wider wayfinding literature for interpretation rather than for evidence.
METHODS
This review followed the PRISMA 2020 statement and the PRISMA-S extension for reporting literature searches.(25,26)
Eligibility was defined with the PICOS elements. The population comprised people who are blind or have low vision, including users of white canes, guide dogs and residual vision. The intervention comprised any technological aid, such as a smartphone application, computer vision or beacon system, or any design intervention, such as tactile paving, braille signage, audible announcements or station configuration, intended to improve a stage of the public transport journey from trip planning to alighting.
The comparator was usual practice, no aid, or an alternative intervention. The outcomes were wayfinding and detection performance as the primary outcome, and usability, satisfaction, perceived safety and reported independence as secondary outcomes. Eligible designs included technical validations, usability studies, field evaluations, surveys and mixed methods studies, and grey literature was admissible when it reported an empirical evaluation, which allowed the inclusion of one institutional report.
Studies were excluded when the population did not include people with visual impairments, when the intervention did not target public transport, when no outcome was measured, when the record was a review, editorial or study protocol, or when the report duplicated an already included study. The bibliographic window was 2013 to 2026, consistent with the target volume, and no language restriction was applied.
Information sources and search strategy
Scopus, OpenAlex, Crossref and Semantic Scholar were searched. The core query combined population, transport and intervention terms, for example TITLE-ABS-KEY("visual impairment" OR "visually impaired" OR blind OR "low vision") AND TITLE-ABS-KEY("public transport" OR transit OR bus OR metro OR subway OR "railway station") AND TITLE-ABS-KEY(navigation OR wayfinding OR orientation OR mobility).
Four additional core queries broadened the intervention vocabulary to wayfinding, assistive technology, mobile applications, beacons, tactile paving, audible announcements and navigation aids, and four supporting queries targeted travel barriers, wayfinding outside transport, tactile maps and public transport accessibility for disability. All searches restricted publication year to 2013 to 2026, and each query was saved with its date and record count so that the strategy could be reproduced.
Study selection
Records were deduplicated by the retrieval tool and screened in two stages. At the title and abstract stage, records were classified as potentially eligible or excluded, and at the full text stage potentially eligible records were assessed against the eligibility criteria. Records whose title and abstract did not allow a decision were carried forward to full text rather than excluded for lack of information.
Full texts were retrieved only from legitimate open access locations, and records without an open access full text were recorded as not retrieved, with the reason preserved. The PRISMA flow diagram was generated from the recorded counts and was not adjusted by hand.
Data extraction
For each included study, one reviewer extracted study design, country, population, sample size, intervention, comparator, outcome and the main result, together with its location in the full text. Extraction recorded whether the outcome data came from people with visual impairments or from technical testing alone, because that distinction determined the placement of each study in the outcome hierarchy. The data items were chosen before extraction and were applied identically to all studies, so that a technical validation and a qualitative evaluation would contribute the same fields and the same rule for incomplete information. Fields without evidence in the retrieved text were left blank rather than completed by assumption.
Synthesis methods
Results were synthesized narratively and ordered by outcome hierarchy. The primary outcome was wayfinding and detection performance, the secondary outcomes were usability, satisfaction, perceived safety and reported independence, and additional analyses examined intervention category and the presence of users with visual impairments in outcome measurement. For each outcome domain, studies were grouped by whether the result came from technical testing or from users with visual impairments, and the grouping was used to judge how much weight the result could bear.
RESULTS
Study selection
The database searches identified 912 records, of which 209 were duplicates, leaving 703 records screened at the title and abstract stage (Figure 1). Scopus contributed 412 of the identified records, OpenAlex and Crossref contributed 200 each, and Semantic Scholar contributed 100. Of the 703 screened records, 606 were excluded and 97 reports were sought for retrieval. Full texts could not be retrieved for 76 reports because no open access version was available or the publisher blocked automated download.
The remaining 21 reports were assessed for eligibility, and 11 were excluded: six because the intervention did not target public transport, two because no outcome was measured, two because the population did not have visual impairments, and one because the record was a study protocol. Ten studies were included in the review.
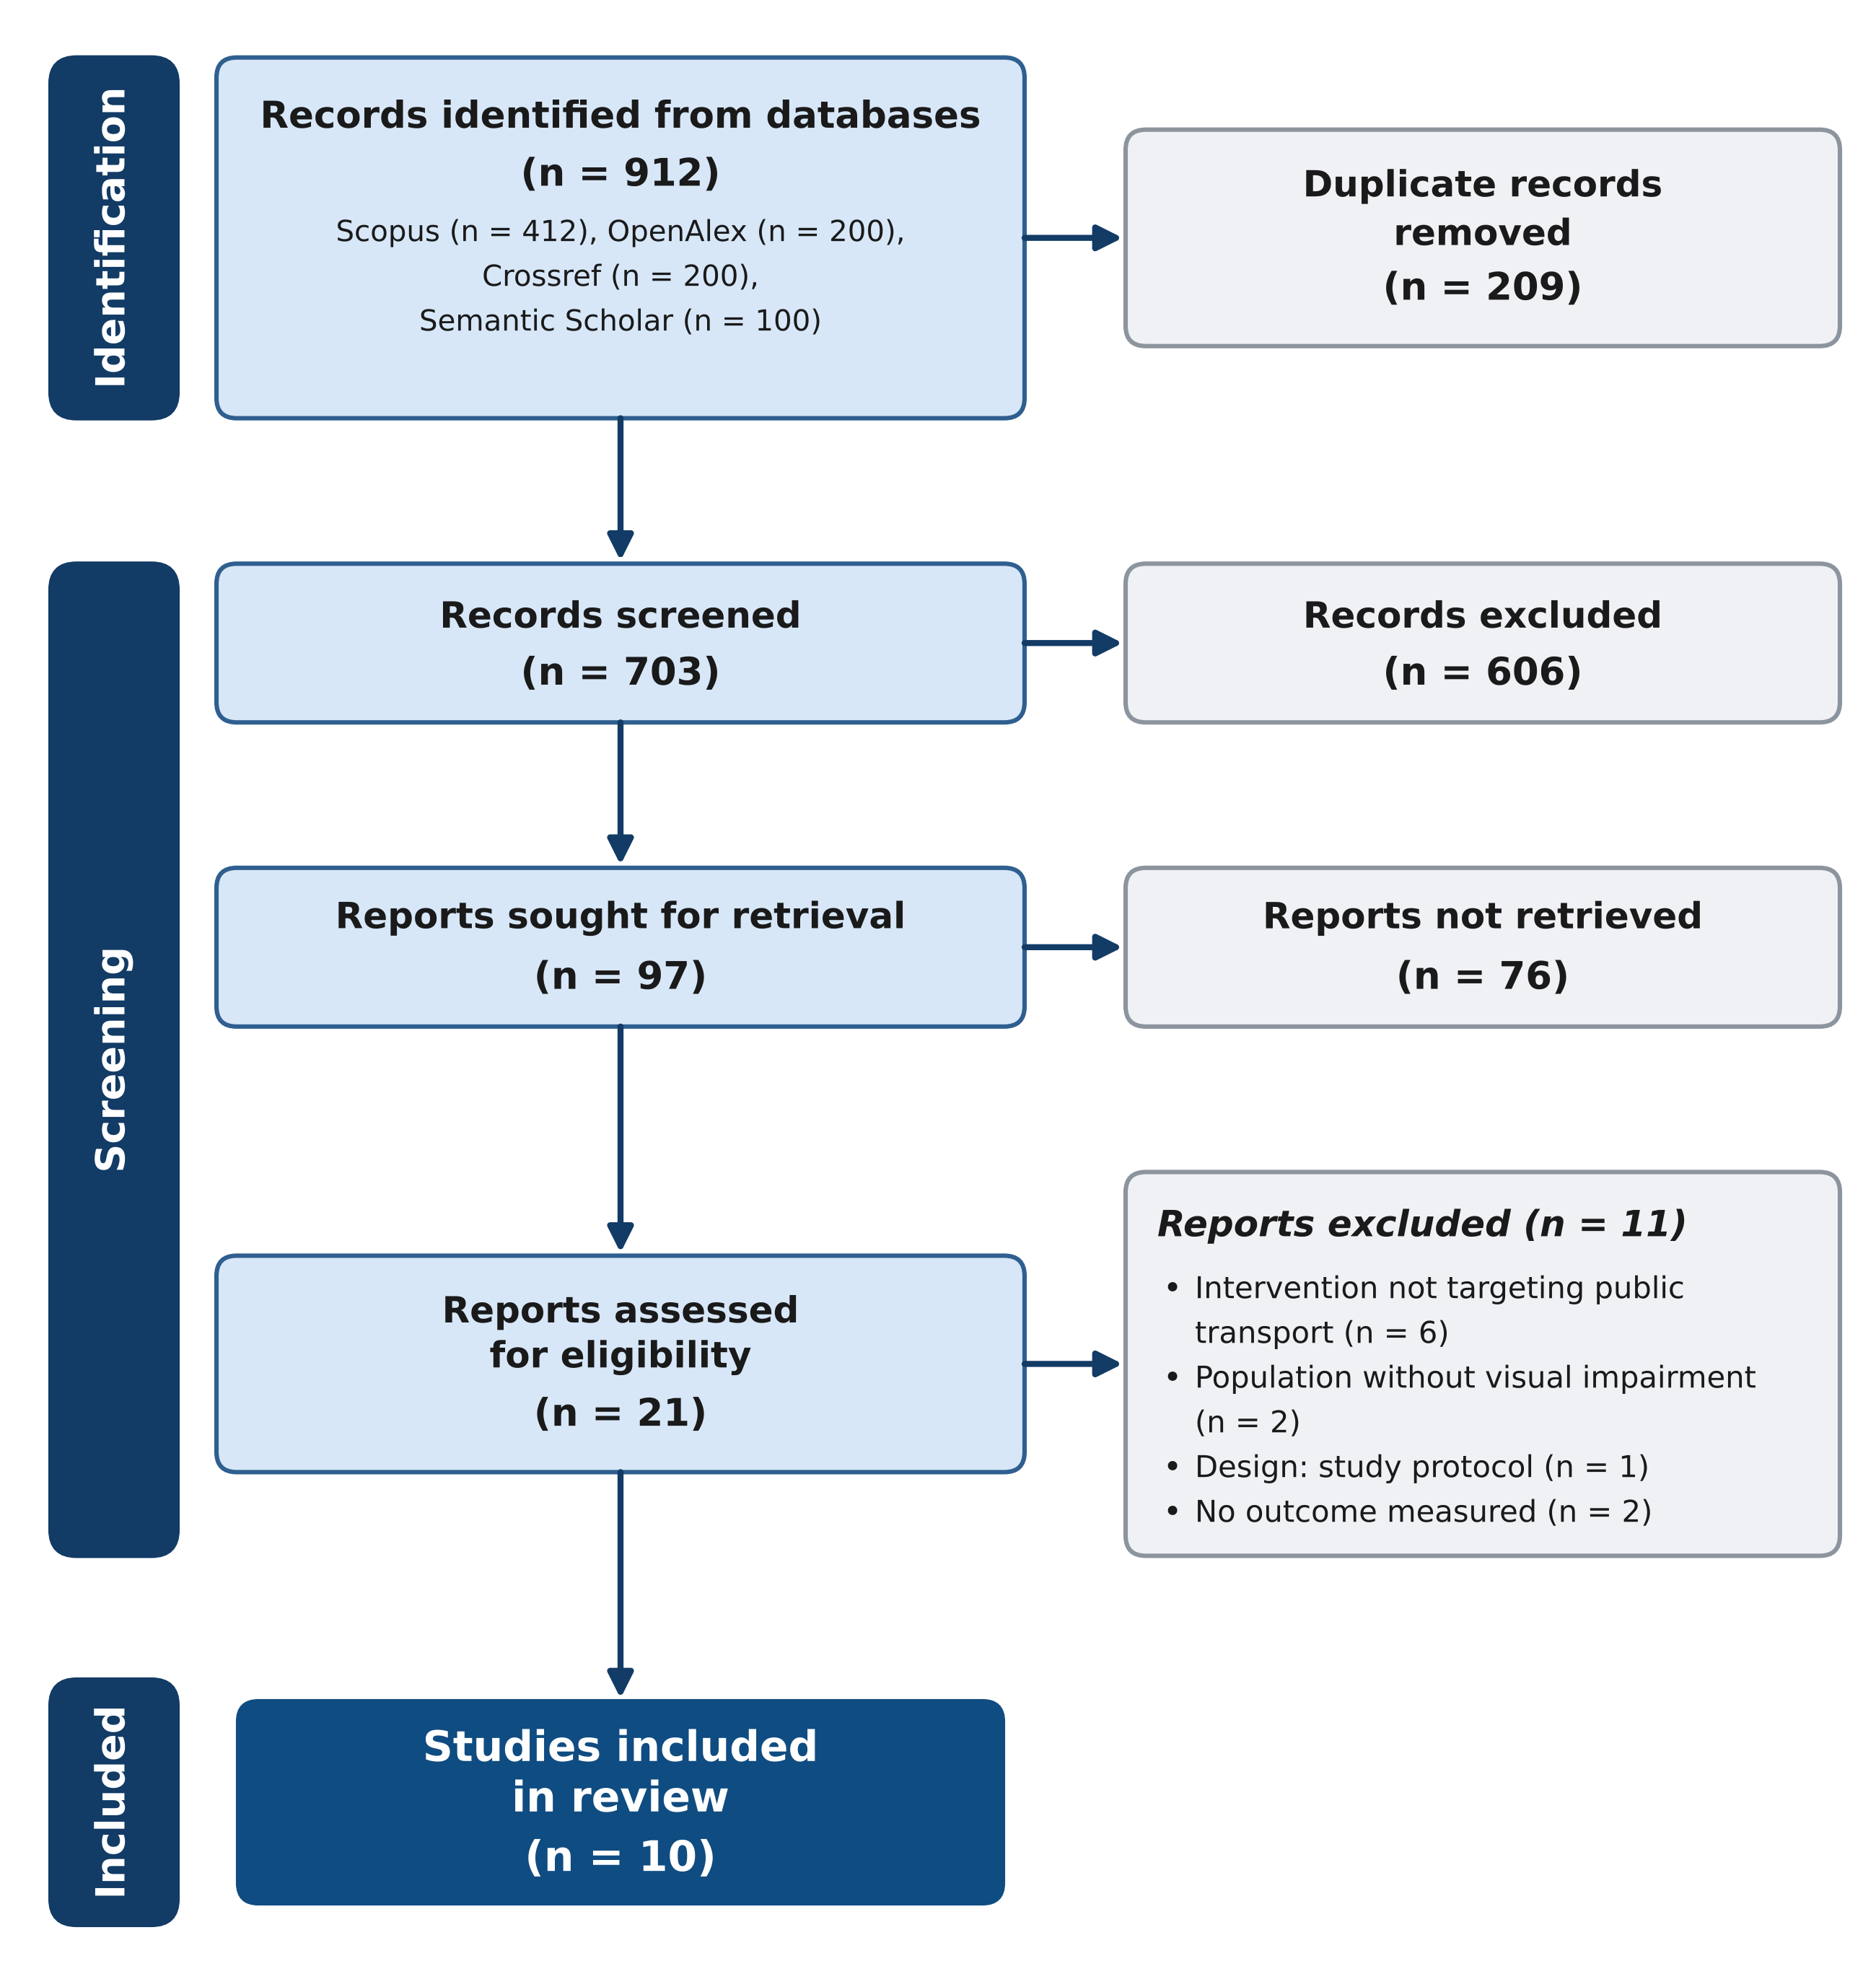
Figure 1. PRISMA 2020 flow diagram of study selection.
Characteristics of included studies
The ten included studies were published between 2018 and 2026 and originated from eight countries: Indonesia contributed three studies, and Austria, Denmark, India, Switzerland, Thailand, Ukraine and the United States contributed one each (Table 1). Four studies were technical validations of a system or model, one was a comparative evaluation of electronic travel aids, three were qualitative evaluations, one was a user centred design study and one was a mixed methods survey.
The interventions covered six categories: navigation within stations, identification of vehicles and route numbers, station and stop accessibility design, a transport booking interface, electronic travel aids for wayfinding, and system design dimensions. Six of the ten studies collected outcome data directly from people with visual impairments, and sample sizes were small or unreported in every study.
The station navigation studies addressed the middle mile problem of moving through a transit hub. Commute Booster combined the general transit feed specification with optical character recognition to read the directional signs that a traveller encounters inside New York City subway stations and to announce them in real time.(28)
The Copenhagen study evaluated the wider information environment of a transit network, comparing the information available to sighted commuters with what blind and partially sighted commuters could access, and it recommended audio announcements, beacon technology and stricter operator regulation as the highest value improvements.(29)
The vehicle identification studies addressed the moment of boarding: one model detected the bus, its door and its route number from a video sequence and returned a voice instruction, a second classified the smartphone viewpoint from which an approaching bus number could be read, and a third used YOLOv8 with optical character recognition and offline speech synthesis to detect vehicles and route numbers at stops.(30-32)
The station design studies evaluated physical accessibility: one appraised a refurbished transit plaza in Jakarta against technical standards and the experience of users with visual impairments, and one surveyed tactile orientation media across three train stations in Bandung.(33,34)
The remaining studies examined a transport booking interface, a tramway system as a whole and a pair of electronic travel aids.(13,35,36)
Study | Country | Design | Intervention | Outcome | Main result |
|---|---|---|---|---|---|
Feng et al., 2023(28) | United States | Technical validation | Commute Booster app (GTFS + OCR) for in-station navigation | Sign detection accuracy | 0.97 accuracy; 11 m range |
Ponnada et al., 2021(30) | India | Technical validation | Computer vision model for bus door and route number | Detection accuracy | 96.89% |
Bonita and Lukman, 2021(33) | Indonesia | Qualitative evaluation | Refurbished transit plaza | Perceived accessibility | 72-89% by segment |
Paul et al., 2018(29) | Denmark | Qualitative evaluation | Accessible transit information | Information accessibility | Recommendations only |
Tangsuksant et al., 2018(31) | Thailand | Technical validation | Smartphone viewpoint classification | Viewpoint classification | Successful; 8.70% error |
Zahib et al., 2022(35) | Indonesia | User centred design | Redesigned transport booking app | Completion and errors | Completion up; errors down |
Fadhlillah, 2022(34) | Indonesia | Mixed methods survey | Tactile orientation media in stations | Accessibility level | Minimum services not met |
Barkovska et al., 2025(32) | Ukraine | Technical validation | YOLOv8 + OCR + text to speech app | Detection accuracy | 100%; lower in low visibility |
Mimra et al., 2025(13) | Austria | Qualitative mixed methods | Tramway system and accessible design dimensions | Accessibility dimensions | Two-sense principle valued |
Pittet et al., 2026(36) | Switzerland | Comparative evaluation | Electronic travel aids (NOA and BuzzClip) | Cane use and collisions | Reduced with NOA |
Note: NR = not reported; BVI = blind and visually impaired.
Risk of bias
Methodological appraisal indicated high risk of bias across all included studies (Table 2). The technical validations did not involve users with visual impairments in outcome measurement, so their accuracy figures do not establish effects on independent use. The six studies that involved the target population used small or unreported samples, and the comparative evaluation of electronic travel aids did not describe blinding. No study randomized participants or controlled for confounding, and none reported a pre registered analysis.
For the qualitative evaluations, the appraisal raised concerns about the adequacy of sampling and about whether the interpretation was grounded in the participants accounts rather than in the researchers expectations. For the technical validations, the main concerns were the absence of user outcome data and the reporting of accuracy under favourable conditions without a stress test, with the single exception of the Ukrainian system that was evaluated under adverse weather.
Study | Design | BVI users in outcome data | Sample | Overall risk |
|---|---|---|---|---|
Feng et al., 2023(28) | Technical validation | No | 3 stations | High |
Ponnada et al., 2021(30) | Technical validation | No | NR | High |
Bonita and Lukman, 2021(33) | Qualitative evaluation | Yes | NR | High |
Paul et al., 2018(29) | Qualitative evaluation | Yes | NR | High |
Tangsuksant et al., 2018(31) | Technical validation | No | Roadside scenarios | High |
Zahib et al., 2022(35) | User centred design | Yes | NR | High |
Fadhlillah, 2022(34) | Mixed methods survey | Yes | 30 | High |
Barkovska et al., 2025(32) | Technical validation | No | Simulated conditions | High |
Mimra et al., 2025(13) | Qualitative mixed methods | Yes | NR | High |
Pittet et al., 2026(36) | Comparative evaluation | Yes | 13 | High |
Note: BVI = blind and visually impaired. Overall risk was assigned conservatively.
Primary outcome: wayfinding and detection performance
Four studies reported the primary outcome as technical detection accuracy. In the Commute Booster evaluation, in-station sign detection achieved an overall accuracy of 0.97 across three New York City subway stations, with a maximum detection range of 11 metres and an oblique field of view of approximately 110 degrees.(28)
Detection accuracy of 96.89 percent was reported for a computer vision model that identified the bus, its door and its route number,(30) and detection accuracy of 100 percent was reported for a YOLOv8 based application that recognized public transport vehicles and route numbers at stops under real and simulated weather conditions, although recognition robustness decreased under low visibility.(32)
For the viewpoint classification method intended to orient a smartphone toward an approaching bus, the classification was reported as successful across roadside scenarios, with a reference line error of 8.70 percent.(31)
One study measured the primary outcome as human wayfinding behaviour: in a comparison of two electronic travel aids, 13 participants with blindness or low vision used their canes less and collided less with obstacles when using one device than when using the other.(36) No study reported trip completion or travel frequency by users with visual impairments.
The technical figures were obtained under different conditions, which limits direct comparison. The 0.97 sign detection accuracy of Commute Booster was measured in three real subway stations but without participants with visual impairments, and it describes the recognition of signs rather than the completion of a journey.(28)
The bus door model of Ponnada and colleagues was validated in case studies under several scenarios and reported its accuracy for the combined task of locating the vehicle, its door and the boarding path, yet the number of test instances was not reported.(30)
The Ukrainian application was the only system tested under adverse weather, and its authors stated explicitly that recognition robustness decreased under low visibility, which is a more informative result than the ceiling accuracy of 100 percent obtained in clear conditions.(32)
The viewpoint classification method reported its result as a success criterion for roadside scenes and as an error term for the reference line rather than as a participant level outcome.(31) In the comparative evaluation, the improvement in cane use and collisions was measured in a controlled obstacle task rather than in a transit journey, so its transfer to public transport remains to be demonstrated.(36)
Across the five studies, the primary outcome therefore advanced from proof of detection to proof of concept, but it stopped short of the behaviour that the review set out to measure.
Secondary outcomes: usability, satisfaction, safety and independence
Among secondary outcomes, perceived accessibility of a refurbished transit plaza in Jakarta ranged from 72 percent to 89 percent across six segments, and people with visual impairments described mobility within the plaza as easy and safe although convenience differed from the technical standard.(33)
After a user centred redesign of a transport booking application, scenario completion increased and the number of errors decreased relative to the previous interface.(35)
In the evaluation of tactile orientation media at three train stations, 30 people with visual impairments reported that minimum service standards were not met and that universal design principles had not been applied.(34)
The qualitative evaluation of transit information in Copenhagen concluded that accessible information depended on audio announcements, regulation of bus operators, accessible mobile applications and beacon deployment, but it did not quantify an effect.(29)
A mixed methods study of visually impaired tramway passengers found that accessibility emerged from interactions between passengers, staff, devices and infrastructure, and that the two sense principle, with directional audio and tactile feedback, was particularly valued for warning signals.(13)
The direction of the secondary findings was consistent even where the magnitudes were not quantified. The transit plaza evaluation showed that a design intervention can meet technical accessibility standards while still falling short of user convenience, because the same segment was scored differently on compliance and on experience.(33)
The booking application redesign showed that interface simplification and features designed around the needs of blind users improved task performance, although the number of participants and the magnitude of the improvement were not reported.(35)
The train station survey showed that the presence of tactile media was not enough when the media had been designed around a visual logic and still relied on assistance from other people, a finding that echoes the Copenhagen recommendation to make information independently accessible.(29,34)
Taken together, the secondary outcomes describe a consistent pattern: design and user centred interventions moved user experience in the intended direction, while purely technical interventions provided no information about experience at all.
Additional analyses
When studies were grouped by intervention category, vehicle and route identification accounted for three studies, station navigation and information for two, station and stop accessibility design for two, and transport booking, electronic travel aids and system design dimensions for one study each (Table 3). Consistently, the studies that measured users with visual impairments reported the most cautious results, whereas the technical validations reported near ceiling accuracy without user outcome data. No study provided data for a quantitative comparison between intervention categories.
Grouped by geography, the included studies concentrated in middle income countries, with three studies from Indonesia and one each from India, Thailand and Ukraine, while high income countries contributed four studies. This distribution reflects where open access technical development is most active rather than where the population of blind and low vision travellers is largest, and it means the synthesis under represents sub-Saharan Africa and Latin America, where accessible transit evidence is scarcest.
Grouped by the involvement of users, the six studies that collected outcome data from people with visual impairments were exclusively the design, qualitative and comparative studies, and none of the four technical validations reported any user measurement. The pattern suggests that the field treats technical validation and user evaluation as separate activities rather than as stages of a single evaluation pathway.
Special considerations
Two features of the evidence base deserve explicit note. The first is the high proportion of reports that could not be retrieved: 76 of the 97 reports sought were unavailable as open access full text, and several of those, including evaluations of outdoor navigation assistance and of orientation and mobility in bus and subway networks, were directly on topic.
Their absence could not be filled by any of the included studies, and it means the primary outcome may over represent systems whose developers published open access technical reports rather than systems tested with users. The second feature is the absence of reported adverse effects or missing data across the included studies: none of the ten reports described harm, device abandonment or data loss, which is unlikely to reflect a genuinely risk free technology and more plausibly reflects the early stage and brevity of the evaluations. Both features reinforce the need to interpret the reported accuracies as promising rather than as evidence of effectiveness.
Outcome domain | Studies | Reported result |
|---|---|---|
Wayfinding and detection performance | 5(28,30-32,36) | Accuracy 0.97 to 100%; reduced cane use and collisions |
Usability and satisfaction | 3(13,33,35) | Completion up; accessibility 72-89%; two-sense principle valued |
Perceived safety and independence | 2(29,34) | Standards not met; recommendations only |
DISCUSSION
The principal finding of this review is that technological interventions for public transport access by people with visual impairments achieve high technical accuracy, with detection figures between 96.89 percent and 100 percent, while the evidence that these systems improve independent use by the intended users is thin. Only six of the ten included studies collected outcome data from people with visual impairments, none measured trip completion or travel frequency, and all were judged at high risk of bias.
The hierarchy of outcomes therefore shows a wide gap between the primary outcome of detection performance, which is well populated, and the secondary outcomes of usability, satisfaction, safety and independence, which rest on small, unreported or qualitative samples. The review answers its question in two parts: the field has demonstrated that vehicles, signs and stops can be detected reliably, and it has not yet demonstrated that this detection changes what a blind or low vision traveller can accomplish independently. This conclusion is more specific than the general statement that wayfinding technology works, because it separates the technical and behavioural claims that are often reported together.
The high technical accuracy reported here is consistent with the broader literature on assistive navigation. Systematic reviews of wayfinding tools and wearable orientation devices for people with visual impairments likewise document strong prototype performance and weak user centred evaluation.(14,15)
Comparable systems such as an outdoor navigation assistance application for public transportation and recent electronic travel aids report accurate localization and obstacle detection.(7,37)
The single included study that measured human wayfinding behaviour suggests that such benefits are achievable when users are actually tested, but the remaining public transport specific studies concentrated on object detection, an emphasis also visible in the mobility technology literature.(16)
Viewed against the journey chain, the included interventions cluster around two stages, the middle mile inside stations and the moment of boarding, and leave the first and last mile comparatively unaddressed within public transport evaluations. This is the inverse of the wider navigation literature, which is rich in first and last mile pedestrian systems and comparatively thin on station interiors, so the two bodies of work are complementary rather than overlapping.(38,39)
The practical consequence is that a blind traveller could in principle assemble a working journey from separate tools, one for the street, one for the station and one for the bus, but no included study evaluated such an integrated journey, and the integration burden falls on the user. The booking stage, which precedes all physical travel, was addressed by only one included study, despite being the stage at which a poorly designed interface first excludes blind users.(35)
The secondary outcome findings are also consistent with prior work. The perception that accessibility emerges from the interaction of passengers, staff, devices and infrastructure, rather than from any single intervention, was described for visually impaired tramway passengers in Linz, and it explains why segment level accessibility scores in the Jakarta transit plaza ranged from 72 to 89 percent instead of reaching a uniform standard.(13,33)
The finding that tactile orientation media did not meet minimum service standards parallels studies of tactile paving maintenance and of bus stop location errors, which identify the same discrepancy between design provision and daily usability.(34,40)
The journey experience of visually impaired people in London showed the same pattern at the scale of a whole network: the infrastructure existed, but its usefulness depended on information, staff behaviour and predictability rather than on the presence of any single feature.(1)
The general problem that transit accessibility metrics overstate the experience of users with disabilities has been termed accessibility misrepresentation, and it frames the present gap between technical and user measured outcomes.(41)
The interface redesign result adds a note of optimism: when design was driven by the observed behaviour of visually impaired users, task completion improved, which is consistent with the wider assistive technology literature on user centred design as a precondition for usable assistive systems.(9,35)
Several sources of heterogeneity explain the variation across studies. The first is measurement: technical validations quantify accuracy, whereas design evaluations quantify perceived accessibility or usability, so the two families of study are not directly comparable.(22)
The second is context: systems developed in North America, Southeast Asia and Europe differ in transit infrastructure, in the availability of connectivity and in the cultural expectations around assistance from fellow passengers.(5,23)
The third is the population: low vision and blindness span very different degrees of residual sight, and interventions that suit one subgroup, such as optical character recognition for near text, may be irrelevant to another.(24)
The fourth is the maturity of the technology, since beacon and computer vision systems evaluated in controlled conditions consistently outperform the same systems under rain, snow or low light, as the Ukrainian application showed.(32) None of these sources was reported with enough consistency to be modelled quantitatively, so the synthesis could only describe them.
The navigation systems developed outside public transport nevertheless point to transferable design principles. Camera based positioning applications such as GoodMaps and indoor outdoor systems such as CityGuide demonstrate that accurate localization can be achieved without new infrastructure, while audio vibratory maps and tactile map production methods show that the format of spatial information, not only its accuracy, determines usability for blind users.(38,42-44) Comparative studies of wayfinding modalities and of obstacles to indoor wayfinding converge on the same conclusion: users prefer multimodal feedback and struggle when a single sensory channel carries all navigation information.(39,45)
Accessible maps proposed for inclusive ridesharing extend these principles to vehicle based services, which suggests that the booking and in vehicle stages of a journey could adopt the same audio first design language.(46)
The two sense principle identified by the included tramway study, in which warning signals should reach the user through two sensory channels rather than one, is a concrete translation of this multimodal requirement that transit agencies could specify in their accessibility standards.(13)
The gap between technical and experienced accessibility is also recognized in the transport planning literature. Participatory methods that bridge conceived and perceived public transport accessibility, and system facilitated accessibility metrics, have been proposed precisely because conventional network measures miss the barriers that matter to users with disabilities.(47,48)
Equity oriented analyses built on general transit feed specification data and planning studies in mid sized cities reach the same conclusion: accessibility for people with disabilities requires user informed measures rather than aggregate network indicators.(49,50)
These planning insights reinforce the methodological message of this review, which is that detection accuracy alone is an insufficient outcome for assistive transport technology.
Several mechanisms plausibly explain why high detection accuracy did not translate into demonstrated independence. The first is cognitive load: a system that detects a sign or a vehicle still requires the user to integrate sequential audio instructions with residual sight, hearing and haptic cues while walking, and that integration cost is not captured by detection metrics.(24,39)
The second is trust and calibration: users abandon aids that produce unpredictable or unexplained errors, and trust grows slowly through repeated successful use, which single session technical validations cannot observe.(17) The third is infrastructure dependence: computer vision and beacon systems perform only where signs, connectivity and maintenance are adequate, so accuracy measured in a well provisioned station does not generalize to the degraded environments where blind travellers most need help.(19,20) The fourth is the mismatch between the intervention and the users priorities, since needs assessments consistently rank reliable warning signals and orientation information above additional detection features.(23)
The uniformly high risk of bias also has a field level consequence. When every evaluation lacks a controlled comparison, the literature cannot distinguish a genuinely effective system from a well described prototype, and decision makers lack the counterfactual they would need to judge whether an investment in one intervention is better than an investment in another.
The absence of adverse event reporting compounds the problem, because it removes the signal that would normally separate mature technologies from early prototypes. A shared reporting standard for assistive transport evaluations, analogous to those used in clinical assistive technology research, would make the next generation of studies more useful than the current one.(27)
The review has strengths that should be weighed against its limitations. It is, to our knowledge, the first synthesis restricted to public transport rather than to wayfinding in general, and it separated the primary outcome of detection performance from the secondary outcomes that matter to users. It recorded the search strategy with dates and record counts, it distinguished technical from user measured outcomes for every included study, and it did not adjust the flow diagram counts by hand. These choices make the central finding, that the evidence base is technically rich and behaviourally thin, a property of the literature rather than an artefact of the synthesis.
The findings also align with and extend a prior scoping review of access to public transport for people with visual disability, which concluded that intervention studies were scarce and heterogeneous.(12)
The present review quantifies that scarcity, locating ten evaluative studies across a thirteen year window, and it adds the outcome hierarchy that the scoping review could not, by separating what the systems detect from what the users accomplish. The two reviews together support a single recommendation: the field should stop multiplying single purpose prototypes and start running controlled, user centred evaluations of the most promising systems.
Limitations
Only six of the ten included studies measured outcomes in people with visual impairments, and sample sizes were small or unreported, so a large part of the primary outcome rests on technical proxies; future studies should recruit representative samples of blind and low vision users and report travel behaviour such as trip completion.
Most included studies were technical validations without comparators, which prevents estimation of effects relative to usual practice; controlled before and after designs in real transit settings would strengthen this evidence base.
Full text could not be retrieved for 76 of 97 potentially eligible reports because of paywalls and publisher blocks, so some eligible evaluations, including several on public transport navigation, may have been missed; future reviews could complement database searches with hand searching of assistive technology conference proceedings.
Implications
For practice, transit agencies should treat high technical accuracy as necessary but not sufficient, and should require that assistive navigation systems be validated with blind and low vision users before deployment. Design standards for tactile paving, audible announcements and station information should be audited against the user experience, because provision alone did not guarantee perceived accessibility in the included studies. Agencies that procure vehicle and route recognition systems should specify that the vendor report accuracy under degraded conditions, since the one system tested in rain, snow and low light performed worse precisely when its users would need it most.(32)
Wayfinding applications should adopt a multimodal, audio first design, given that the included users valued directional audio and tactile feedback for warnings and that single channel interfaces performed poorly in adjacent wayfinding research.(13,45)
These recommendations follow directly from the included evidence and do not depend on extrapolation from studies conducted outside the public transport context, which keeps them conservative and reproducible for agencies that operate transit networks.
For research, the field needs a shared set of outcome measures for independent public transport use, so that detection accuracy, wayfinding success and reported independence can be compared across interventions rather than reported in incompatible units. Those measures should be collected from people with visual impairments, not only from technical benches, and should include trip completion, time, errors, assistance requests and abandonment, in addition to detection accuracy.
Evaluations should move from single session prototypes toward repeated use in real journeys, because trust and calibration, which the included studies could not observe, are plausibly the mechanisms that convert technical performance into independence.(17)
Until such evidence exists, claims that a navigation or design intervention improves independent public transport use should be treated with the same caution that the high risk of bias ratings in this review require.
CONCLUSIONS
Technological and design interventions for public transport use by people with visual impairments achieve high technical detection accuracy, between 96.89 percent and 100 percent for vehicle and route recognition and 0.97 for in-station sign detection, but this performance has not been translated into demonstrated improvements in independent travel. The secondary outcomes of usability, satisfaction, perceived safety and independence are supported only by small, largely qualitative studies, and all ten included studies were at high risk of bias. The evidence therefore supports a conditional conclusion: the technology is mature enough to warrant deployment in controlled pilots, but it is not yet mature enough to justify claims of independent mobility.
The implication for the field is that the next generation of evaluations should measure what users with visual impairments actually accomplish during a public transport journey, not only what the technology detects. Until such evidence exists, transit agencies should commission user centred validation of any navigation or design intervention before relying on it as an accessibility solution, and funders should require outcome measures of trip completion, errors and abandonment alongside detection accuracy.
References
- 1 Low WY, Cao M, De Vos J, Hickman R. The journey experience of visually impaired people on public transport in London. Transport Policy. 2020;97:137-148. doi: 10.1016/j.tranpol.2020.07.018
- 2 Steinmetz JD, Bourne RRA, Briant PS, Flaxman SR, Taylor HRB, Jonas JB, et al. Causes of blindness and vision impairment in 2020 and trends over 30 years, and prevalence of avoidable blindness in relation to VISION 2020: the Right to Sight: an analysis for the Global Burden of Disease Study. The Lancet Global Health. 2021;9(2):e144-e160. doi: 10.1016/s2214-109x (20)30489-7
- 3 Crudden A, McDonnall MC, Hierholzer A. Transportation: An Electronic Survey of Persons who Are Blind or Have Low Vision. Journal of Visual Impairment & Blindness. 2015;109(6):445-456. doi: 10.1177/0145482x1510900603
- 4 Crudden A, Cmar JL, McDonnall MC. Stress Associated with Transportation: A Survey of Persons with Visual Impairments. Journal of Visual Impairment & Blindness. 2017;111(3):219-230. doi: 10.1177/0145482x1711100303
- 5 Silveira CS, Dischinger M. The orientation and mobility of visual impaired people in bus and subway networks in Brazil. Ambient constr. 2019;19(1):195-208. doi: 10.1590/s1678-86212019000100301
- 6 Fernandes H, Costa P, Filipe V, Paredes H, Barroso J. A review of assistive spatial orientation and navigation technologies for the visually impaired. Univ Access Inf Soc. 2019;18(1):155-168. doi: 10.1007/s10209-017-0570-8
- 7 Kuriakose B, Shrestha R, Sandnes FE. Multimodal Navigation Systems for Users with Visual Impairments—A Review and Analysis. MTI. 2020;4(4):73. doi: 10.3390/mti4040073
- 8 Hersh M. Mobility Technologies for Blind, Partially Sighted and Deafblind People: Design Issues. In: Signals and Communication Technology. Springer Nature Switzerland; 2026. p. 453-494. doi: 10.1007/978-3-031-91550-5_17
- 9 Acheampong E, Kasore V, Kponyo Agyei B, Owusu-Ansah RY, Owusu Ansah JK, Owusu-Ansah E, et al. Integrating artificial intelligence into design and development of assistive technologies: user needs and preferences in Ghana. Journal of Enabling Technologies. 2026;20(3):177-187. doi: 10.1108/jet-10-2025-0081
- 10 Nasabeh S, Meliá S, Aragonés J, Leporini B, Gadzhimusieva D. Collective intelligence in adaptive IoT-based assistive technologies for visually impaired users in indoor environments. Internet of Things. 2026;39:102070. doi: 10.1016/j.iot.2026.102070
- 11 Algamdi SA. A behaviour-adaptive AI assistant enhancing accessibility and usability for blind users through real-time interaction personalization. Sci Rep. 2026;16(1):12666. doi: 10.1038/s41598-026-43320-2
- 12 Boadi-Kusi SB, Amoako-Sakyi RO, Abraham CH, Addo NA, Aboagye-McCarthy A, Gyan BO. Access to public transport to persons with visual disability: A scoping review. British Journal of Visual Impairment. 2024;42(1):71-85. doi: 10.1177/02646196231167072
- 13 Mimra D, Kaar D, Del Re E, Certad N, Cherian Varughese J, Seibt D, et al. Understanding Visually Impaired Tramway Passengers' Interaction with Public Transport Systems. AHFE International. 2025;186:199-208. doi: 10.54941/ahfe1006509
- 14 Parker AT, Swobodzinski M, Wright JD, Hansen K, Morton B, Schaller E. Wayfinding Tools for People With Visual Impairments in Real-World Settings: A Literature Review of Recent Studies. Front Educ. 2021;6:723816. doi: 10.3389/feduc.2021.723816
- 15 Santos ADPD, Suzuki AHG, Medola FO, Vaezipour A. A Systematic Review of Wearable Devices for Orientation and Mobility of Adults With Visual Impairment and Blindness. IEEE Access. 2021;9:162306-162324. doi: 10.1109/access.2021.3132887
- 16 Madake J, Bhatlawande S, Solanke A, Shilaskar S. A Qualitative and Quantitative Analysis of Research in Mobility Technologies for Visually Impaired People. IEEE Access. 2023;11:82496-82520. doi: 10.1109/access.2023.3291074
- 17 Acheampong E, Kasore V, Kponyo BA, Owusu-Ansah RY, Owusu-Ansah JK, Ansah O, et al. Barriers to assistive technology uptake among persons with disabilities in selected urban districts in Ghana. Sci Rep. 2025;16(1):1838. doi: 10.1038/s41598-025-31466-4
- 18 Asiri AM, Barayan AMA, Almutairi AAAM, Alamri JM. Artificial intelligence and the enhancement of quality of life for individuals with visual impairments: a systematic review. Discov Educ. 2026;5(1):454. doi: 10.1007/s44217-026-01173-x
- 19 Pozzobon OJ, Bertagnolli LG, Cervo TC, Ruiz-Padillo A. Evaluating urban accessibility barriers to walking for people with physical–motor and visual disabilities: A FAHP-based approach. Habitat International. 2026;174:103867. doi: 10.1016/j.habitatint.2026.103867
- 20 Rafful Garfias FJ, Namboodiri V, Joseph S. Quantifying Navigational Difficulty for Visually Impaired Users in Indoor Spaces with AccessQuotient. Proceedings of the 27th International ACM SIGACCESS Conference on Computers and Accessibility. 2025:1-5. doi: 10.1145/3663547.3759696
- 21 Teran LA, Lorrane Nobre Melo G, Souza Da Costa Silva S, Christoph De Oliveira Käppler K, Pereira Mota M. Navigating the Last Decade: A Systematic Literature Review on Accessible Georeferencing Mobile Apps. IEEE Access. 2025;13:191941-191958. doi: 10.1109/access.2025.3630560
- 22 Feghali JM, Feng C, Majumdar A, Ochieng WY. Comprehensive Review: High-Performance Positioning Systems for Navigation and Wayfinding for Visually Impaired People. Sensors. 2024;24(21):7020. doi: 10.3390/s24217020
- 23 Said H. Awad. Evaluation of the Needs of Individuals with Visual Impairments in Jerusalem and Its Suburbs: An Analytical Study of Available Services. jidmis. 2026;3(7s):644-670. doi: 10.59543/jidmis.v3.1714
- 24 Papadopoulos K, Koustriava E, Kouroupetroglou G, Gumus SS, Stylianidis E, Müller K, et al. Environmental information required by individuals with visual impairments who use orientation and mobility aids to navigate indoor places. British Journal of Visual Impairment. 2025;43(3):755-765. doi: 10.1177/02646196241270765
- 25 Page MJ, McKenzie JE, Bossuyt PM, Boutron I, Hoffmann TC, Mulrow CD, et al. The PRISMA 2020 statement: an updated guideline for reporting systematic reviews. BMJ. 2021:n71. doi: 10.1136/bmj.n71
- 26 Rethlefsen ML, Kirtley S, Waffenschmidt S, Ayala AP, Moher D, Page MJ, et al. PRISMA-S: an extension to the PRISMA Statement for Reporting Literature Searches in Systematic Reviews. Syst Rev. 2021;10(1):39. doi: 10.1186/s13643-020-01542-z
- 27 Hong QN, Fàbregues S, Bartlett G, Boardman F, Cargo M, Dagenais P, et al. The Mixed Methods Appraisal Tool (MMAT) version 2018 for information professionals and researchers. EFI. 2018;34(4):285-291. doi: 10.3233/efi-180221
- 28 Feng J, Beheshti M, Philipson M, Ramsaywack Y, Porfiri M, Rizzo JR. Commute Booster: A Mobile Application for First/Last Mile and Middle Mile Navigation Support for People With Blindness and Low Vision. IEEE J Transl Eng Health Med. 2023;11:523-535. doi: 10.1109/jtehm.2023.3293450
- 29 Paul AM, Flynn CGL, Panneton J, Komissar JI. Improving Accessibility of Public Transport Information for the Blind [Internet]. Worcester Polytechnic Institute; 2018. Available from: https://digital.wpi.edu/downloads/sx61dm63g
- 30 Ponnada S, Sekharamantry PK, Dayal A, Yarramalle S, Vadaparthi N, Hemanth J. An assisting model for the visually challenged to detect bus door accurately. TELKOMNIKA. 2021;19(6):1924. doi: 10.12928/telkomnika.v19i6.19811
- 31 Tangsuksant W, Wada C. Classification of Viewpoints Related to Bus-Waiting for the Assistance of Blind People. International Journal of New Technology and Research. 2018;4(9). doi: 10.31871/ijntr.4.9.16
- 32 Барковська ОЮ, Нечітайло ОВ, Сердечний ВС, Батурін ОО. Software Application for Assisting Visually Impaired Persons at Public Transport Stops. ІКСЗТ. 2025;30(3):38-48. doi: 10.18664/ikszt.v30i3.351322
- 33 Bonita T, L. Lukman A. ACCESSIBILITY EVALUATION OF THE TRANSIT PLAZA OF TANAH ABANG STATION ACCORDING TO USERS WITH VISUAL IMPAIRMENT. RISA. 2021;6(01):1-19. doi: 10.26593/risa.v6i01.5423.1-19
- 34 Fadhlillah F. Surveillance on Tactile-Based Media Accessibility Levels for the Visually Impaired in Bandung Train Stations. INKLUSI. 2023;9(2):145-166. doi: 10.14421/ijds.090202
- 35 Zahib MA, Effendy V, Darwiyanto E. Designing User Experience for Improving Mobile Application Accessibility Online Transport Booking for Visually-Impaired User With User-Centered Design: A Case Study of Grab. josh. 2022;4(1):42-52. doi: 10.47065/josh.v4i1.2246
- 36 Pittet CE, Ortega EV, Fabien M, Wallace MT, Gori M, Murray MM. Efficacy of electronic travel aids for the blind and visually impaired during wayfinding. Sci Rep. 2026;16(1):6423. doi: 10.1038/s41598-026-37578-9
- 37 Martinez-Cruz S, Morales-Hernandez LA, Perez-Soto GI, Benitez-Rangel JP, Camarillo-Gomez KA. An Outdoor Navigation Assistance System for Visually Impaired People in Public Transportation. IEEE Access. 2021;9:130767-130777. doi: 10.1109/access.2021.3111544
- 38 Cheraghi SA, Namboodiri V, Arsal G. CityGuide: a seamless indoor–outdoor wayfinding system for people with vision impairments. Univ Access Inf Soc. 2024;23(4):1843-1855. doi: 10.1007/s10209-023-01009-7
- 39 Heydarian CH, Hanuschock WE, Baguhn SJ, Wong C, Silverman AM. Way to Go: Obstacles and Solutions to Indoor Wayfinding for People Who Are Blind or Have Low Vision. Journal of Visual Impairment & Blindness. 2025;119(6):516-523. doi: 10.1177/0145482x251397990
- 40 Elorduy JL, Awodele IA. Assessing bus stop accessibility for persons with reduced mobility in Durban, South Africa. Proceedings of the Institution of Civil Engineers - Municipal Engineer. 2026:1-14. doi: 10.1680/jmuen.26.00031
- 41 Qu Y, Currie G, Webb GI. “Accessibility misrepresentation” in public transport. Journal of Transport Geography. 2026;133:104632. doi: 10.1016/j.jtrangeo.2026.104632
- 42 Palilonis J. GoodMaps: Assessing an Indoor Navigation App Built on Camera-based Positioning. AHFE International. 2024;157:544-555. doi: 10.54941/ahfe1005514
- 43 Sargsyan E, Oriola B, Serrano M, Jouffrais C. Audio-Vibratory You-Are-Here Mobile Maps for People with Visual Impairments. Proc ACM Hum-Comput Interact. 2024;8(ISS):624-648. doi: 10.1145/3698151
- 44 Eraslan A, Doğru AÖ, Uluğtekin NN. User Experience-Based Evaluation of Tactile Map Production Methods for Wayfinding Among People with Visual Impairments. IJGI. 2026;15(7):326. doi: 10.3390/ijgi15070326
- 45 Swobodzinski M, Parker AT, Schaller E, Snow D. An exploratory comparative analysis of wayfinding modalities across indoor and outdoor environments: performance and individual characteristics of visually impaired travelers. GeoJournal. 2026;91(2):35. doi: 10.1007/s10708-026-11590-y
- 46 Fink PDS, Milne H, Caccese A, Alsamsam M, Loranger J, Colley M, et al. Accessible Maps for the Future of Inclusive Ridesharing. Proceedings of the 16th International Conference on Automotive User Interfaces and Interactive Vehicular Applications. 2024:106-115. doi: 10.1145/3640792.3675736
- 47 Conesa A, Dere I, Nihoul A, Descamps J, Enaux C, Hayirlioglu M, et al. Routes to justice: bridging conceived and perceived public transport accessibility through user participation. Transportation. 2026;53(7):5093-5120. doi: 10.1007/s11116-025-10678-7
- 48 Yadav M, Patil GR, Mepparambath RM. New public transit accessibility metrics: system and system-facilitated accessibility measures. Transportation Research Part A: Policy and Practice. 2026;212:105158. doi: 10.1016/j.tra.2026.105158
- 49 Pourramazani H, Gielen E, Miralles-Garcia JL. Equity-Oriented Public Transport Accessibility Analysis Using GTFS, Spatial Proximity, and Demographic Sensitivity. Sustainability. 2026;18(9):4506. doi: 10.3390/su18094506
- 50 Quang NT, Ngoc AM, Nguyen-Ngoc D, Truong NH, Minh CC, Minh Hieu N. Inclusion and equity from accessibility lens: A study of public transit planning practice in mid-sized urban contexts in developing countries. Journal of Urban Mobility. 2026;10:100245. doi: 10.1016/j.urbmob.2026.100245
Declarations
Funding
No financing
Conflict of interest
None
Authorship contributions
Drafting – original draft: Derly Katerine Vargas Salamanca, Rocío de la Cruz Hernández, Lilian del Carmen López.
Writing–review and editing: Derly Katerine Vargas Salamanca, Rocío de la Cruz Hernández, Lilian del Carmen López.