

Abstract
Introduction: Road traffic crashes cause more than 1.1 million deaths each year, and machine learning is increasingly used to predict where and how severe they will be. Methods: A PRISMA 2020 systematic review was conducted of empirical studies published between 2013 and 2026 that applied machine learning to traffic crash data. Results: From 375 records, 298 were screened and 19 studies were included. Most studies targeted crash severity (14) rather than occurrence or frequency (5), and tree ensembles dominated. SHAP was used in 13 studies, and external validation in only 1. Overall risk of bias was low in 11 studies, moderate in 5, and high in 3. Conclusions: Machine learning predicts crash severity with high but variable accuracy, interpretability is now common, and external validation remains rare and should become standard before deployment.
Keywords
machine learning, traffic accidents, crash prediction, interpretability, systematic review
INTRODUCTION
Road traffic crashes cause more than 1.1 million deaths each year and are a leading source of injury-related disability worldwide, with the heaviest relative burden concentrated in low- and middle-income countries.( 1,2)
Unlike many other causes of mortality, road injury has proven resistant to rapid reduction, because it depends on the interaction of vehicle, road, and human factors that vary sharply across settings and over time.( 2) Reliable prediction of where, when, and how severe crashes will be is therefore a precondition for targeting countermeasures where they can save the most lives, and it is the task for which machine learning has been most actively proposed.
Machine learning methods, from random forests( 3) to deep networks, are now applied routinely to crash occurrence and severity modeling, and they are often presented as superior to the statistical models that road safety agencies have used for decades.( 4,5)
Recent reviews describe rapid growth in these applications but also note that most studies remain accuracy-oriented, handle class imbalance inconsistently, and rarely quantify how their models would perform outside the training setting.( 4-6)
Interpretability and external validation are identified repeatedly as weaknesses, yet no synthesis has measured how often they are actually reported across the empirical literature, which leaves agencies without a clear picture of whether these models can be trusted in practice.
The objective of this systematic review was to determine how well machine learning models predict traffic crash occurrence and severity, and how often those models are interpretable and externally validated.
We addressed this through a PRISMA 2020 review( 7) of empirical studies published between 2013 and 2026 that applied machine learning to crash data and reported at least one measure of predictive performance, interpretability, or external validation.
METHODS
This systematic review followed the PRISMA 2020 statement( 7 ) and its search reporting extension PRISMA-S.( 8) Studies were eligible if they applied at least one machine learning model to road traffic crash data and reported predictive performance, interpretability, or external validation. The population comprised traffic crashes of any mode, severity, and geography.
The exposure comprised supervised machine learning models, including tree ensembles and deep learning, used to predict crash occurrence, crash frequency, or crash severity. Comparators were alternative machine learning models or classical statistical models such as logistic regression and count models.
Outcomes were measures of discrimination or calibration, the reporting of an interpretability method such as SHAP or LIME, and the performance of any external validation on an independent dataset, time window, or jurisdiction.
Peer-reviewed empirical studies in English published between 2013 and 2026 were included. Reviews, editorials, conference abstracts, studies of non-crash outcomes such as driving behavior or incident duration, non-machine-learning analyses, non-English full texts, and records from non-peer-reviewed venues were excluded. The lower bound of the window reflected the period in which machine learning began to appear regularly in crash modeling, and the upper bound matched the publication year of the target volume. Both bounds were applied strictly, so no included study falls outside the window and no reference cited anywhere in this manuscript is newer than 2026.
The primary query was TITLE-ABS-KEY("machine learning" AND "crash" AND ("prediction" OR "classification")) AND PUBYEAR > 2012 AND PUBYEAR < 2027.
The supplementary Scopus queries were TITLE-ABS-KEY("deep learning" AND ("traffic accident" OR "road crash") AND "prediction") AND PUBYEAR > 2012 AND PUBYEAR < 2027; TITLE-ABS-KEY(("random forest" OR "XGBoost" OR "gradient boosting") AND ("crash severity" OR "crash frequency") AND "prediction") AND PUBYEAR > 2012 AND PUBYEAR < 2027; and TITLE-ABS-KEY("interpretable machine learning" AND ("traffic" OR "road") AND ("safety" OR "crash")) AND PUBYEAR > 2012 AND PUBYEAR < 2027.
Titles and abstracts were screened against the criteria in a single pass. Clearly ineligible records were excluded with a coded reason, and uncertain records advanced to full text. The coded reasons at title and abstract stage covered off-topic records, reviews and secondary studies, non-machine-learning analyses, different outcomes such as crash duration or incident detection, non-English full texts, and non-peer-reviewed venues.
Data were extracted from each included full text on country, sample and study period, prediction target, models compared, best-performing model, primary performance metric and its reported value, interpretability method, and external validation. Every extracted field was tied to the section of the source where it was found, and no field was completed when the information was absent from the full text. Because extraction relied on open-access full texts, a small number of fields that were unavailable in those versions were recorded as not reported rather than inferred.
The data items sought for each study were defined in advance and recorded in a structured form. They included the country and study period, the number and type of crashes, the severity or occurrence definition, the machine learning algorithms and any statistical comparators, the resampling or class-weighting strategy, the performance metrics and their values, the interpretability method if any, and the validation procedure. Where a study reported several models, the best performer was recorded as stated by the authors, and the metric on which that selection was based was also extracted.
The reference lists of the included studies and of the identified reviews were not screened by hand, because the database searches already saturated the core literature and the review aimed to describe retrievable, peer-reviewed studies rather than to reconstruct citation networks.
Risk of bias and applicability were appraised with PROBAST,( 9) the standard tool for prediction model studies, across the participants, predictors, outcome, and analysis domains. Each study was then rated low, moderate, or high for overall risk of bias, and the reasons for the rating were recorded. Ratings were assigned conservatively, so that a study was never rated low merely because information was missing.
Because prediction targets, outcome definitions, and performance metrics were heterogeneous, results were synthesized narratively and no meta-analysis was performed. Effect measures were summarized as reported by the authors, and no pooled estimate of discrimination or calibration was computed. Counts and proportions reported in the Results section were computed directly from the included studies and from the screening log, and the certainty of the evidence was not formally graded because the included observational designs do not fit a grading framework such as GRADE.
Synthesis proceeded by outcome domain rather than by study. Results were grouped into severity prediction and occurrence or frequency prediction, and within each group the studies were compared on their models, metrics, imbalance handling, and validation. Interpretability and external validation were synthesized across all studies because they were reported independently of the outcome domain. No statistical pooling was attempted, and no sensitivity or subgroup analyses were pre-specified.
RESULTS
Figure 1 summarizes study selection (Figure 1). The searches identified 375 records; after removing 77 duplicates, 298 records were screened by title and abstract, of which 107 were excluded. Of 191 reports sought, 164 lacked open-access full text, 27 were assessed for eligibility, and 19 studies were included.
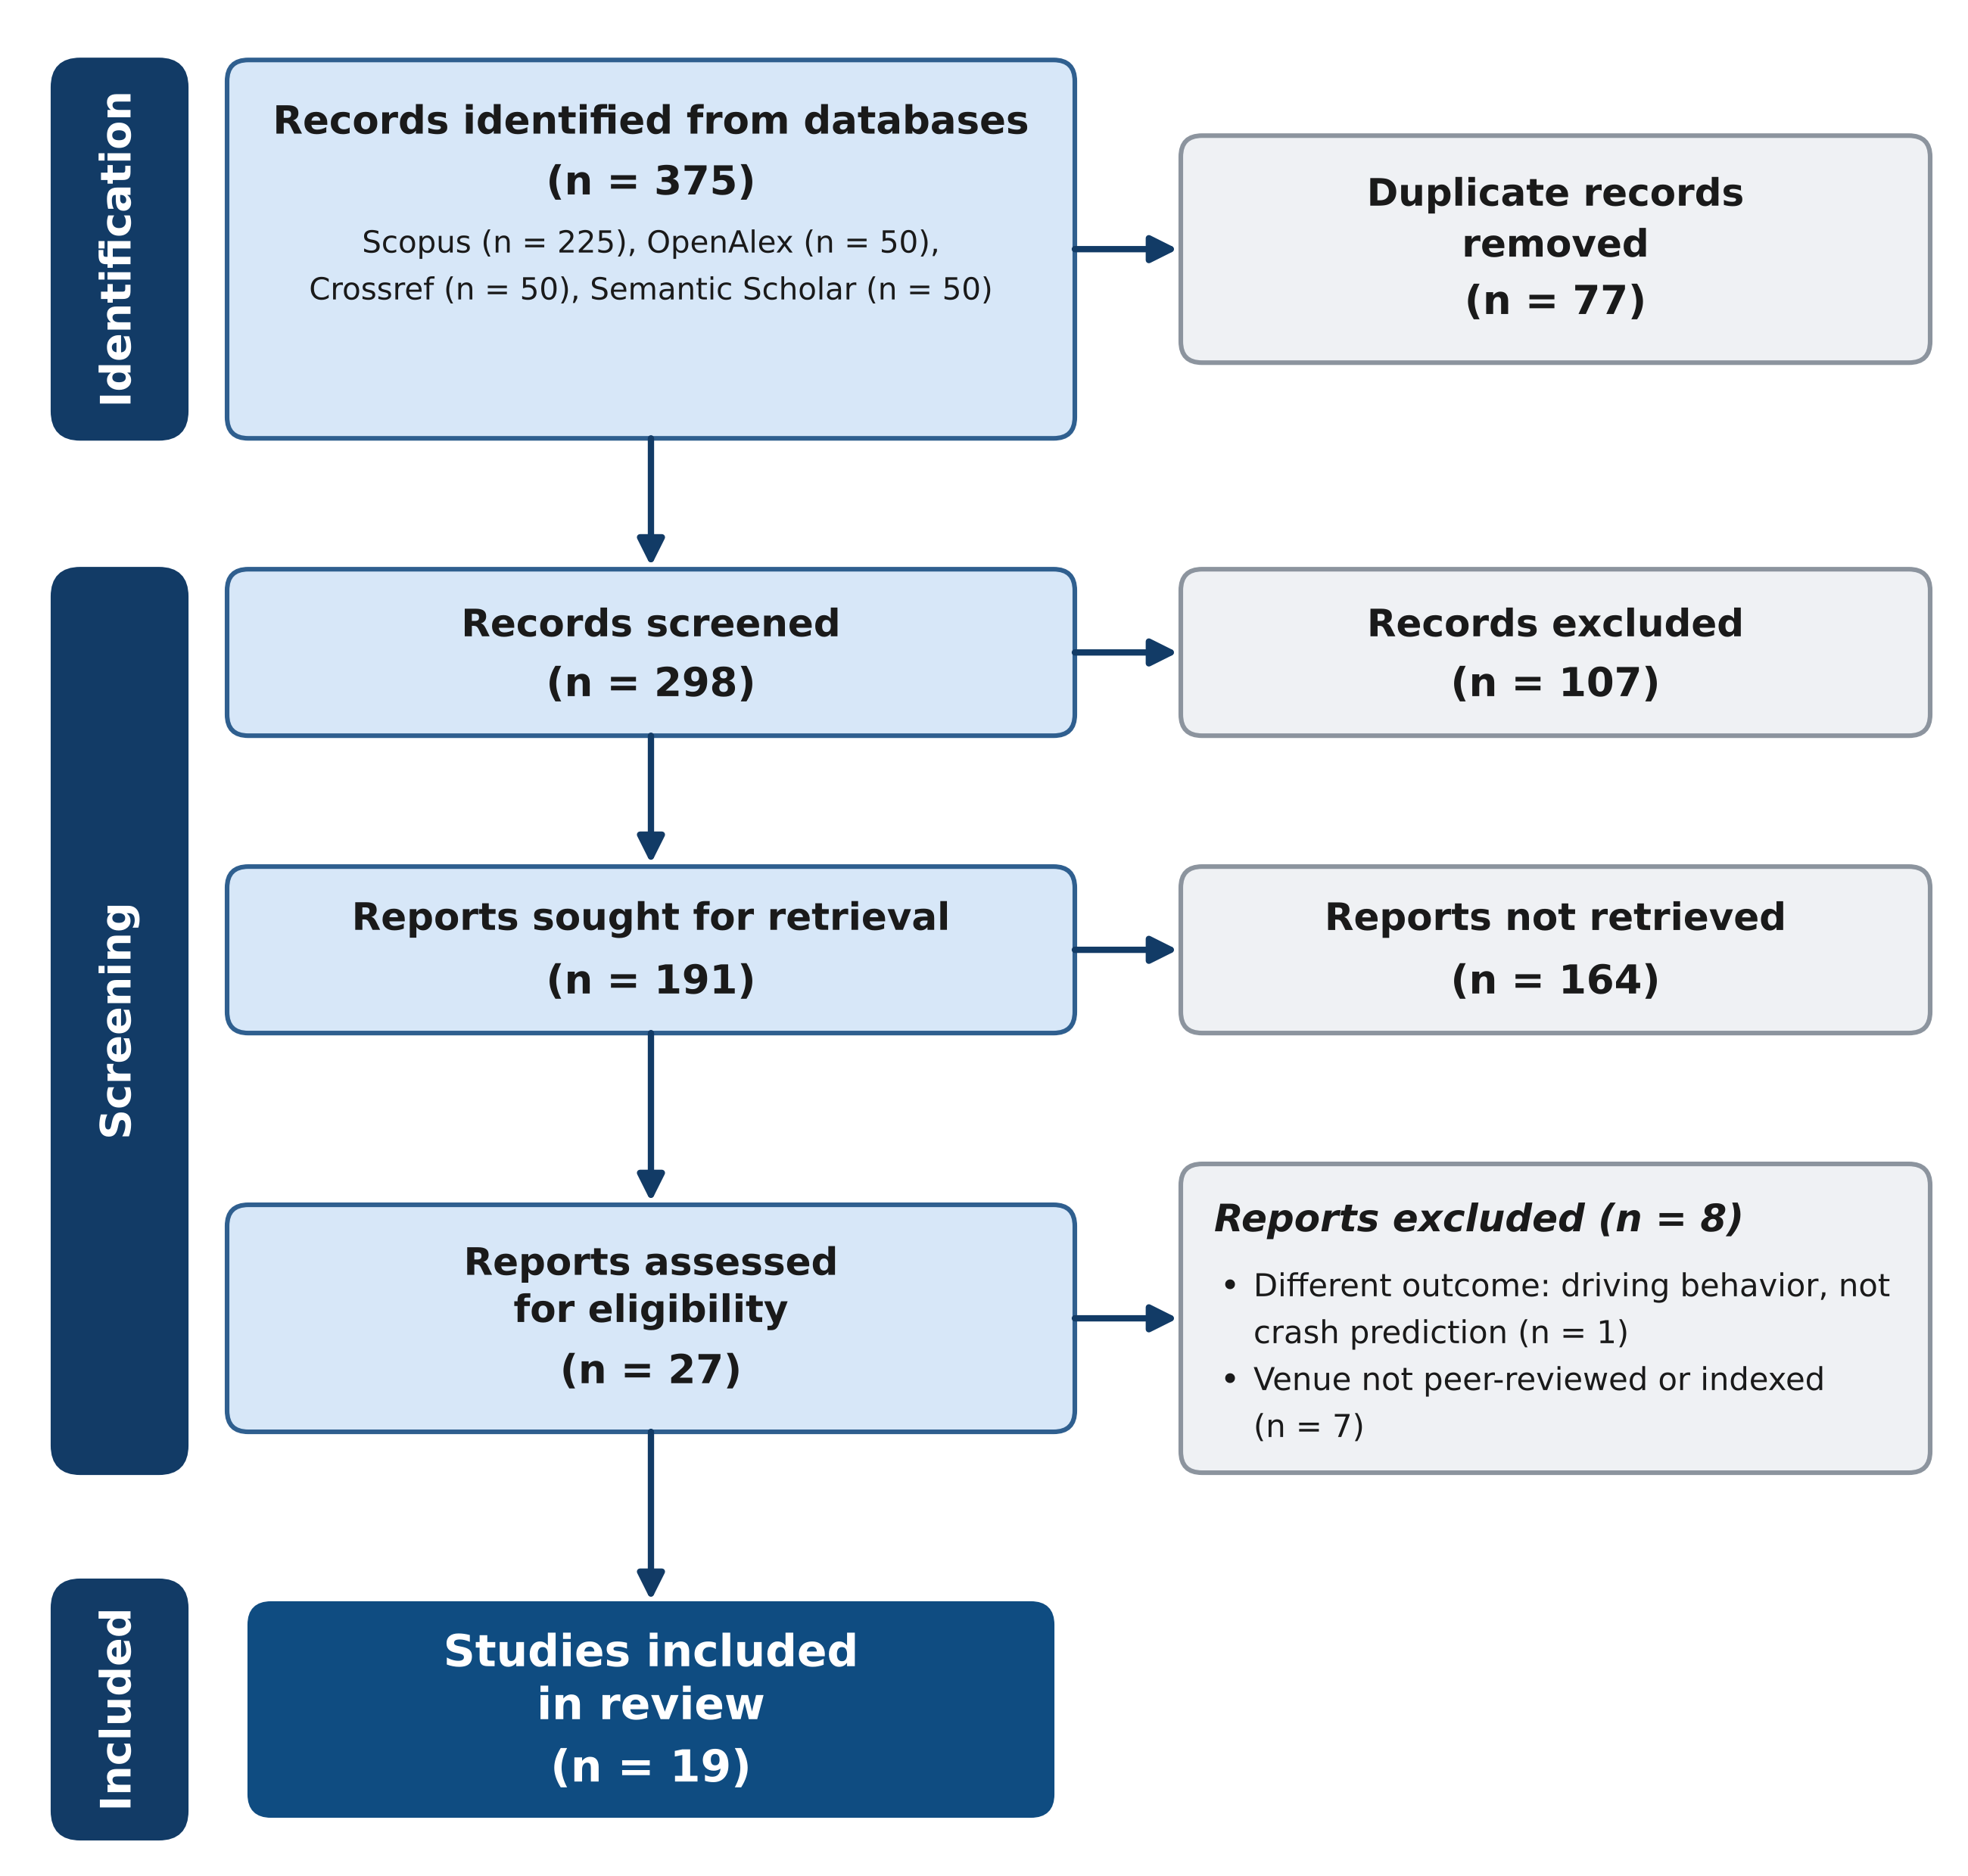
Figure 1. PRISMA 2020 flow diagram of study selection.
Study | Country | Target | Sample | Models | Best performer |
|---|---|---|---|---|---|
Gider et al. (2026) | Turkey | severity (fatal vs non-fatal) | 5,676 crashes, Batman province, 2013-2022 | XGBoost, TabNet, FT-Transformer | FT-Transformer |
Mamun et al. (2026) | United States | severity (high vs low) | Large-vehicle work-zone crashes, South Carolina, 2014-2018 | CatBoost, LightGBM, XGBoost, NeuralNetTorch and statistical models | LightGBM with DMI features and NearMiss-1 |
Al-Nabulsi et al. (2026) | United States | frequency (crash count) | Urban arterial segments, Southeast Michigan | Poisson, negative binomial, GLMM, Random Forest, XGBoost | XGBoost |
Worachairungreung et al. (2026) | Thailand | severity (severe/fatal vs non-severe) | 274,635 crashes, Bangkok, 2020-2024 | Logistic regression, Random Forest, XGBoost | Random Forest |
Passarella et al. (2026) | United Kingdom | severity | UK Road Safety Data | Random Forest, XGBoost, logistic regression, decision tree, naive Bayes, SVM, KNN | Random Forest |
Le et al. (2026) | United Kingdom | severity (killed/seriously injured vs slight) | Nationwide UK crash data, 2020-2024 | LightGBM | LightGBM |
Majidia et al. (2026) | United States | severity (serious vs minor injury) | Kentucky crash dataset (high-risk road types) | Random Forest, XGBoost | Random Forest (rural); XGBoost (undivided) |
Yousaf et al. (2026) | Pakistan | occurrence (self-reported crash involvement) | 623 drivers (internet survey) | Logistic regression, CatBoost, XGBoost | CatBoost/XGBoost |
Jevremovic et al. (2026) | Serbia | frequency (accident count) | IB-category rural roads, Serbia | Interpretable machine learning | ML model (R2 = 0.79) |
Li et al. (2026) | China | occurrence (injury occurrence) | 9,743 crashes, Changsha, 2017-2019 | Random Forest, XGBoost, CatBoost | CatBoost |
Al Hasanat et al. (2025) | Jordan | severity (major/fatal vs minor) | 10-year pedestrian crashes, Amman, 2014-2023 | XGBoost with balancing loss, random data partition voting | RDPVR |
Wahab & Jiang (2019) | Ghana | severity (four categories) | Motorcycle crashes, 2011-2015 (BRRI database) | J48 decision tree, Random Forest, IBk | Random Forest |
Chakraborty et al. (2023) | United States | severity (three classes) | Interstate crashes, Texas, 2014-2019 | Decision tree, Random Forest, XGBoost, DNN | Tree ensemble/DNN (varying by class) |
Saxena et al. (2023) | United States | occurrence (injury and fatality) | NYC vehicle crash data (zip-code level) | Support vector machine (AutoML) | SVM |
Almoshaogeh et al. (2026) | Saudi Arabia | severity | Crash data, Al-Qassim region | XGBoost, Random Forest, logistic regression | XGBoost |
Mostafa et al. (2025) | Not reported | severity | 2.26 million merged crash, people and vehicle records | Extra Trees, clustering and oversampling with CFS/RFE | Extra Trees |
Ji et al. (2020) | United States | severity | Two-vehicle crashes | Bagging, boosting, stacking ensembles | Stacking with linear blender |
Xiao & Duan (2025) | China | severity (fatality, severe injury, property damage) | Four-year (2018-2021) multi-source crash data | Multi-task deep neural network (Adv MT-DNN) | Adv MT-DNN |
Sorum et al. (2025) | India | severity (driver injury severity) | 793 speeding crashes, Imphal, 2011-2020 | 11 supervised models incl. GBT, SGD, decision tree, lasso-LARS, LightGBM | Gradient boosting tree |
Note: DNN = deep neural network; SVM = support vector machine; KSI = killed or seriously injured.
All 19 studies were observational, and none used an experimental or quasi-experimental design. Sample sizes ranged from 623 self-reported drivers in Pakistan( 11) to 2.26 million merged crash records.( 12) Publication years were concentrated at the end of the window, with 11 studies in 2026, 4 in 2025, and only 2 before 2023.
Study | Primary metric | Reported value | Validation |
|---|---|---|---|
Gider et al. (2026) | ROC-AUC / PR-AUC | FT-Transformer strongest under 0.8% fatal rate | Temporal hold-out + external corpus |
Mamun et al. (2026) | High-severity recall | LightGBM with DMI features and NearMiss-1 best | Internal split |
Al-Nabulsi et al. (2026) | R2 / RMSE | R2 = 0.835; RMSE = 28.65 | 5-fold cross-validation |
Worachairungreung et al. (2026) | ROC-AUC / PR-AUC | 0.756 / 0.733 (Random Forest) | Stratified split |
Passarella et al. (2026) | Accuracy | 99.3% (Random Forest) | Unseen split |
Le et al. (2026) | Recall (KSI) | 0.605 at threshold 0.35 (LightGBM) | Calibrated split |
Majidia et al. (2026) | Accuracy | Random Forest and XGBoost vary by road class | Train/test |
Yousaf et al. (2026) | Not fully reported | Aggressive and risky driving associated with crashes | Survey, internal |
Jevremovic et al. (2026) | R2 | 0.79 | Internal |
Li et al. (2026) | Accuracy / AUC | CatBoost best with combined features | Train/test |
Al Hasanat et al. (2025) | True positive rate | 0.63 for major/fatal (RDPVR) | Cost-sensitive split |
Wahab & Jiang (2019) | Accuracy | Random Forest best | Internal split |
Chakraborty et al. (2023) | Accuracy | Varies by severity class | Train/test |
Saxena et al. (2023) | Not fully reported | Described as efficient and accurate | Internal |
Almoshaogeh et al. (2026) | AUC / F1 | XGBoost best | Train/test |
Mostafa et al. (2025) | Accuracy / F1 | 96.19% / 95.28% (Extra Trees) | Train/test |
Ji et al. (2020) | Accuracy | Stacking ensemble best | Train/test |
Xiao & Duan (2025) | Multi-task accuracy | Adv MT-DNN best | Train/test |
Sorum et al. (2025) | Recall / accuracy / AUC | Gradient boosting tree best | 5- and 10-fold cross-validation |
Note: AUC = area under the receiver operating characteristic curve; KSI = killed or seriously injured.
For crash occurrence and frequency, machine learning explained 79% of the variance in accident counts on Serbian rural roads( 17) and 83.5% on Michigan urban arterials.( 18) Injury occurrence models identified built-environment and crash-context factors in China.( 19) The remaining occurrence study used a support vector machine for New York City crashes without full metric reporting.( 20)
Study | Interpretability method | External validation |
|---|---|---|
Gider et al. (2026) | SHAP | Yes (temporal hold-out and independent corpus) |
Mamun et al. (2026) | feature importance | No |
Al-Nabulsi et al. (2026) | SHAP | No |
Worachairungreung et al. (2026) | SHAP | No |
Passarella et al. (2026) | None | No |
Le et al. (2026) | SHAP | No |
Majidia et al. (2026) | SHAP | No |
Yousaf et al. (2026) | SHAP | No |
Jevremovic et al. (2026) | SHAP | No |
Li et al. (2026) | SHAP | No |
Al Hasanat et al. (2025) | SHAP, LIME, permutation importance | No |
Wahab & Jiang (2019) | None | No |
Chakraborty et al. (2023) | None | No |
Saxena et al. (2023) | None | No |
Almoshaogeh et al. (2026) | SHAP | No |
Mostafa et al. (2025) | SHAP | No |
Ji et al. (2020) | None | No |
Xiao & Duan (2025) | SHAP, LIME | No |
Sorum et al. (2025) | SHAP | No |
Note: SHAP = SHapley Additive exPlanations; LIME = Local Interpretable Model-agnostic Explanations.
External validation was reported in only one study, which tested its fatal-crash model on an independent public crash corpus and a temporal hold-out.( 26) The other 18 studies relied on internal cross-validation or a single train-test split.
Study | Main methodological concern | Overall risk of bias |
|---|---|---|
Gider et al. (2026) | None major | Low |
Mamun et al. (2026) | Severe-class imbalance | Low |
Al-Nabulsi et al. (2026) | No external validation | Low |
Worachairungreung et al. (2026) | No external validation | Low |
Passarella et al. (2026) | Implausible accuracy; leakage risk | High |
Le et al. (2026) | None major | Low |
Majidia et al. (2026) | Limited reporting | Moderate |
Yousaf et al. (2026) | Self-report recall bias | High |
Jevremovic et al. (2026) | No external validation | Low |
Li et al. (2026) | No external validation | Low |
Al Hasanat et al. (2025) | None major | Low |
Wahab & Jiang (2019) | No interpretability | Moderate |
Chakraborty et al. (2023) | No interpretability | Moderate |
Saxena et al. (2023) | Vague metrics | High |
Almoshaogeh et al. (2026) | No external validation | Low |
Mostafa et al. (2025) | Accuracy-driven under imbalance | Moderate |
Ji et al. (2020) | No interpretability | Moderate |
Xiao & Duan (2025) | None major | Low |
Sorum et al. (2025) | Small sample | Low |
Note: PROBAST = Prediction model Risk Of Bias ASsessment Tool.
Model family | Studies (n) | Representative models |
|---|---|---|
Tree ensembles | 16 | Random Forest, XGBoost, LightGBM, CatBoost, Extra Trees, decision trees |
Deep networks and transformers | 4 | DNN, multi-task DNN, TabNet, FT-Transformer, NeuralNetTorch |
Support vector machine | 2 | SVM alone or within a wider model comparison |
Statistical comparators | 6 | Logistic regression, Poisson and negative binomial, GLMM |
Note: DNN = deep neural network; SVM = support vector machine; GLMM = generalized linear mixed model; FT = feature tokenizer.
Data source | Studies (n) |
|---|---|
Police-reported crash records | 13 |
Road inventory and traffic exposure | 2 |
Self-report survey | 1 |
Open city crash dataset | 1 |
Multi-source fused records | 2 |
DISCUSSION
This review set out to establish how well machine learning models predict traffic crash occurrence and severity and how often those models are interpretable or externally validated. Taken together, the evidence from the 19 included studies shows that machine learning attains high nominal accuracy on crash data, that interpretability has become the norm through SHAP, and that external validation remains the exception rather than the rule. Each of these patterns has consequences for how the evidence should be read and for how future studies should be reported.
The predominance of severity prediction over occurrence and frequency prediction reflects a field organized around classification rather than prospective risk estimation. Fourteen of the 19 studies modeled severity, and five modeled occurrence or frequency, a split that is consistent with the distribution reported in earlier reviews of the same literature.( 5,6)
The imbalance is notable because the operational question that agencies most often face is where the next crash will happen, which occurrence and frequency models answer more directly than severity models do.
The high but variable accuracy observed for severity models is consistent with earlier syntheses, which found that tree ensembles and boosting generally outperformed classical statistical models while remaining sensitive to class imbalance and to the choice of metric.( 5,6)
The near-perfect accuracy of 99.3% reported in one United Kingdom study( 13) is implausible as a real-world estimate of severity discrimination and more likely reflects leakage or an imbalanced evaluation, an interpretation supported by the much lower severe-class recall reported elsewhere.( 14,15)
Studies that used precision-recall or cost-sensitive metrics consistently showed that the minority severe class, not overall accuracy, is where these models fail.( 23,26)
The meaning of accuracy under imbalance deserves emphasis, because a model trained on data in which only 0.8% of crashes are fatal can report very high accuracy by predicting the majority class everywhere. The Turkish comparison showed this directly by evaluating recall at a fixed decision threshold and by reporting precision-recall rather than accuracy alone.( 26)
Studies that ignored this point, by contrast, produced headline accuracies near 99% that say little about the severe crashes that matter most for safety policy.( 12,13)
For crash occurrence and frequency, the explained variance of 0.79 and 0.835 on Serbian and Michigan roads( 17,18) falls within the range reported by safety performance function research, although direct comparison is limited by different exposure measures and aggregation scales.( 27)
Conflict-based and telematics approaches reviewed elsewhere extend prediction to surrogate events and near-crash data, which the included occurrence studies rarely used.( 28-30) In turn, the inclusion of traffic exposure and geometry, rather than richer behavioral data, appears to be what distinguishes the better occurrence models in this sample.
The dominance of SHAP in 13 of 19 studies mirrors the broader shift toward post hoc explanation in transport machine learning.( 31,32)
Interpretability was usually descriptive rather than causal, however, since only one study paired machine learning with a causal framework.( 24)
This distinction matters because feature attribution computed from correlated crash predictors can mislead practitioners about which countermeasure would actually reduce risk, a limitation that several authors acknowledge but few designs overcome.( 33,34)
The granularity of interpretability also varied. A minority of studies reported only a global ranking of feature importance, while the rest produced per-instance explanations or interaction analyses, as in the multi-task framework of Xiao and Duan.( 22)
Local explanations are closer to what an agency needs when it wants to understand a specific high-risk corridor, but they were the minority, and no study demonstrated that its explanations changed a subsequent safety decision in practice.
Interpretability was unevenly distributed across the risk-of-bias categories. The studies rated low for risk of bias were also the ones that tended to report SHAP or LIME, whereas the studies rated high often reported neither interpretation nor external validation.( 13,20)
This coupling suggests that interpretability is not yet an independent standard of the field but rather a marker of the more careful studies, and that its absence should be read alongside other quality signals.
The finding that only one study performed external validation( 26) is the clearest signal that the literature has not yet produced models ready for deployment. Reviews of transferability and the few studies that examined spatial or temporal transfer report the same pattern, namely that models degrade when moved to new jurisdictions or periods and require local recalibration.( 28,29)
Without shared benchmarks or public validation corpora, the accuracies reported across studies cannot be compared with one another, and any claim of superiority of one algorithm over another rests on internal evidence alone.
Calibration was reported even less often than external validation. Only the United Kingdom KSI study evaluated probabilistic reliability explicitly with the Brier score and recalibrated its decision threshold,( 14) and the Bangkok study compared calibration across model classes.( 16)
The remaining studies reported discrimination alone, which means the probabilities they produce cannot be interpreted as risks without an additional calibration step that most papers did not perform.
The PROBAST appraisal found low overall risk of bias in 11 studies, but the high-risk studies illustrate recurring problems. Accuracy was used as the headline metric despite severe class imbalance, feature selection sometimes preceded the split in ways that risked leakage, and survey-based designs introduced recall bias.( 11)
These methodological choices, rather than the choice of algorithm, appear to drive the inflated performance reported in a minority of studies, and they are exactly the defects that PROBAST is designed to detect.( 9)
The choice of algorithm was, by contrast, markedly homogeneous. Tree ensembles appeared in 16 of 19 studies, and only a handful tested deep networks or transformers, which is consistent with the observation that tabular crash data rarely favor deep architectures over gradient boosting.( 5,6)
The concentration on a small set of well-understood models is a strength insofar as it makes studies comparable, and a limitation insofar as it leaves novel architectures under-evaluated on crash-specific benchmarks.
Heterogeneity across studies was substantial and partly explainable. Prediction targets ranged from fatal crashes in a single Turkish province( 26) to injury severity on nationwide datasets,( 14) and data sources ranged from police records to self-report surveys.( 11)
The geographic concentration in middle- and high-income settings, with only one African study,( 10) limits transferability to the low-income contexts that bear the heaviest crash burden.( 1) Motorcycle and powered two-wheeler safety, which dominates injury in several of the studied settings, was addressed explicitly in only a few studies.( 10,35,36)
A further source of heterogeneity is the inconsistent treatment of class imbalance. A subset of the included studies applied resampling or cost-sensitive learning and reported severe-class metrics, while the remainder optimized overall accuracy and therefore favored the majority class.( 15,23)
This difference alone can reverse the apparent ranking of models, which is why the comparison of a metric across studies is more informative than the comparison of a single headline value.( 26)
Sample size adds another axis of heterogeneity that interacts with the imbalance problem. Studies with a few hundred records, such as the 623-driver survey in Pakistan( 11) or the 793-crash Indian analysis,( 37) cannot support the same model complexity as the 2.26-million-record severity model.( 12)
Small samples combined with severe imbalance are the configuration in which overfitting and optimistic internal estimates are most likely, and they are precisely the studies for which external validation would be most informative.
The reliance on police-reported records introduces a shared limitation that few studies acknowledged. Underreporting, incomplete injury coding, and inconsistent severity definitions across jurisdictions are well documented,( 27) and they cap the performance that any model can honestly achieve. S
urveys and fused multi-source records address part of this problem but introduce their own biases, as the self-report design in Pakistan illustrates.( 11)
The protective equipment analysis for child occupants( 38) is a reminder that the crash data collected at the scene are not always the data that decide the outcome.
Its strengths are the reproducible multi-database search, the explicit two-stage screening log with coded reasons, and the use of PROBAST rather than an ad hoc quality checklist. Its main limitation is that full text was restricted to open-access publications, which excluded 164 otherwise eligible reports and may skew the sample toward newer and better-funded research.
Two further limitations concern scope. The restriction to English excluded studies published in other languages, several of which appeared in the retrieved records and would have broadened the geographic coverage. The absence of a meta-analysis, dictated by heterogeneous metrics and targets, means that no pooled estimate of performance can be stated, and the synthesis remains qualitative.
Where studies included a statistical comparator, the machine learning models usually won, but the margin was smaller than the accuracy-only literature suggests. On Michigan arterials, XGBoost explained more variance than the generalized linear mixed model, yet the mixed model retained the interpretable safety performance function that agencies already use.(18) In Bangkok, logistic regression was better calibrated than the tree models even though it discriminated less well.( 16)
These results suggest that the choice between statistical and machine learning models is a trade-off between discrimination and interpretability rather than a simple victory for either side.
Severity was defined inconsistently across studies, which further complicates comparison. The included studies distinguished fatal from non-fatal crashes in different ways, some collapsing killed and seriously injured into a single class, and still others used three or four ordered categories.( 10,14,26)
Because the rare class differs across these definitions, the same model and metric can mean different things in different studies, and a recall value reported against one definition cannot be read against another.
The predictor sets also varied widely, from geometric and exposure variables to built-environment, behavioral, and multi-source features.( 11,19,22)
Wider feature sets tended to improve discrimination in the studies that compared them, as the Chinese combined-feature analysis showed.( 19)
Even so, feature selection applied before the data split, a practice visible in several of the included reports, is a recognized source of leakage that inflates performance and that PROBAST treats as a high concern.( 9)
SHAP itself has limits that the reviewed studies seldom discussed. Its values are conditional on the model and on the correlation structure of the predictors, so a high SHAP value for one variable does not establish that intervening on that variable will reduce crashes.( 31)
The single study that paired machine learning with Granger causality( 24) illustrates the alternative, in which explanation is attached to a causal question rather than to feature attribution alone.
The near absence of external validation is partly structural. Crash datasets are jurisdiction-specific, variable definitions differ, and there is no widely shared public corpus against which a new model can be tested, unlike the benchmarks that exist in other machine learning fields.
The one study that did perform external validation did so by assembling a public rare-event crash corpus and a temporal hold-out from its own data,( 26) a pattern that is feasible to replicate and that other studies could adopt without great cost.
Temporal generalization was examined even less often than spatial generalization. Only the Turkish study trained on one period and tested on a later one,( 26) and none of the included studies tested whether a model trained before a major policy or infrastructure change remained valid after it.
This is a consequential gap, because crash risk is not stationary, and models deployed for network screening will be applied precisely in periods when the underlying conditions may have shifted.( 27)
For network screening and black-spot identification, the practical value of these models depends less on raw accuracy than on the ordering they produce. A model that ranks segments by predicted risk can be useful even if its probabilities are poorly calibrated, provided the ranking is stable and reproducible.( 39)
The included studies rarely reported ranking quality, such as lift at a fixed decision threshold, which is the metric that a screening agency would actually consume.( 26)
Reporting was also inconsistent in ways that a checklist would fix. A number of reports did not state the sample size, the severity definition, or the full set of hyperparameters, and at least one reported no quantitative metric at all.( 20)
Prediction model reporting standards, of the kind formalized for clinical models, would make the literature more comparable and would have removed much of the guesswork that this synthesis required.
The geographic distribution of the evidence is inverted relative to the burden. The largest volume of studies came from high-income and upper-middle-income settings, while the regions with the fastest-growing crash mortality contributed almost no models.( 1,10)
Transferring a model trained in Bangkok or Michigan to a low-income setting is unlikely to work without substantial recalibration, given differences in vehicle mix, road standards, and data quality.( 2)
Certainty in these findings is moderate at best. The included studies are observational, performance is reported on internal splits in most cases, and the strongest findings rest on a small number of studies with low risk of bias. Readers should treat the quantitative values reported here as descriptive of a literature, not as estimates of the true performance of any model class, and future updates should revisit the conclusions once external validation becomes routine.
Deep learning occupied a narrow and specific role in this sample. Where it appeared, it was either a transformer tested against gradient boosting on tabular fatal-crash data( 26) or a multi-task network designed to predict several severity outcomes jointly.( 22)
The multi-task design is notable because it models the correlations among outcomes, yet neither deep approach established a consistent advantage, which is consistent with the broader evidence that deep learning rarely dominates tabular modeling problems.( 5)
The methods used to handle imbalance were themselves heterogeneous, ranging from SMOTE and NearMiss undersampling to cost-sensitive loss functions and threshold optimization.( 15,23,26)
No single approach was clearly superior, and the choice interacted with the metric, so that a method that raised recall often lowered precision. This interaction, more than the algorithm, explains why the reported numbers scatter so widely.
The research agenda that follows from these findings has three parts. First, publish benchmark corpora with leakage-controlled splits and predefined severe-class metrics. Second, make external validation a reporting requirement, at least on a held-out period or jurisdiction. Third, connect interpretability to a causal or decision question rather than reporting feature rankings alone. A literature that meets these three conditions would answer the question posed here with far greater certainty.
A second gap concerns discrimination metrics. Most studies reported accuracy, which is threshold-dependent, and only a minority reported the area under the curve or precision-recall curves, which summarize ranking independent of any threshold.( 16,26)
The reliance on accuracy makes it impossible to compare models across studies with different severity distributions, and it explains part of the apparent contradiction between the very high accuracies and the modest severe-class recall reported in the same papers. A road-class comparison on Kentucky high-risk roads( 40) illustrates how the preferred algorithm can change with the target definition, which is another reason to distrust any single headline value.
Severe class imbalance was the norm rather than the exception. Fatal crashes represented 0.8% of records in the Turkish data,( 26) and major or fatal pedestrian injuries represented a minority of the Jordanian data, so that standard classifiers detected fewer than a quarter of severe cases before correction.( 15)
This prevalence means that any study reporting only overall accuracy is, in effect, reporting the performance on the majority class and hiding the performance on the class that matters most for safety.
Internal validation itself varied in rigor. Validation designs ranged from a single random split to fivefold or tenfold cross-validation, and a few repeated the split with different training proportions.( 18,37)
Cross-validation reduces the variance of the estimate but does not correct leakage or selection bias, so even a well-cross-validated figure remains an internal estimate until it is confirmed on data that played no role in development.
The restriction to open-access full texts almost certainly shapes the sample. Paywalled transportation journals are a major venue for this literature, and their exclusion may have removed some of the most mature applied work, although it also favored studies whose methods could be inspected directly. The direction of this bias is unknown, but it should be kept in mind when the proportions reported here are generalized to the field as a whole.
Compared with earlier reviews, the picture has shifted in one respect and not in another. Interpretability, which earlier syntheses described as an aspiration,( 6) is now reported in the majority of studies, while external validation, which those same reviews called for, has barely moved.( 5)
This asymmetry suggests that the field has adopted the visible signal of rigor more readily than the costly part.
The occurrence and frequency models deserve a note of interpretation. An explained variance of 0.79 on Serbian rural roads( 17) means that a substantial share of the spatial variation in accident counts remains unexplained, so the model is useful for prioritization but not for precise prediction at any single site. The same caveat applies to the Michigan arterial model,( 18) whose residual error of about 29 crashes per segment is large relative to the mean count at many locations.
Taken together, the evidence answers the review question with a qualified yes. Machine learning predicts crashes well enough to be useful, better than classical models on discrimination, and with growing interpretability, but its performance is inflated by imbalance-insensitive metrics and its generality is almost entirely untested.
Within the tree ensemble family, no single algorithm was consistently dominant. Random Forest won in Bangkok and Kentucky, XGBoost won in Saudi Arabia and Michigan, LightGBM won in the United Kingdom and in the work-zone study, and CatBoost won in the Chinese built-environment analysis.( 14,16,18,19,21,23,40)
The fact that the winner changes with the dataset reinforces the conclusion that data and evaluation choices, more than the choice of boosting library, determine reported performance.
Data quality also set an upper bound on performance that varied by source. Police records are complete for reported crashes but undercount minor and property-damage events, while the self-report survey captured behaviors that police records never record at the cost of recall bias.( 11,27)
Multi-source fusion, as in the large merged severity model and the Chinese multi-task study, is the most promising route to richer inputs, but it demands careful record linkage that the papers only partially described.( 12,22)
The rapid turnover of this literature, with 11 of the 19 studies published in 2026 alone, means that the conclusions should be read as a moving picture rather than a fixed one. If external validation and calibrated reporting become standard, the next iteration of this review could legitimately report pooled performance and might reach different conclusions about which model families should be preferred.
Finally, the review itself concentrated on the published record, which is subject to publication bias. Models that performed poorly may be less likely to appear in the literature than those that reached high accuracy, so the distribution of performance reported here is plausibly optimistic. This bias is impossible to quantify without registered protocols and would be reduced if prediction studies were registered before analysis, in the way that some clinical prediction studies now are.
Two questions that this review could not answer are worth stating plainly. The first is whether machine learning reduces crashes, rather than merely predicting them, because none of the included studies linked a model to an implemented countermeasure and measured the outcome. The second is which models are cost-effective for an agency with limited data staff, because the included studies were research prototypes rather than deployed tools. Both questions move from prediction to decision, and they mark the boundary of what the current evidence can support.
The clearest actionable conclusion is that reporting, not modeling, is the weakest link. A modest study with leakage control, a calibrated severe-class metric, and one external check contributes more to practice than a larger study that reports only accuracy on an internal split. This is the standard against which future crash prediction work should be judged.
For practice, agencies should prefer models that report calibrated probabilities and severe-class recall over headline accuracy, and should demand external validation before deployment. Severity screening tools of the kind proposed for hierarchical injury classification( 39) and Bayesian-optimized severity models( 33,34) illustrate how interpretable output can support prioritization, but they have yet to be tested outside their development settings.
For research, the field would benefit from public benchmark corpora, standardized reporting of class imbalance and leakage control, and interpretability that is tied to a causal question. A shared crash benchmark with leakage-controlled splits and severe-class metrics would make studies comparable in a way that the current literature does not allow. Only then can the predictive promise of machine learning be converted into measurable reductions in road traffic injury.( 41,42)
CONCLUSIONS
Machine learning models predict traffic crash occurrence and severity with high but variable performance, and their advantage over statistical models is clearest for severity classification. Interpretability is now reported in most studies, chiefly through SHAP, but external validation remains rare, with only one study testing its model outside the training setting. Future work should pair strong discrimination with calibrated severe-class metrics and with validation on independent data before models inform road safety decisions.
Reporting standards and shared benchmarks would make those comparisons possible across studies and jurisdictions, and they are the changes most likely to convert a large body of demonstration studies into tools that road safety agencies can actually rely on.
References
- 1 Wang K, Li Z. Global, regional, and national burdens of road injuries from 1990 to 2021: Findings from the 2021 Global Burden of Disease Study. Injury. 2025;56(3):112221. doi: 10.1016/j.injury.2025.112221
- 2 Gu D, Ou S, Liu G. Global burden of road injuries and their attributable risk factors from 1990 to 2021: A systematic analysis for the global burden of disease study 2021. Preventive Medicine Reports. 2025;53:103051. doi: 10.1016/j.pmedr.2025.103051
- 3 Breiman L. Random Forests. Machine Learning. 2001;45(1):5-32. doi: 10.1023/a:1010933404324
- 4 Azami MFAM, Misro MY. Road crash analysis: A systematic review of machine learning approaches and statistical techniques. AIP Conference Proceedings. 2026;3462(1):180001. doi: 10.1063/5.0313359
- 5 Awad M, Moussa GS, Wahaballa AM, Younes H. A state-of-the-art review of injury severity analysis in traffic crashes: toward a generalized modeling framework. Innov Infrastruct Solut. 2026;11(1):19. doi: 10.1007/s41062-025-02409-9
- 6 Verma R, Agarwal MM. A Systematic Review on Road Accident Prediction: A Special Attention Toward Machine Learning and Deep Learning Approaches. J CIRCUIT SYST COMP. 2026;35(02):2530009. doi: 10.1142/s0218126625300090
- 7 Page MJ, McKenzie JE, Bossuyt PM, Boutron I, Hoffmann TC, Mulrow CD, et al. The PRISMA 2020 statement: an updated guideline for reporting systematic reviews. BMJ. 2021:n71. doi: 10.1136/bmj.n71
- 8 Rethlefsen ML, Kirtley S, Waffenschmidt S, Ayala AP, Moher D, Page MJ, et al. PRISMA-S: an extension to the PRISMA Statement for Reporting Literature Searches in Systematic Reviews. Syst Rev. 2021;10(1):39. doi: 10.1186/s13643-020-01542-z
- 9 Wolff RF, Moons KGM, Riley RD, Whiting PF, Westwood M, Collins GS, et al. PROBAST: A Tool to Assess the Risk of Bias and Applicability of Prediction Model Studies. Ann Intern Med. 2019;170(1):51-58. doi: 10.7326/m18-1376
- 10 Wahab L, Jiang H. A comparative study on machine learning based algorithms for prediction of motorcycle crash severity. PLoS ONE. 2019;14(4):e0214966. doi: 10.1371/journal.pone.0214966
- 11 Yousaf A, Wu J, Huang D, Zahid M, Habib MF, Pervez A, et al. Assessing and mitigating traffic crash risks using interpretable machine learning techniques. Sci Rep. 2026;16(1):26690. doi: 10.1038/s41598-026-52834-8
- 12 Mostafa AM, Aldughayfiq B, Tarek M, Alaerjan AS, Allahem H, Elbashir MK, et al. AI-based prediction of traffic crash severity for improving road safety and transportation efficiency. Sci Rep. 2025;15(1):27468. doi: 10.1038/s41598-025-10970-7
- 13 Passarella R, Isbatudinia I, Diana Marieska M, Kurniawan D, Fadillah Rahmat R, Veny H. Evaluation and Comparison of Classification Models for Predicting Crash Severity. Period Polytech Transp Eng. 2026;54(4):412-424. doi: 10.3311/pptr.41673
- 14 Le KG. Safety-oriented and explainable machine learning for KSI crash risk prediction: Evidence from the United Kingdom. PLoS One. 2026;21(4):e0347873. doi: 10.1371/journal.pone.0347873
- 15 Al Hasanat HA, Hassanat AB, Alharasees O, Tarawneh AS, Altarawneh GA, Alhasanat LA, et al. Interpretable machine learning for imbalanced pedestrian injury severity prediction in urban Jordan. J King Saud Univ – Eng Sci. 2025;37(7):39. doi: 10.1007/s44444-025-00053-3
- 16 Worachairungreung M, Kulpanich N, Sae-ngow P, Thanakunwutthirot K, Popaitoon S, Mongkolnarin S, et al. Machine Learning and Spatial Context for Urban Road Traffic Crash Severity Prediction. HighTech Innov J. 2026;7(3):976-988. doi: 10.28991/hij-2026-07-03-010
- 17 Jevremović S, Šelmić M. Prediction models for understanding traffic safety risk on rural roads in Serbia. ComputUrban Sci. 2026;6(1):20. doi: 10.1007/s43762-025-00215-8
- 18 Al-Nabulsi D, Alhawiti A, Novat NK, Kwigizile V, Oh JS. Integrating generalized linear mixed models and XGBoost for safety performance function development on urban arterials. Sci Rep. 2026;16(1):25170. doi: 10.1038/s41598-026-56168-3
- 19 Li W, Zhang X, Cao S. Effects of 5D built environment and non-built-environment factors on injury crash risk: An interpretable machine learning analysis. PLoS One. 2026;21(7):e0353205. doi: 10.1371/journal.pone.0353205
- 20 Saxena A, Robila SA. Automated machine learning for analysis and prediction of vehicle crashes. IJ-ICT. 2023;12(1):46. doi: 10.11591/ijict.v12i1.pp46-53
- 21 Almoshaogeh M, Alharbi F. Severity prediction of traffic accidents with recent machine learning paradigms and SHAP. Sci Rep. 2026. doi: 10.1038/s41598-026-73109-2
- 22 Xiao Y, Duan Z. An explainable multi-task deep learning framework for crash severity prediction using multi-source data. Sci Rep. 2025;15(1):21978. doi: 10.1038/s41598-025-09226-1
- 23 Mamun AA, Enan A, Aisiana Indah D, Mwakalonge J, Comert G, Chowdhury M. Crash Severity Risk Modeling Strategies under Data Imbalance. Transportation Research Record: Journal of the Transportation Research Board. 2026;2680(4):662-688. doi: 10.1177/03611981251376371
- 24 Chakraborty M, Gates TJ, Sinha S. Causal Analysis and Classification of Traffic Crash Injury Severity Using Machine Learning Algorithms. Data Sci Transp. 2023;5(2):12. doi: 10.1007/s42421-023-00076-9
- 25 Ji A, Levinson D. Injury Severity Prediction From Two-Vehicle Crash Mechanisms With Machine Learning and Ensemble Models. IEEE Open J Intell Transp Syst. 2020;1:217-226. doi: 10.1109/ojits.2020.3033523
- 26 Gider V, Ekinci S, Izci D, Gokalp I, Rashdan M, Salman M. Comparative evaluation of XGBoost, TabNet, and FT transformer models for fatal crash prediction under extreme class imbalance. Sci Rep. 2026;16(1):25809. doi: 10.1038/s41598-026-55751-y
- 27 Rao RK, Bharadwaj N. A systematic review of traffic safety data collection methods and challenges: From crash databases to AI-augmented sensors. Journal of Safety Research. 2026;97:612-627. doi: 10.1016/j.jsr.2026.05.005
- 28 Jackai II IN, Tezong Feudjio SL, Ndingwan TL, Dindze OD, Usami DS, Gonzalez-Hernandez B, et al. Conflict-Based Models for Real-Time Crash Risk Assessment: A State-of-the-Art Review. Future Transportation. 2026;6(3):107. doi: 10.3390/futuretransp6030107
- 29 Paradiso S, Ziakopoulos A, Yannis G. Learning-based methods for spatial road safety analysis using in-vehicle telematics data: A systematic review. Journal of Safety Research. 2026;97:737-761. doi: 10.1016/j.jsr.2026.05.014
- 30 Hasanpour M, Chen Z, D’Agostino C, Persaud B, Milligan C. Which approach better samples extreme traffic conflicts? Conventional- vs. machine learning-based sampling methods. Accident Analysis & Prevention. 2026;229:108423. doi: 10.1016/j.aap.2026.108423
- 31 Lundberg SM, Lee SI. A unified approach to interpreting model predictions [Internet]. 2017. Available from: https://arxiv.org/abs/1705.07874
- 32 Yaswanth R, Babu MR. An explainable driver risk classification framework using GWO-XGBoost and vehicular behavioural analytics. Sci Rep. 2026;16(1):32476. doi: 10.1038/s41598-026-68115-3
- 33 Abdullah M, Shokry S, Alqahtani T, Al-Ahmadi H. Shedding light on crash injury severity: a Bayesian-optimized machine learning investigation of visibility conditions. International Journal of Injury Control and Safety Promotion. 2026:1-25. doi: 10.1080/17457300.2026.2720848
- 34 Aziz K, Chen F, Khattak A. A Novel Bayesian Optimized-Combined Kernel & Tree Boost Approach for Road Traffic Crash Severity Analysis. Int J Civ Eng. 2025;23(7):1483-1501. doi: 10.1007/s40999-025-01108-x
- 35 Pervez A, Nguyen-Phuoc DQ, Lee JJ, Chang F, Munir H, Ahmad S. Electric two-wheeler crashes: Risk factors and potential solutions – A systematic review. KSCE Journal of Civil Engineering. 2026;30(1):100468. doi: 10.1016/j.kscej.2025.100468
- 36 Inmor T, Kanitpong K. Factors influencing motorcycle crash risk and accident prediction ability: The role of hazard perception training in Thailand. Accident Analysis & Prevention. 2026;238:108771. doi: 10.1016/j.aap.2026.108771
- 37 SORUM NG, SORUM MG. Prediction and Investigation of the Injury Severity of Drivers Involved in Speeding-Related Crashes Using Machine Learning Models. PROMTT. 2025;37(6):1612-1627. doi: 10.7307/ptt.v37i6.1016
- 38 Budzyński A. Evaluating the impact of protective equipment on child injury severity in road traffic crashes: an explainable machine learning and counterfactual analysis approach. International Journal of Injury Control and Safety Promotion. 2026;33(1):70-81. doi: 10.1080/17457300.2025.2578782
- 39 Awad M, Moussa GS, Wahaballa AM, Younes H. Complete hierarchical traffic injury severity analysis using machine learning and global sensitivity assessment. Innov Infrastruct Solut. 2026;11(10):535. doi: 10.1007/s41062-026-02916-3
- 40 Majidia MZ, Wangb T, Souleyrette R. Comparative Analysis of Crash Prediction Models on Kentucky's High-Risk Roads. International Conference on Civil, Structural and Transportation Engineering. 2026;9. doi: 10.11159/iccste26.204
- 41 Nambiza KS, Neven A, Peter RV, Kazaura WG, Brijs K. A systematic PRISMA review of traffic crashes, risk factors, determinants of risk behaviors, and interventions among motorcycle taxi riders. Transportation Research Part F: Traffic Psychology and Behaviour. 2026;116:103438. doi: 10.1016/j.trf.2025.103438
- 42 Nikolaou D, Harkin AM, Garefalakis T, Yannis G, Surges F. Road users’ safety attitudes towards speeding across 39 countries. Accident Analysis & Prevention. 2026;238:108772. doi: 10.1016/j.aap.2026.108772
Declarations
Funding
No financing
Conflict of interest
None
Authorship contributions
Drafting – original draft: Carlos Ignacio Ruiz Maldonado, Daniel Roman-Acosta.
Writing–review and editing: Carlos Ignacio Ruiz Maldonado, Daniel Roman-Acosta.