

Abstract
Public transport fares can consume a large share of household budgets and limit the mobility of low-income riders. Income-based fare discounts and fare capping have spread rapidly, but their effects on ridership and access have not been synthesized. The searches identified 431 records; after removing 92 duplicates, 339 were screened and 15 studies were included. Income-based discounts and capping were associated with higher ridership and travel frequency in most studies, with effects concentrated among low-income and frequent riders, while access and affordability outcomes improved in the studies that measured them. Discounted and capped fares appear to increase ridership and widen access for low-income riders, although the evidence is heterogeneous and mostly observational. Stronger quasi-experimental designs and longer follow-up are needed.
Keywords
public transport, fare policy, low-income population, social equity, transportation
INTRODUCTION
Public transport fares act as a direct price on mobility, and for households at the bottom of the income distribution that price can absorb a disproportionate share of the monthly budget. Qualitative work with low-income riders shows that the fare itself, rather than service quality, is frequently the binding constraint on how many trips a person can take, and riders describe forgoing medical visits, job interviews and social contact when the card runs out.( 1)
The distributional burden is measurable. Analyses that combine travel time, fare and income find that low-income workers face systematically lower job accessibility once the out-of-pocket cost of transit is counted, and that the combined cost of housing and transit can leave little residual income for other needs.( 2-4)
These patterns describe a form of transport poverty in which the monetary cost of travel, rather than the absence of service, is what excludes people from the labour market and from everyday activities, and they help explain why fare affordability has moved from a technical pricing question to a central theme of transport equity policy. Fare capping is a distinct instrument that sets a ceiling on the amount a rider pays over a day, week or month, so that frequent riders effectively convert into pass holders once their cumulative outlay reaches the cap. Means-tested discounts, by contrast, reduce the unit fare for riders who demonstrate income below an eligibility threshold.
Both instruments lower the marginal and the total cost of travel, but they do so for different groups and through different administrative machinery, which is why they are treated together but separately in this review.
The empirical base on these instruments remains fragmented. Two recent syntheses describe the equity methods and fare characteristics studied in the literature but stop short of summarizing effect estimates on behavior, and a scoping review of fare characteristics confirms that the field has spent more effort measuring the fairness of fares than measuring what lower fares do to travel.( 5,6)
Evidence on fare changes more broadly is mixed and suggests that responses may differ by income. Some analyses report that low-income riders are less responsive to fare increases than other groups, while others find the reverse, and fare increases in cities such as Beijing have been shown to redistribute travel and welfare away from lower-income riders.( 7,8)
The wider fare policy literature is dominated by studies of fare evasion, fare structures and the elasticity of aggregate demand, while the specific question of whether an income-based discount changes the travel of the people who receive it has attracted far less attention.
Because several of these programs originated as administrative initiatives rather than research projects, much of the early evidence circulates as agency reports and conference papers rather than as peer-reviewed articles. Fare capping is newer still, and much of the published material describes program design rather than measured ridership or access outcomes.( 9)
The spread of account-based and open-loop payment systems has made capping technically easier to implement than it was a decade ago, yet the behavioral evidence has not kept pace with the deployment. No review to date has assembled the quantitative and qualitative evidence on income-based discounts and capping specifically, which leaves agencies without a consolidated basis for choosing among instruments.
The objective of this review is to synthesize the empirical evidence on the effects of income-based discounted fares and fare capping on ridership, travel frequency and access to opportunities for low-income public transport riders. Three research questions guided the work.
The first asks what designs of income-based fare discounts and fare capping have been evaluated in the literature. The second asks what effects these policies have on ridership and travel frequency among low-income riders. The third asks what effects they have on access to opportunities and on the affordability of travel. By separating the description of the instruments from their behavioral and distributional consequences, the review is intended to give transit agencies and researchers a structured account of what has been tried and what those trials produced. The review deliberately excludes universal fare-free policies from the core synthesis, because their budgetary scale and their population coverage make them a different intervention, but they are retained as the benchmark against which the targeted instruments are judged.
METHODS
This systematic review followed the PRISMA 2020 statement and its search reporting extension, and the search strings were recorded verbatim with their dates and record counts so that the identification stage can be reproduced.(10)
Eligibility criteria
Studies were eligible if they empirically evaluated an income-based or means-tested fare discount, a reduced-fare program targeted at low-income riders, or a fare capping policy, and reported at least one outcome on ridership, travel frequency, access to opportunities, or the affordability of travel for low-income riders. This criterion corresponds to the second and third research questions. To answer the first research question, descriptive syntheses and evaluations of program design were retained when they documented the eligibility thresholds, discount levels and capping structures of implemented programs, even when they reported no behavioral estimate.
Eligible designs were randomized and quasi-experimental studies, observational and modelling studies, cross-sectional surveys, and mixed-methods evaluations; reviews, editorials and commentaries were excluded. Records published from 2013 to 2026 in English or Spanish were considered, matching the bibliographic window of the commission. Universal fare-free policies and flat fare reductions that were not tied to income were treated as a distinct intervention and were excluded from the core set, although they were retained for comparison in the discussion because they are the most frequent alternative to means-tested discounts.
No restriction was placed on geography, because the aim was to capture evaluations from both high-income systems and cities of the Global South where the subsidy context differs. Expressed as a PICO question, the population was low-income public transport riders, the intervention was an income-based discount or fare cap, the comparison was the regular fare or the pre-policy period, and the outcomes were ridership, travel frequency, access and affordability.
Information sources and search strategy
The Scopus strategy combined controlled field terms with a year filter. One core query read TITLE-ABS-KEY(("reduced fare" OR "discounted fare" OR "fare discount" OR "concessionary fare" OR "income-based fare" OR "means-tested fare") AND ("low-income" OR "low income" OR "equity" OR "affordability")) AND PUBYEAR > 2012 AND PUBYEAR < 2027, and returned 28 records. A second query captured fare capping with TITLE-ABS-KEY("fare capping" OR "fare cap" OR "capped fare") AND PUBYEAR > 2012 AND PUBYEAR < 2027, and returned 7 records.
A third query combined transit fare terms with affordability, equity, ridership and access, TITLE-ABS-KEY(("transit fare" OR "public transport fare" OR "transit pass") AND ("low-income" OR "affordability" OR "equity") AND ("ridership" OR "access" OR "travel")) AND PUBYEAR > 2012 AND PUBYEAR < 2027, and returned 49 records. Equivalent free-text queries were run in OpenAlex, Crossref and Semantic Scholar, which returned 100, 100 and 47 records respectively. Targeted queries for named programs, including Fair Fares, ORCA LIFT, Muni Lifeline and the Low Income Fare is Easy program, supplemented the core searches and returned a further set of candidate records.
Reference lists of the included studies and of the two recent reviews were also inspected, which added records that the database queries had missed.( 5,6)
Data extraction and risk of bias
For each included study one reviewer extracted the following items: study design, country, sample and population, the fare instrument and its eligibility or capping structure, the outcome construct, the principal result with its reported estimate, and the risk-of-bias judgment, and these fields were checked against the source text.( 10)
Risk of bias was assessed with ROBINS-I for the non-randomized studies, and the randomized trial was appraised against the same domains of confounding, selection, classification of interventions, deviations from intended interventions, missing data, measurement of outcomes and selective reporting.( 11)
Data items and effect measures
The extraction form captured the unit of analysis, the fare instrument, the eligibility threshold or cap level where reported, the outcome definition, and the reported estimate with its measure of uncertainty when available. For the behavioral question P2, the effect measures of interest were changes in trips, card taps or ridership, price elasticities, and reported trip frequency.
For P3, the constructs of interest were access to jobs and services, perceived accessibility, fare burden expressed as a share of income, and the distribution of subsidy benefits across income groups. Because the studies reported these constructs in different units, no common effect size could be computed, and the synthesis relied on the direction and magnitude of each estimate as reported by its authors.
Synthesis
Effect measures were not comparable across studies because designs, fare instruments and outcome definitions differed, so results were synthesized narratively and organized by research question rather than pooled in a meta-analysis. For the first question, program characteristics were tabulated and described. For the second question, the direction and magnitude of reported ridership effects were grouped by design strength, with causal designs given more interpretive weight than descriptive or modelling work. For the third question, reported access and affordability outcomes were grouped by construct. Heterogeneity was explored narratively by instrument type, population and time horizon, and no statistical pooling was undertaken because the studies did not report compatible effect sizes.
Where a study reported multiple outcomes, the primary behavioral outcome was used. Vote counting was avoided in favor of a structured narrative, because simple counts of positive and negative findings would obscure the large differences in design strength; instead, causal designs were reported first and descriptive and modelling results were treated as corroborating or contextual rather than as direct evidence of effect.
The narrative synthesis therefore reports the direction of effect for each study rather than a pooled estimate, and the risk-of-bias ratings are used to order the presentation so that the most informative designs lead each subsection. The certainty of the evidence was not formally graded, but the risk-of-bias ratings were used to qualify the conclusions drawn from each study.
RESULTS
Study selection
The searches identified 431 records, and after 92 duplicates were removed 339 records were screened by title and abstract. Of these, 303 were excluded at the title and abstract stage, 36 reports were sought for retrieval, and 21 could not be retrieved through open access because the publisher full text was behind a paywall without a legitimate open copy. The remaining 15 reports were assessed for eligibility and 15 studies were included in the review (Figure 1).
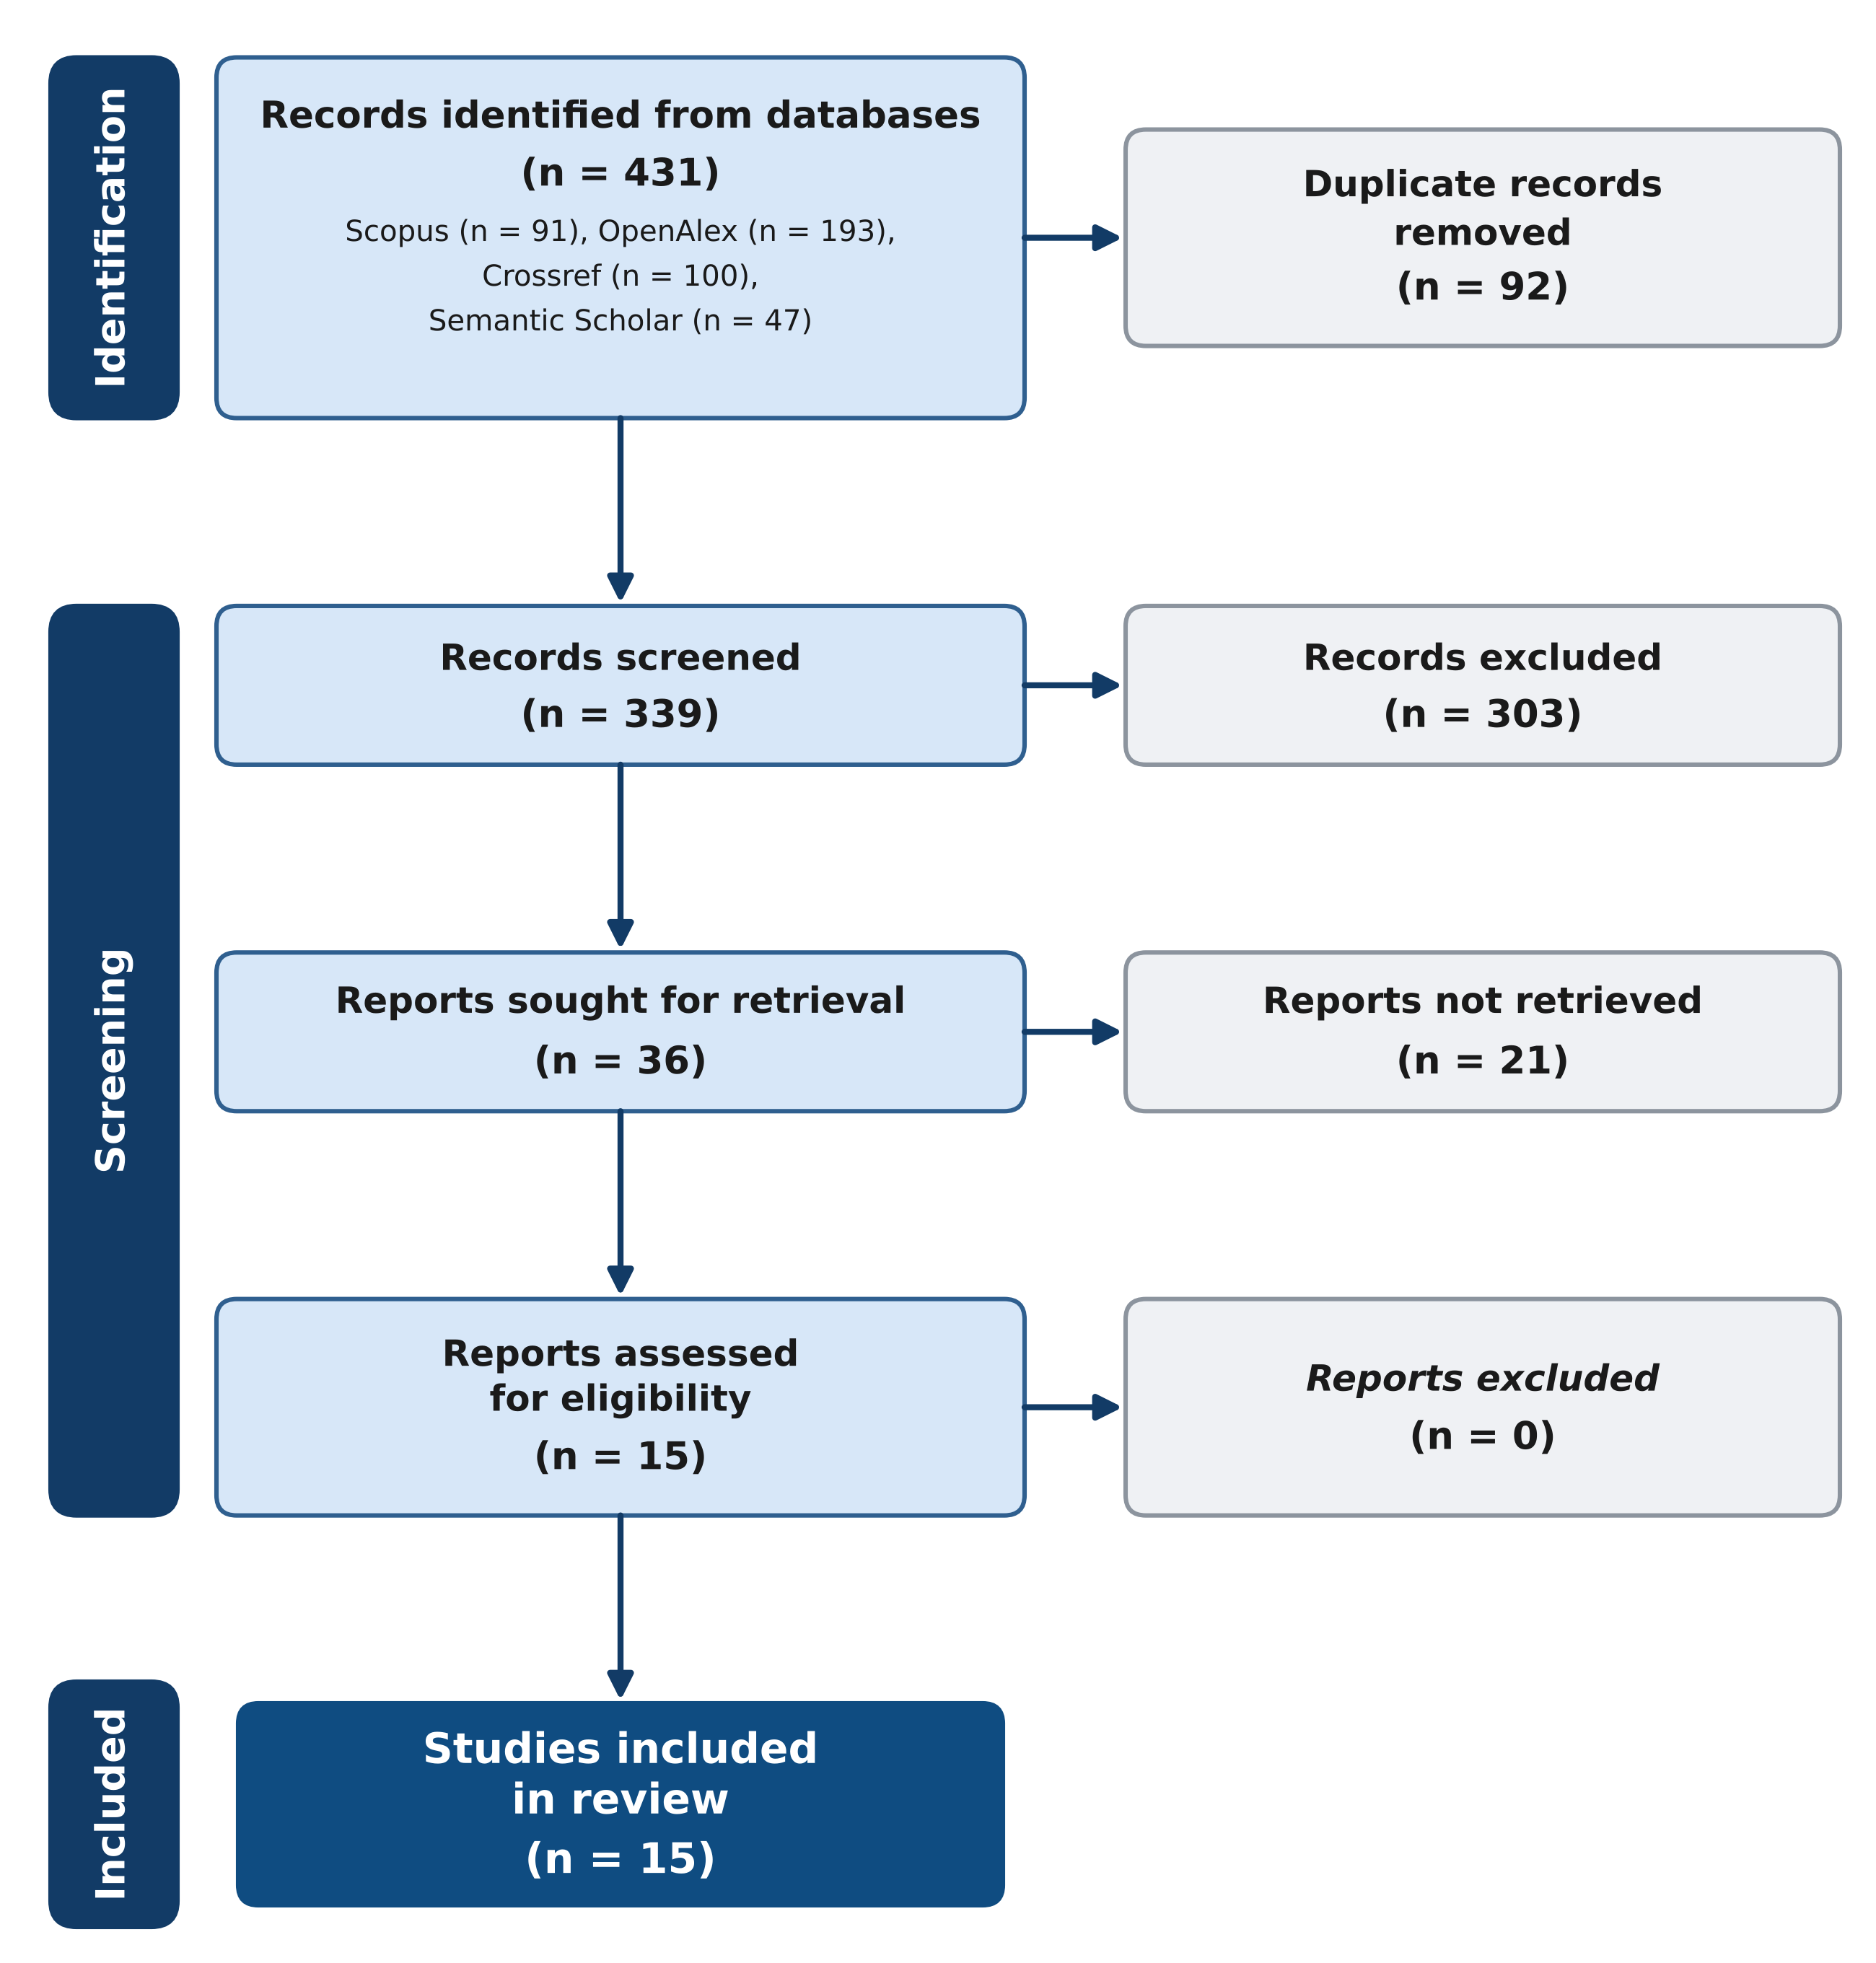
Figure 1. PRISMA 2020 flow diagram of study selection.
The title and abstract exclusions were dominated by studies of fare payment technology, fare evasion, and universal fare-free policies, together with records on unrelated topics that shared only the word fare. Scopus contributed 91 of the identified records, OpenAlex contributed 193, Crossref 100 and Semantic Scholar 47. The 21 reports that could not be retrieved were sought but were available only through paywalled publisher platforms.
Designs of income-based fare reductions and capping
Study | Country | Design | Intervention | Sample | RoB |
|---|---|---|---|---|---|
Guzman et al. 2022 | Colombia | RDD | Means-tested subsidy (32% of fare) | All personalized travel cards, 2017-2019 | Moderate |
RSUE 2022 | United States | RCT | Six months of free transit | Randomly selected low-income riders | Moderate |
TRR 2022a | United States | Case study | Fare capping policies | 101 largest transit agencies | High |
TRR 2022b | United States | Before-after | Fare capping program | Mobile ticket transactions | Moderate |
TRR 2021a | United States | Descriptive | Reduced-fare programs | 50 largest transit agencies | High |
TRR 2021b | United States | Survey | Transportation wallet | 278 participants | High |
Curl et al. 2024 | New Zealand | Survey | Half-price fares | 2022 transport survey | High |
Mallett 2025 | United States | Observational | Rail fare and subsidy policies | BART and MARTA trips | High |
Tawfik 2014 | Canada | Modelling | Distance-based and time-of-day fares | TransLink data and model | High |
Quiros-Calderon and Aguero-Valverde 2021 | Costa Rica | Methodological | Fare per kilometre structure | Bus network routes | High |
Luz 2026 | Brazil | Event study | 25% fare cut on trunk lines | Monthly line-level data | Moderate |
TRR 2016 | Spain | Incidence | Fare discounts and subsidies | Madrid fare and subsidy data | High |
JPT 2018 | United States | Policy evaluation | Low-income fare programs | US fare programs | High |
TRA 2014 | United States | Modelling | Distance-based fares | Wasatch Front model | High |
Rubensson et al. 2020 | Sweden | Modelling | Flat, zone and distance fares | Stockholm census and model data | High |
Note: RoB = risk of bias; RDD = regression discontinuity design; RCT = randomized controlled trial; TRR = Transportation Research Record; TRA = Transportation Research Part A; JPT = Journal of Public Transportation.
Regarding P1, the included studies evaluated two broad families of instruments. Six studies examined income-based discounts or means-tested subsidies. The Bogota study evaluated a subsidy equal to 32% of the regular fare delivered to low-income users through a personalized travel card, and used the discontinuity in eligibility to isolate the subsidy effect from other differences between users.( 12)
The King County study randomized six months of free transit among low-income individuals and tracked card taps across the county fleet, which allowed the authors to separate genuine travel increases from changes in how fares were paid.( 13)
The reduced-fare synthesis documented that 17 of the 50 largest United States agencies operated low-income programs, that nine of the fourteen self-administered programs offered a 50% discount, and that eligibility thresholds ranged from 125% to 200% of the federal poverty level.( 14)
The Portland evaluation described a transportation wallet that combined a USD 308 prepaid card with free bike share membership and discounted services, delivered to residents of affordable housing.( 15)
The Christchurch study examined a half-price fare policy introduced in April 2022 as a national transport relief package, using a survey to capture experiences of the reduced fare.( 16)
The Madrid study quantified the distributional incidence of fare discounts and subsidies across income groups, connecting fare design to who actually received the benefit.( 17)
Two studies documented fare capping. A synthesis of the 101 largest United States agencies found at least 21 with capping policies, of which 20 used daily caps, four used weekly caps and 14 used monthly caps, and it described nested caps applied within reduced-fare programs as an emerging design.( 9)
A companion impact analysis used mobile ticket data to estimate how a capping program changed trips and fares paid, which moved the evidence beyond design description toward measured behavior.( 18)
The remaining studies examined fare structures whose equity consequences are directly relevant to low-income riders, including distance-based and flat fare schemes in Vancouver, Utah and Stockholm, rail subsidy incidence in San Francisco and Atlanta, a methodological audit of fare inequity in Costa Rica, a fare cut in Belo Horizonte, and a policy evaluation of targeted low-income fare programs in the United States.( 19-25)
Overall, the eligible studies described a mature set of instruments rather than a single homogeneous policy, and the differences between them, in eligibility, discount depth and cap horizon, are precisely the dimensions along which the behavioral results vary.
The variation in design is not accidental: means-tested programs dominate in systems with mature smart-card infrastructure, while modelling studies of fare geometry remain common where an agency is considering a structural reform of the fare table itself.
Geographically, the studies concentrated in the Americas, with eight from the United States, three from Latin America and one from Canada, while Europe contributed two and New Zealand one; no included study came from Africa or Asia, which limits the transferability of the findings to those contexts. Temporally, the included studies spanned 2014 to 2026, with the fare capping and quasi-experimental work appearing only after 2021. The designs were predominantly observational, with two quasi-experimental studies, one randomized trial and the remainder descriptive, survey or modelling work. Fifteen studies were included.
Ridership and travel frequency responses
Study | Outcome measure | Main finding |
|---|---|---|
Guzman et al. 2022 | Monthly trips | Subsidy significantly increased monthly trips |
RSUE 2022 | Transit card use | Free fares sharply increased card use |
TRR 2022b | Ridership | Capping redistributed burden toward frequent riders |
TRR 2021b | Reported trips | Participants made more trips |
Luz 2026 | Price elasticity | Elasticity near -0.20; BRT -0.42 |
Tawfik 2014 | Predicted trips | Distance-based pricing increased trips for low-income riders |
Note: BRT = bus rapid transit.
With respect to P2, the strongest designs reported positive effects. The Bogota regression discontinuity study quantified that the 32% subsidy significantly increased the total number of monthly public transport trips, with a more pronounced effect among economically active individuals and an effect that declined over the study window, a pattern the authors interpreted as novelty decay.( 12)
The King County randomized trial showed that free fares sharply increased transit card use, although part of the increase corresponded to payment method substitution and little effect persisted after the subsidy ended.( 13)
The fare capping impact analysis indicated that caps redistributed the fare burden toward frequent riders and could raise ridership among price-sensitive groups while moderating revenue losses.( 18)
The Portland wallet survey reported that participants made more trips and reached destinations they otherwise could not have reached.( 15)
The Belo Horizonte event study quantified a short-run price elasticity near -0.20 overall, with bus rapid transit responding at -0.42 and diametrical lines essentially inelastic at -0.03, and the parallel pre-trends assumption was supported by a pre-treatment test.( 24)
The Vancouver modelling study predicted that distance-based pricing would increase trips and reduce fares for low-income, captive and transit-dependent riders.( 19)
Taken together, every study that estimated a behavioral response reported an increase in trips, card use or predicted demand for low-income or price-sensitive riders, although the magnitude ranged from a near-zero elasticity on some corridors to a substantial subsidy effect in Bogota.
The three designs that identified causal effects each pointed in the same direction, which strengthens confidence in the direction despite the small number of studies, although the absence of confidence intervals in several reports prevents a formal assessment of precision. The elasticity estimate of -0.20 means that a 10% fare reduction was associated with roughly a 2% increase in ridership in the short run, a response that is economically meaningful but far from a proportional transfer of a fare cut into ridership gain.
The contrast between the bus rapid transit response and the near-inelastic diametrical lines also warns against applying a single systemwide elasticity to a policy that will affect corridors unevenly. No included study reported a negative effect of a discount or cap on ridership, which is itself informative given the concern that discounts mainly subsidize trips that would have occurred anyway. Six studies reported effects on ridership or travel frequency.
Access to opportunities and affordability
Study | Outcome | Main finding |
|---|---|---|
Curl et al. 2024 | Perceived access and stress | Half-price fares widened access and reduced financial stress |
Guzman et al. 2022 | Access to work and services | Subsidy improved access to labour markets and recreation |
TRR 2021b | Access | Program enabled trips not otherwise possible |
TRR 2021a | Fare burden | Participants spent 2% to 6% of income on transit |
TRR 2016 | Distribution of benefits | Subsidies not always concentrated on low-income riders |
Quiros-Calderon and Aguero-Valverde 2021 | Fare inequity | High-fare routes should be audited first |
Mallett 2025 | Subsidy incidence | Subsidy marginally progressive, correlated with disadvantaged groups |
TRA 2014 | Equity of fares | Distance-based fares benefited low-income riders overall |
As for P3, access and affordability outcomes were reported in eight studies. The Christchurch analysis found that half-price fares widened access and reduced financial stress among riders experiencing transport poverty, indicating that even a temporary fare reduction can relieve the household budget constraint.( 16)
The Bogota subsidy was linked to improved access to local labour markets and recreational activities, which the authors framed as a pathway to well-being.( 12)
The Portland program increased access and enabled trips that participants could not otherwise make.( 15)
The reduced-fare synthesis estimated that participants at the eligibility threshold spent between 2% and 6% of annual income on transit, with much higher shares for very low income riders, which quantifies the residual burden that even discounted fares leave in place.( 14) The Madrid incidence analysis showed that existing subsidies were not always concentrated on lower-income riders and that fare adjustments could improve vertical equity.( 17)
The Costa Rica study identified routes whose observed fares exceeded expected levels and should be audited first because they charged higher operational costs into the fare, increasing inequity among dependent riders.( 23)
The rail cost-recovery analysis found that subsidy patterns were marginally progressive and correlated with disadvantaged socioeconomic groups.(22) The Wasatch Front analysis concluded that distance-based fares benefited low-income, elderly and non-white riders overall, although the effect was geographically uneven.( 20)
Across these studies the direction was consistent, in that lower fares for low-income riders were associated with wider access, a lower fare burden or a more progressive distribution of subsidy, and no included study reported a deterioration in access attributable to the discount itself. Eight studies reported effects on access or affordability.
Risk of bias within studies
Risk of bias was moderate in the two quasi-experimental studies and the randomized trial, which controlled the principal confounders but could not rule out substitution between fare instruments or short follow-up.( 12,13,24)
The descriptive, survey and modelling studies were rated at high risk of bias for the causal questions of P2 and P3, because most relied on self-reported travel, static demand models or cross-sectional comparisons, and the abstract-only records carried additional uncertainty about selective reporting.( 9,14-16)
For the ten studies assessed from abstracts, the domains of deviations from intended interventions and selective reporting could not be judged at all, and this incompleteness is itself a source of uncertainty that the ratings reflect. This distribution means the direction of the findings is more credible than any single magnitude.
DISCUSSION
The question that opened this review was whether lower fares, delivered through income-based discounts or caps, actually change how much low-income riders travel and what they can reach. The evidence assembled here indicates that they generally do, and that the size of the response depends on how the discount is delivered, to whom, and over what horizon.
Regarding P1, the included programs show a shift from broad first-generation fare reductions toward targeted, means-tested instruments and toward caps that reward frequency.(9,25) This mirrors the design arguments advanced in the wider literature, where targeted subsidies are described as more efficient than flat reductions because they concentrate benefit on riders with the highest marginal utility of travel, and where referential pricing has been proposed to signal the value of reduced-fare programs relative to the regular fare.(26,27)
Conversely, the persistence of distance-based and flat fare analyses in the core set shows that many systems continue to pursue equity through fare geometry rather than through income-based eligibility, an approach whose distributional consequences remain contested because horizontal and vertical equity pull in opposite directions and because high-income riders can benefit from every fare scheme.( 21,28)
The modelling studies of distance-based fares are retained in the core set because they answer the same distributional question through fare geometry, but they should be read as scenario analysis rather than as evaluations of an implemented policy. The absence of African and Asian evaluations is also notable given the size of the transit markets in those regions, and it cautions against assuming that the enrollment models developed for United States agencies will transfer to systems with different welfare registration infrastructure.
With respect to P2, the direction of the ridership evidence is consistent. Discounted and capped fares increased trips or card use in the randomized trial, the discontinuity study and the event study, and the elasticity near -0.20 estimated for Belo Horizonte sits close to the central values reported for urban transit more broadly.( 12,13,24)
The finding that bus rapid transit responded more strongly than conventional lines is consistent with studies showing heterogeneous fare elasticities across corridors and time periods, and with fare savings that vary across the network.( 29,30)
The King County result that part of the treatment effect reflected payment substitution, rather than new travel, is a caution that card use alone can overstate behavioral change, and it echoes evidence that fare complexity and the payment instrument itself shape recorded demand.( 31)
The attenuating effect observed in Bogota over time also parallels the wider finding that short-run responses to fare changes decay, and that low-income riders may respond differently than other groups to price signals, so cross-sectional elasticities should be applied to targeted programs with care.( 7,32)
The absence of long-run estimates in the included studies means the persistent component of these ridership gains remains unknown. The revenue counterpart of these gains is rarely neutral: the fare capping and reduced-fare syntheses both note that discounts and caps reduce farebox revenue unless they are offset by new trips or by dedicated subsidy, so the choice of discount level carries a fiscal consequence that the ridership estimates alone do not settle.
The finding that even a modest, temporary fare reduction produces measurable travel suggests that the income effect on low-income demand is real and not merely an artifact of pass purchase, although the payment substitution in the randomized trial shows that both channels operate simultaneously.
As for P3, the access evidence, though less quantified than the ridership evidence, points in the same direction. Participants reported reaching destinations they otherwise could not reach, and the half-price and subsidy evaluations linked lower fares to reduced financial stress and improved access to work and services.( 12,15,16)
This aligns with studies that model fare budgets and accessibility jointly, which find that the fare, not only service supply, determines how much of the city low-income riders can actually use.( 2,33,34)
The incidence results from Madrid and the Costa Rica audit add a complementary caution: fare reductions do not automatically benefit low-income riders unless the subsidy is designed around them, because existing fare structures can be regressive in practice.( 17,23)
Employer-based subsidies, which are less available to the lowest-income workers, and youth concessions illustrate the same design dependence for targeted programs, in that a subsidy only reaches the intended group when enrollment and eligibility are actively managed.( 35-37)
One measurement caveat is that most access findings in the core set are perceived or modelled rather than observed through travel diaries or activity data, so the access gains are more suggestive than the ridership gains, and they depend on how respondents interpret a fare that is only one component of the total cost of reaching an opportunity. Whether these perceived access gains materialize as more employment or better health is not established by the included studies, and the link from a cheaper trip to a better life outcome remains an inference rather than a measured chain.
The consistency across designs points to a plausible mechanism. A fare reduction relaxes the budget constraint of low-income households, lowering the marginal cost of each additional trip and shifting the point at which travel is rationed.
The concentration of effects among economically active users and frequent riders is consistent with this interpretation, because these are the riders for whom the saved fare translates directly into more job search, more shifts worked or more errands completed. The attenuation over time observed in Bogota suggests that part of the initial response reflects novelty or pent-up demand rather than a permanent change in the daily travel pattern, which is why short-run elasticities overstate long-run responses in this setting.
Measurement deserves explicit attention because the included studies span two very different data regimes. Studies using card, ticket or administrative data measure actual taps or trips and therefore capture behavior, but they cannot distinguish a genuinely new trip from a payment that simply moved from one medium to another, as the King County trial demonstrated. Survey studies capture self-reported trips and perceived access, which are closer to the experience of the rider but vulnerable to recall and social desirability.
Modelling studies, in turn, produce counterfactual estimates that are only as good as the elasticity inputs they borrow from older work. The triangulation across these regimes is a strength of the review, but it also means that no single number in this synthesis carries the same meaning as the next, and readers should weight the causal estimates above the rest.
Several sources of heterogeneity deserve attention. Fare-free and universal low-fare programs, although excluded from the core set, provide the most relevant comparison. Tallinn and Kansas City showed ridership gains but with substantial revenue and fiscal costs, the German 9-Euro-Ticket produced large but short-lived ridership responses, and fare-free policies for specific groups such as older adults raise questions of sustainability and horizontal fairness.( 38-41)
The populations, time horizons and outcome measures also differed across the included studies, from a six-month subsidy in a single United States county to permanent programs across fifty agencies, which limits any single pooled estimate. Fare increases in Beijing and the Lisbon fare reform further illustrate that distributional outcomes depend on the baseline fare structure being replaced and on how the change is framed to riders.( 8,42-44)
The definition of low income also varied across studies, from a fixed poverty-line multiple in the United States programs to a subsidy card issued through the national welfare register in Bogota, and this variation affects who is counted as a beneficiary in each estimate.
The comparison between discounts and capping deserves its own reading. A means-tested discount lowers the price of every trip for a defined group, which is the direct instrument for vertical equity but requires income verification and enrollment. A cap, by contrast, is universal in operation but progressive in incidence, because it delivers the largest savings to the riders whose cumulative monthly outlay is highest.
The included fare capping studies support this framing, in that the burden was redistributed toward frequent riders, while the reduced-fare syntheses show that means-tested programs only reach their intended group when agencies partner with social service organizations to manage enrollment.( 9,14,18,25)
The two instruments are therefore complements rather than substitutes, and the most coherent designs combine a base discount with a cap that protects the frequent low-income rider.
The generalizability of these findings to the Global South warrants caution. The Bogota and Belo Horizonte studies show that the direction of the response holds outside high-income systems, and the Costa Rica audit shows that fare inequity can be measured and corrected in a system with informal and semi-regulated operators, but the administrative machinery of means testing and capping presumes a fare media and a data infrastructure that many cities do not yet have. In systems where fares are paid in cash and routes are operated by small private providers, the instruments described here may be harder to implement than in the smart-card environments that dominate the included evidence, and this is a practical limit to transferability rather than a statistical one.
The certainty of the overall evidence is low to moderate. The three strongest designs agree on the direction of the effect, but only two of them were quasi-experimental or randomized, the follow-up was short in all of them, and the abstract-based extraction for part of the included set means some estimates could not be verified against a full text. This pattern matches the state of the wider fare policy literature, in which causal evaluations of fare changes remain scarce relative to modelling and descriptive work.
The findings should therefore be read as a consistent signal in favor of income-based discounts and capping, rather than as a precisely estimated effect size that can be transferred from one city to another. A future meta-analysis will only become possible if primary studies begin to report elasticities or trip changes on a common scale, with standard errors, and with the same follow-up horizon.
Standardizing the low-income threshold used to define eligibility would further help, because the present heterogeneity in definitions is itself a barrier to pooling. These reporting improvements are inexpensive relative to the cost of the programs themselves, and they would convert the next generation of evaluations into directly comparable evidence.
Review Limitations and Practice Implications
Eligibility and extraction for ten of the fifteen included studies relied on structured abstracts because publisher full texts were not openly accessible, which may have introduced selective reporting of results and prevented a complete risk-of-bias judgment; future updates should use institutional subscriptions to retrieve these records.( 10)
For practice, the evidence supports targeting rather than flat reductions, capping as a complement for frequent riders, and outcome monitoring that separates new travel from payment substitution. Agencies planning an income-based discount should invest in enrollment partnerships with social service organizations, which the included syntheses identify as the difference between programs that reach low-income riders and programs that remain nominal.
Agencies planning a cap should monitor whether savings accrue to frequent low-income riders or to higher-income commuters who would have purchased a pass anyway, because the incidence of a cap depends on the distribution of trip frequencies in the rider population. For research, the field would benefit from pre-registered quasi-experimental evaluations of the same program over multiple years, from standardized access outcomes measured before and after fare changes, and from reporting effect estimates with confidence intervals so that future work can be pooled. What remains open is whether the initial ridership gains documented here persist once novelty fades and whether the access benefits translate into durable gains in employment, health and social participation.
CONCLUSIONS
The included evidence describes a family of income-based fare discounts and capping schemes whose designs range from means-tested half-fare programs to daily, weekly and monthly caps. Discounted and capped fares were associated with higher ridership and travel frequency among low-income riders in most studies that measured these outcomes. The evidence also indicates that these policies widened access and reduced the financial burden of travel, with the strongest effects reported among riders experiencing transport poverty. The certainty of this evidence is limited by predominantly observational designs, short follow-up and abstract-based extraction for part of the included set.
References
- 1 Perrotta AF. Transit Fare Affordability: Findings From a Qualitative Study. Public Works Management & Policy. 2017;22(3):226-252. doi: 10.1177/1087724x16650201
- 2 Liu D, Kwan M. Measuring Job Accessibility Through Integrating Travel Time, Transit Fare And Income: A Study Of The Chicago Metropolitan Area. Tijd voor Econ & Soc Geog. 2020;111(4):671-685. doi: 10.1111/tesg.12415
- 3 El-Geneidy A, Levinson D, Diab E, Boisjoly G, Verbich D, Loong C. The cost of equity: Assessing transit accessibility and social disparity using total travel cost. Transportation Research Part A: Policy and Practice. 2016;91:302-316. doi: 10.1016/j.tra.2016.07.003
- 4 Liu D, Kwan M, Kan Z, Song Y. An integrated analysis of housing and transit affordability in the Chicago metropolitan area. Geographical Journal. 2021;187(2):110-126. doi: 10.1111/geoj.12377
- 5 Bruno M, Kouwenberg M, van Oort N. Equity in transit fare policy: a literature review. Transport Reviews. 2026;46(3):525-546. doi: 10.1080/01441647.2025.2601689
- 6 Rodrigue L, Badami MG, El-Geneidy A. Evaluating the effects of fare characteristics on fare equity: A scoping review. Journal of Public Transportation. 2025;27:100140. doi: 10.1016/j.jpubtr.2025.100140
- 7 Miller C, Savage I. Does the demand response to transit fare increases vary by income?. Transport Policy. 2017;55:79-86. doi: 10.1016/j.tranpol.2017.01.006
- 8 Zhao P, Zhang Y. The effects of metro fare increase on transport equity: New evidence from Beijing. Transport Policy. 2019;74:73-83. doi: 10.1016/j.tranpol.2018.11.009
- 9 Hightower A, Ziedan A, Crossland C, Brakewood C. Current Practices and Potential Rider Benefits of Fare Capping Policies in the U.S.A. Transportation Research Record: Journal of the Transportation Research Board. 2022;2676(10):376-390. doi: 10.1177/03611981221089572
- 10 Page MJ, McKenzie JE, Bossuyt PM, Boutron I, Hoffmann TC, Mulrow CD, et al. The PRISMA 2020 statement: an updated guideline for reporting systematic reviews. BMJ. 2021:n71. doi: 10.1136/bmj.n71
- 11 Sterne JA, Hernán MA, Reeves BC, Savović J, Berkman ND, Viswanathan M, et al. ROBINS-I: a tool for assessing risk of bias in non-randomised studies of interventions. BMJ. 2016:i4919. doi: 10.1136/bmj.i4919
- 12 Guzman LA, Hessel P. The effects of public transport subsidies for lower-income users on public transport use: A quasi-experimental study. Transport Policy. 2022;126:215-224. doi: 10.1016/j.tranpol.2022.07.016
- 13 Brough R, Freedman M, Phillips DC. Experimental evidence on the effects of means-tested public transportation subsidies on travel behavior. Regional Science and Urban Economics. 2022;96:103803. doi: 10.1016/j.regsciurbeco.2022.103803
- 14 Darling W, Carpenter E, Johnson-Praino T, Brakewood C, Voulgaris CT. Comparison of Reduced-Fare Programs for Low-Income Transit Riders. Transportation Research Record: Journal of the Transportation Research Board. 2021;2675(7):335-349. doi: 10.1177/03611981211017900
- 15 Tan H, McNeil N, MacArthur J, Rodgers K. Evaluation of a Transportation Incentive Program for Affordable Housing Residents. Transportation Research Record: Journal of the Transportation Research Board. 2021;2675(8):240-253. doi: 10.1177/0361198121997431
- 16 Curl A, Coppens A, Dares C, Williman J, Fitt H, Kingham S. Accessibility and Affordability Impacts of Half Price Public Transport Fares in Aotearoa New Zealand. Findings. 2024;2024. doi: 10.32866/001c.92735
- 17 Cadena PCB, Vassallo JM, Herraiz I, Loro M. Social and Distributional Effects of Public Transport Fares and Subsidy Policies: Case of Madrid, Spain. Transportation Research Record: Journal of the Transportation Research Board. 2016;2544(1):47-54. doi: 10.3141/2544-06
- 18 Morrissey A, Oke T. Fare-Capping Impact Analysis Using Mobile Ticket Data. Transportation Research Record: Journal of the Transportation Research Board. 2022;2676(7):811-822. doi: 10.1177/03611981221082529
- 19 Tawfik NS. From Fare Zones to Fair Zones: The Impact of Differentiated Transit Fares on Metro Vancouver Transit Riders [Internet]. 2014. Available from: https://summit.sfu.ca/_flysystem/fedora/sfu_migrate/14518/etd8593_NTawfik.pdf
- 20 Farber S, Bartholomew K, Li X, Páez A, Nurul Habib KM. Assessing social equity in distance based transit fares using a model of travel behavior. Transportation Research Part A: Policy and Practice. 2014;67:291-303. doi: 10.1016/j.tra.2014.07.013
- 21 Rubensson I, Susilo Y, Cats O. Is flat fare fair? Equity impact of fare scheme change. Transport Policy. 2020;91:48-58. doi: 10.1016/j.tranpol.2020.03.013
- 22 Mallett Z. Inequitable inefficiency: A case study of rail transit fare policies. JTLU. 2025;18(1):319-358. doi: 10.5198/jtlu.2025.2485
- 23 Quirós Calderón CS, Agüero-Valverde J. Fare inequities in public transit system in Costa Rica. Ingeniería. 2021;31(2):80-97. doi: 10.15517/ri.v31i2.45018
- 24 Luz G. Short-Run Price Elasticity of Demand for Public Transit in Belo Horizonte, Brazil: Evidence from a 2023 Fare Cut. Findings. 2026. doi: 10.32866/001c.163615
- 25 Northeast Corridor Commission, Harmony X. Fare Policy and Vertical Equity: The Trade-off between Affordability and Cost Recovery. JPT. 2018;21(2):41-59. doi: 10.5038/2375-0901.21.2.3
- 26 Guzman LA, Ochoa JL, Cardona SG, Sarmiento-Barbieri I. Pro-poor transport subsidies: More user welfare and faster travel. Transportation Research Part A: Policy and Practice. 2025;195:104454. doi: 10.1016/j.tra.2025.104454
- 27 Jara-Diaz SR, Cruz D, Tapia F. Referential transit prices for users of reduced fare programs. Research in Transportation Economics. 2025;110:101533. doi: 10.1016/j.retrec.2025.101533
- 28 Isfahan University of Technology, Bandegani M, Akbarzadeh M, Isfahan University of Technology. Evaluation of Horizontal Equity under a Distance-Based Transit Fare Structure. JPT. 2016;19(3):161-172. doi: 10.5038/2375-0901.19.3.10
- 29 Guzman LA, Moncada CA, Gómez S. Fare discrimination and daily demand distribution in the BRT system in Bogotá. Public Transp. 2018;10(2):191-216. doi: 10.1007/s12469-018-0181-7
- 30 Kim S, Han Y, Im S, Minarta RR, Ko J. Factors associated with transit fare savings through the integrated fare system: A spatiotemporal perspective. Transport Policy. 2026;182:104118. doi: 10.1016/j.tranpol.2026.104118
- 31 Anciaes P, Metcalfe P, Heywood C, Sheldon R. The impact of fare complexity on rail demand. Transportation Research Part A: Policy and Practice. 2019;120:224-238. doi: 10.1016/j.tra.2018.12.020
- 32 Liao Y, Torbjörnsson C, Gil J, Pereira RHM, Yeh S, Gohl N, et al. Uncovering the social and spatial effects of fare cuts on public transport with mobile geolocation data. Transportation Research Part A: Policy and Practice. 2025;200:104647. doi: 10.1016/j.tra.2025.104647
- 33 Da Silva D, Klumpenhouwer W, Karner A, Robinson M, Liu R, Shalaby A. Living on a fare: Modeling and quantifying the effects of fare budgets on transit access and equity. Journal of Transport Geography. 2022;101:103348. doi: 10.1016/j.jtrangeo.2022.103348
- 34 Barboza M, Giannotti M, Grigolon A, Geurs K. Transit fares and space-time accessibility: measuring inequalities in park accessibility for São Paulo favela residents using mobile phone and smart card data. Journal of Transport Geography. 2025;128:104395. doi: 10.1016/j.jtrangeo.2025.104395
- 35 Lachapelle U. Employer subsidized public transit pass: Assessing disparities in access, use, and latent demand. Case Studies on Transport Policy. 2018;6(3):353-363. doi: 10.1016/j.cstp.2017.08.006
- 36 Virginia Tech Alexandria Center, Hamre A. Low-Income Access to Employer-Based Transit Benefits: Evidence from 10 Large Metropolitan Regions. tdm. 2019;1(1):1-17. doi: 10.5038/2642-6188.1.1.1
- 37 Arranz JM, Burguillo M, Rubio J. Subsidisation of public transport fares for the young: An impact evaluation analysis for the Madrid Metropolitan Area. Transport Policy. 2019;74:84-92. doi: 10.1016/j.tranpol.2018.11.008
- 38 Cats O, Susilo YO, Reimal T. The prospects of fare-free public transport: evidence from Tallinn. Transportation. 2017;44(5):1083-1104. doi: 10.1007/s11116-016-9695-5
- 39 Mendez J. Advancing mobility through fare-free transit: Evidence from the Kansas City Metropolitan Area. Transport Policy. 2025;174:103860. doi: 10.1016/j.tranpol.2025.103860
- 40 Waldorf I, Loder A, Wurster S, Bogenberger K. Low fare public transport as social policy? A study of Germany’s 9-Euro-Ticket and Deutschlandticket via propensity score matching. Transportation. 2025. doi: 10.1007/s11116-025-10640-7
- 41 Yun J. Strategies for Improving the Sustainability of Fare-Free Policy for the Elderly through Preferences by Travel Modes. Sustainability. 2023;15(20):14678. doi: 10.3390/su152014678
- 42 Silver K, Lopes A, Vale D, da Costa NM. The inequality effects of public transport fare: The case of Lisbon's fare reform. Journal of Transport Geography. 2023;112:103685. doi: 10.1016/j.jtrangeo.2023.103685
- 43 Zhang J, Yan X, An M, Sun L. The Impact of Beijing Subway’s New Fare Policy on Riders’ Attitude, Travel Pattern and Demand. Sustainability. 2017;9(5):689. doi: 10.3390/su9050689
- 44 Hasnine MS, Habib KN. Transportation demand management (TDM) and social justice: A case study of differential impacts of TDM strategies on various income groups. Transport Policy. 2020;94:1-10. doi: 10.1016/j.tranpol.2020.05.002
Declarations
Funding
No financing
Conflict of interest
None
Authorship contributions
Drafting – original draft: Teresa Irina Salazar Echeagaray.
Writing–review and editing: Teresa Irina Salazar Echeagaray.