

Abstract
Introduction: Road traffic injuries kill more than one million people every year, and comprehensive national legislation is a core preventive strategy, but cross-national evidence adjusted for income and motorization is scarce. Methods: This cross-sectional ecological study linked WHO road safety legislation indicators from the 2018 Global status report on road safety round with road traffic death rates, gross domestic product per capita and registered vehicles per 1,000 people around 2016. A comprehensive legislation score (0 to 5) counted laws meeting best-practice criteria for speed, drink-driving, helmets, seat-belts and child restraints, and linear regression of the log death rate was adjusted for income and motorization. Results: Among 113 countries the median road traffic death rate was 13.70 per 100,000. Each additional comprehensive law was associated with a −0.29 change in log death rate without adjustment and −0.09 (95% CI −0.17 to −0.01) after adjustment, equivalent to −8.7% lower mortality per additional law. Conclusions: More comprehensive national road safety legislation is associated with lower road traffic death rates independently of income and motorization, although income remains the strongest correlate.
Keywords
road traffic deaths, legislation, road safety, motor vehicles, income
INTRODUCTION
Road traffic crashes kill an estimated 1.19 million people each year and are the leading cause of death among children and young adults aged 5 to 29 years.(1) The toll is concentrated in low- and middle-income countries, where more than 90% of road traffic deaths occur despite a smaller share of the global motor vehicle fleet.( 2)
The 2023 Global Burden of Disease study identified road injuries as a persistent contributor to the global burden of death and disability.( 3) Although a second downward trend in global road traffic deaths has been documented, progress is uneven and the absolute number of deaths remains high.( 4)
The Sustainable Development Goals include a target to halve global road traffic deaths, which makes the legislative and policy determinants of these deaths a pressing measurement and governance question.( 5)
The Decade of Action for Road Safety 2021-2030 operationalizes this target through a safe system that couples legislation with safer roads, vehicles and post-crash care.( 1)
The five behavioural risk factors targeted by the World Health Organization, speed, drink-driving, motorcycle helmets, seat-belts and child restraints, are addressed through national legislation of variable comprehensiveness.( 2)
The World Health Organization defines comprehensiveness through best-practice thresholds: an urban speed limit of 50 km/h or less, a blood alcohol concentration limit of 0.05 g/dl or less, helmet laws that cover all occupants and seat-belt and child restraint provisions that apply to all seating positions.( 2)
Speed is a major determinant of crash risk and severity, and urban speed limits are a core component of the safe system approach to road safety.( 6)
Drink-driving laws reduce alcohol-related crashes, and legal blood alcohol concentration limits have been associated with lower traffic mortality across countries.( 7,8)
Helmet and restraint laws protect occupants when crashes occur.( 9,10)
Legislation operates through enforcement and behaviour change, however, and the same law can produce different outcomes depending on how consistently it is applied.( 11)
A graded decline in the death rate is therefore expected as the number of comprehensive national laws increases.( 12)
Global analyses of the WHO status reports suggest that countries with more complete legislative packages also report fewer deaths per population, although income and motorization covary with both.( 12,13)
Targeted mitigation that combines these laws is central to the goal of halving global road traffic deaths.( 5) The association of legislation with death rates has also been observed for specific injuries, such as maxillofacial trauma, which fell after traffic legislation in several settings.( 14)
Most existing evidence evaluates a single law within one country or compares a small set of settings, and few studies quantify how the comprehensiveness of the full legislative package relates to death rates after accounting for income and motorization.( 11,15)
Single-country interrupted time series designs provide strong internal validity but limited external generalization, whereas cross-national comparisons rarely isolate the independent contribution of legislation.( 16)
An ecological design with a transparent, reproducible exposure is therefore a useful complement to these designs, because it can cover many countries and adjust for the two covariates that most plausibly confound the association. The objective of this study was to examine whether the number of comprehensive national laws on speed, drink-driving, helmets, seat-belts and child restraints is associated with lower road traffic death rates across countries, adjusted for income and motorization.
METHODS
This cross-sectional ecological study used countries as the unit of analysis, with the road traffic death rate and the legislative indicators measured around 2016. The reporting follows the STROBE recommendations for observational studies. Road traffic death rates per 100,000 population for 2016 were obtained from the World Bank World Development Indicators, indicator SH.STA.TRAF.P5, which republishes WHO road traffic death estimates.( 17)
Income was measured as gross domestic product per capita in purchasing power parity terms for 2016, obtained from the World Bank indicator NY.GDP.PCAP.PP.KD.( 17) Motorization was measured as registered vehicles per 1,000 people, obtained from Our World in Data, which republishes WHO motorization data; the year nearest to 2016 was used when 2016 was unavailable.( 18)
National road safety legislation indicators were obtained from the WHO Global Health Observatory road safety data, downloaded from the Humanitarian Data Exchange mirror because the WHO OData service returned errors during the study period.( 19) These indicators correspond to the 2018 Global status report on road safety round and refer to 2016 and 2017.( 2)
The dataset contains 192 country files with sixteen indicators covering the five legislative domains, including the maximum urban speed limit, the blood alcohol concentration limit, the applicability of the motorcycle helmet law and the existence of seat-belt and child restraint laws. All sources are openly downloadable without login, and the access dates and URLs are recorded in the study provenance file.
The outcome was the natural logarithm of the road traffic death rate per 100,000 population in 2016. The logarithmic transformation was used because the death rate is right-skewed and the regression coefficients then express proportional changes.
The exposure was a comprehensive legislation score ranging from 0 to 5, computed as the count of laws meeting best-practice criteria across five domains. The speed domain required an urban speed limit of 50 km/h or less, taken from the maximum speed limits indicator for urban areas. The drink-driving domain required a blood alcohol concentration limit of 0.05 g/dl or less for the general population.
The helmet domain required a motorcycle helmet law applicable to drivers, adult passengers and child passengers, meaning that child passengers were not unrestricted. The seat-belt domain required a national seat-belt law, and the child restraint domain required a national child restraint law. Each domain was coded 1 when the criterion was met, 0 when it was not, and missing when the value was not reported; the score required complete data on all five domains. The two covariates were the natural logarithm of gross domestic product per capita and registered vehicles per 1,000 people.
The best-practice criteria were selected because they correspond to the thresholds that the World Health Organization uses to judge whether a law is comprehensive, rather than merely present.( 2)
An urban speed limit of 50 km/h or less, a blood alcohol concentration limit of 0.05 g/dl or less, helmet coverage of all occupants and explicit seat-belt and child restraint provisions are the defining features of strong legislation in the status report framework.( 2) This operationalization therefore matches the construct of comprehensiveness in the research question more closely than the simple existence of a law, which shows little variation across countries.
Countries with complete data on the outcome, the five legislation domains and both covariates were included; no imputation was performed. For the descriptive table, the sample was divided into a low-scoring group (score 1 to 3) and a high-scoring group (score 4 to 5) to summarize the gradient in a compact form. Continuous variables were summarized with the median and interquartile range because several of them were skewed.
The association between the legislation score and the death rate was first described with a scatter plot and a Spearman rank correlation, and then estimated with linear regression models of the log-transformed death rate, unadjusted and adjusted for log income and motorization. The logarithmic transformation stabilizes the variance of the death rate and makes the coefficients directly interpretable as proportional differences. Regression coefficients were exponentiated to express the proportional change in the death rate per additional law, and 95% confidence intervals were computed from the model estimates.
Four secondary models estimated the adjusted association of each legislation domain separately, excluding the seat-belt domain, whose law was universal in the analytic sample. A sensitivity analysis recomputed the score over four domains after removing the seat-belt domain to verify that the estimate did not depend on this near-constant component. Income and motorization were entered in the same form in every model so that the domain-specific coefficients are comparable with the main estimate.
The reference year 2016 was chosen because it is the year of the road traffic death estimates in the 2018 status report round, to which the legislation indicators belong.( 2)
The legislation indicators are reported by national data coordinators to the World Health Organization and are published in the status report, which defines the best-practice criteria used here.( 2)
Countries that did not report a value for a domain were treated as missing rather than as not having a law, which avoids misclassifying absent reporting as absent legislation. The road traffic death rate is a modelled estimate produced by the World Health Organization rather than a raw count, so it is comparable across countries with different registration systems.( 2) Because the analysis is restricted to countries with complete data, the findings describe the set of countries that report all five legislative domains and both covariates.
All data are openly available without login: the legislation indicators from the Humanitarian Data Exchange mirror of the WHO Global Health Observatory, the death rate and income from the World Bank, and the motorization series from Our World in Data. The analysis script and the derived country-level dataset are retained with the study materials so that the results can be reproduced. No imputation was performed, and all exclusions follow from the complete-case rule described above.
RESULTS
Road safety legislation indicators were available for 175 countries. After merging these indicators with the death rate, income and motorization and requiring complete data on the five domains, the analytic sample comprised 113 countries. The median road traffic death rate was 13.70 per 100,000 (IQR 6.50 to 23) (Table 1).
The covariates showed wide dispersion across the sample. Median gross domestic product per capita was 19,826 (IQR 9,403 to 37,467), and median registered vehicles per 1,000 people was 310 (IQR 148 to 582) (Table 1). The death rate itself was right-skewed, with a quarter of countries above 23 per 100,000, which justified the logarithmic transformation used in the regression models.
Variable | Overall (n=113) | Score 1–3 (n=50) | Score 4–5 (n=63) |
|---|---|---|---|
Road traffic death rate per 100,000, median (IQR) | 13.7 (6.5–23.0) | 21.4 (13.3–28.3) | 8.9 (5.8–15.9) |
GDP per capita, PPP, median (IQR) | 19826 (9403–37467) | 9961 (4768–19751) | 31469 (16739–47478) |
Registered vehicles per 1,000, median (IQR) | 310 (148–582) | 152 (64–307) | 462 (279–689) |
Legislation score, mean (SD) | 3.5 (1.3) | 2.2 (0.7) | 4.4 (0.5) |
Note: IQR = interquartile range; PPP = purchasing power parity; SD = standard deviation.
The comprehensive legislation score ranged from 1 to 5 with a mean of 3.50 (SD 1.30). The distribution clustered toward the upper end, with 8 countries scoring 1, 23 scoring 2, 19 scoring 3, 36 scoring 4 and 27 scoring 5 (Figure 1). The proportion of countries meeting each criterion was 66.4% for speed, 71.7% for drink-driving, 42.5% for helmets, 100.0% for seat-belts and 64.6% for child restraints. The seat-belt criterion was met by every country, whereas the helmet criterion was met by fewer than half.
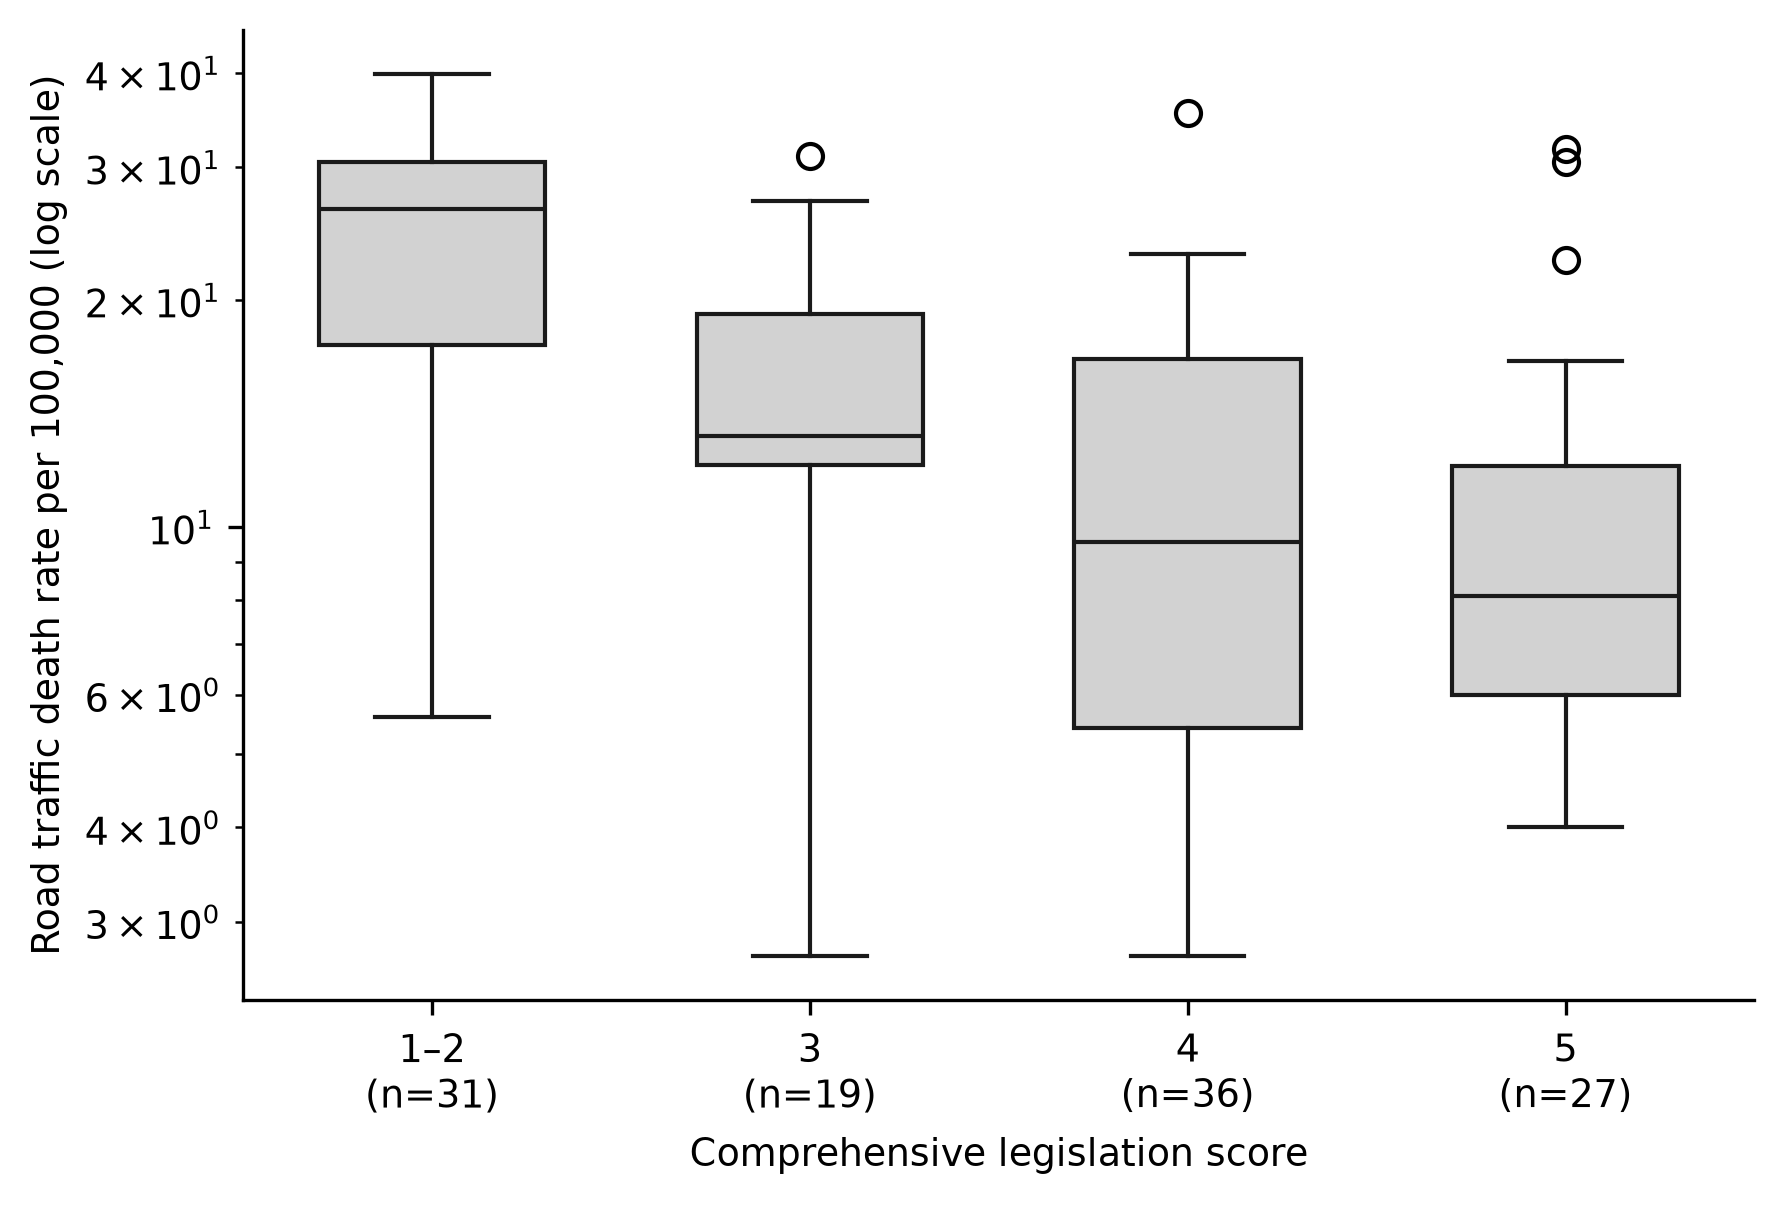
Figure 1. Road traffic death rate by comprehensive legislation score category.
Note: Boxes show the median and interquartile range; whiskers extend to 1.5 times the interquartile range.The death rate followed a graded pattern across score categories. The median rate was 21.40 per 100,000 among the 50 countries scoring 1 to 3 and 8.90 per 100,000 among the 63 countries scoring 4 or 5 (Table 1). Countries scoring 4 or 5 also had higher median income and motorization than those scoring 1 to 3, which motivated the adjustment for these two covariates (Table 1).
The slope of the association was negative (Figure 2). Each additional comprehensive law was associated with a −0.29 change in log death rate without adjustment (95% CI −0.38 to −0.20; p <0.001; R² = 0.26). The Spearman correlation between the score and the death rate was −0.51 (p <0.001).
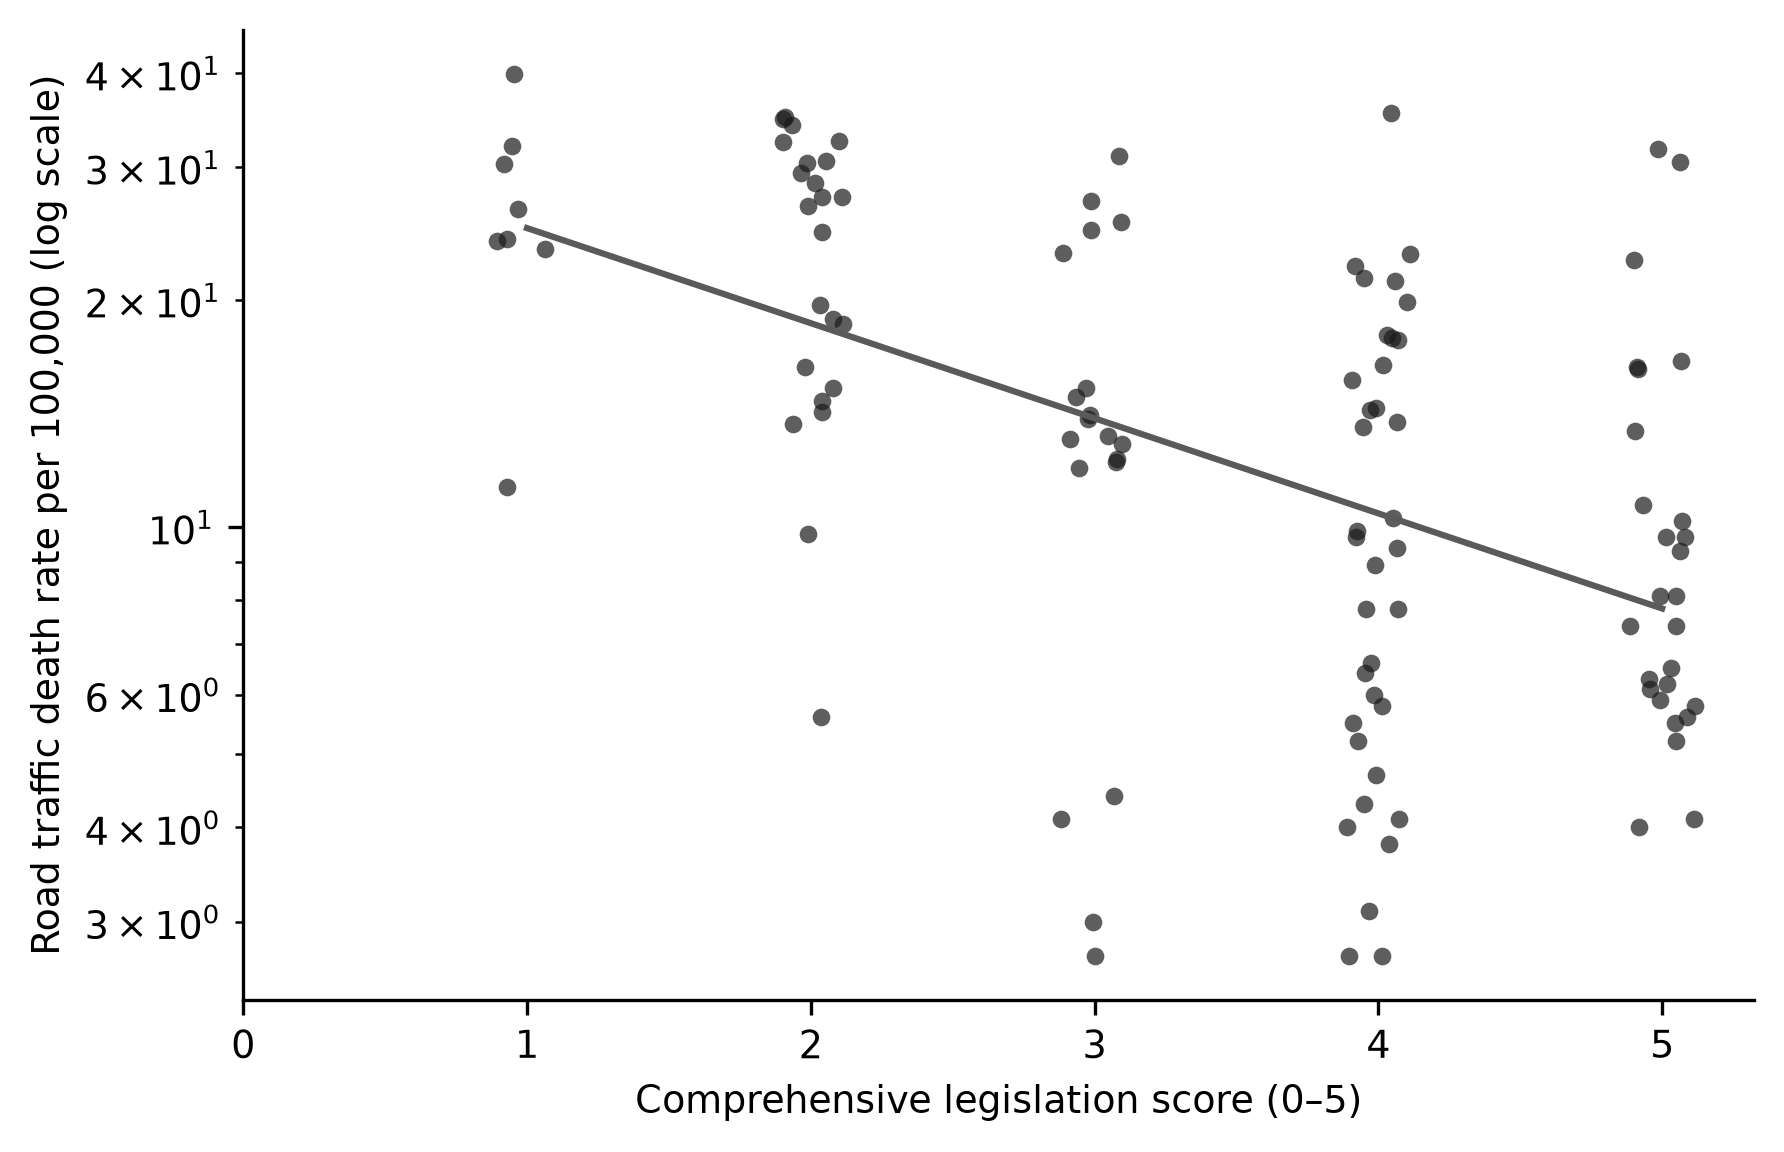
Figure 2. Road traffic death rate against the comprehensive legislation score.
Note: The solid line is the fitted unadjusted linear regression on the log scale.After adjustment for income and motorization, the association attenuated but persisted (Table 2). Each additional comprehensive law corresponded to a −0.09 change in log death rate (95% CI −0.17 to −0.01; p = 0.025), equivalent to −8.7% lower mortality per additional law. Income was the strongest covariate (β = −0.397 per unit of log GDP; p <0.001), whereas motorization showed no independent association (β = −0.000; p = 0.352). The adjusted model explained 0.61 of the variance in the log death rate, compared with 0.26 for the unadjusted score alone.
Model | β per additional law (95% CI) | p value | R² |
|---|---|---|---|
Unadjusted | -0.29 (-0.38 to -0.20) | <0.001 | 0.26 |
Adjusted for income and motorization | -0.09 (-0.17 to -0.01) | 0.025 | 0.61 |
Note: β = regression coefficient for each additional comprehensive law; CI = confidence interval.
In the domain-specific adjusted models, the urban speed limit of 50 km/h or less and the child restraint law showed negative associations (β = −0.29; 95% CI −0.47 to −0.11; p = 0.002, and β = −0.27; 95% CI −0.49 to −0.05; p = 0.016) (Figure 3). The drink-driving criterion showed no independent association (β = −0.10; 95% CI −0.31 to 0.12; p = 0.372), and the same was true for the helmet criterion (β = 0.06; 95% CI −0.12 to 0.23; p = 0.539). The sensitivity analysis excluding the seat-belt domain, which was universal, yielded an identical estimate (β = −0.09; 95% CI −0.17 to −0.01; p = 0.025).
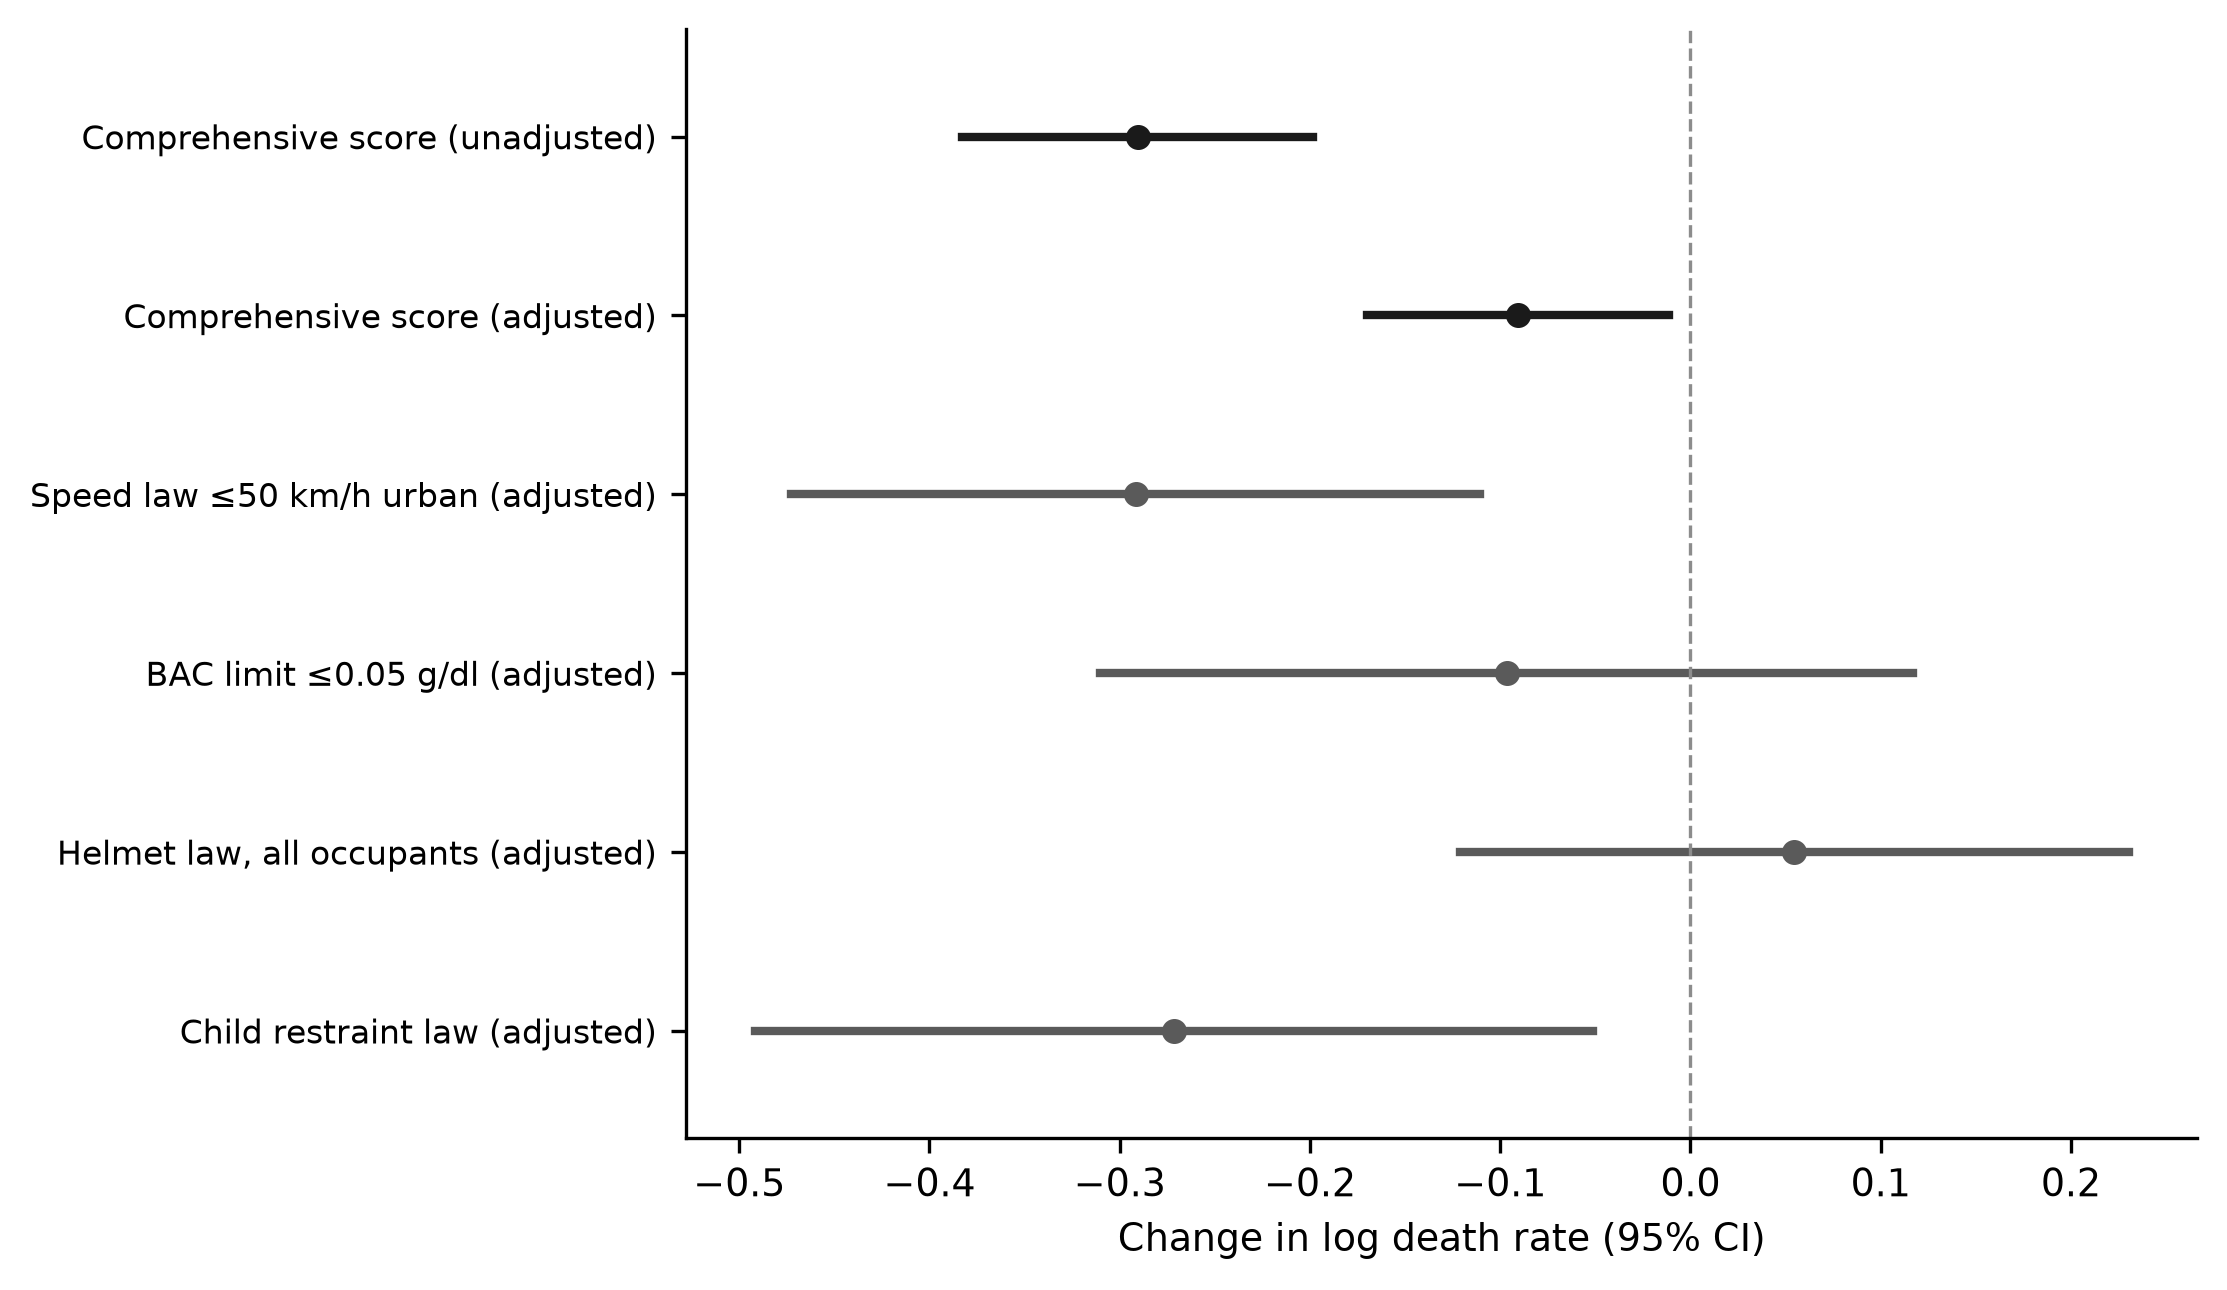
Figure 3. Unadjusted and adjusted associations of the legislation score and its domains with the log road traffic death rate.
Note: Dots are regression coefficients; horizontal lines are 95% confidence intervals.DISCUSSION
The main finding of this study was that countries with more comprehensive road safety legislation had lower road traffic death rates, and that this association persisted, attenuated, after adjustment for income and motorization. The crude association was strong, whereas income absorbed a large share of it. This pattern is consistent with cross-national analyses showing that economic development is the dominant correlate of road mortality differences between countries.( 15,20)
The finding matters because it suggests that the legislative package itself, and not only the wealth of a country, is associated with road safety outcomes.
The attenuation after adjustment mirrors earlier evidence that income, motorization and road safety law enforcement travel together across countries, so that the crude association overstates the independent contribution of legislation.( 11)
Global analyses of the WHO status reports likewise show that income and legislation coverage co-vary, which makes the independent contribution of legislation difficult to isolate.( 12)
The finding also aligns with a 165-country analysis in which legal blood alcohol concentration limits were associated with lower alcohol-attributable traffic mortality,( 7) and with European evidence linking economic growth to road mortality trends.( 21)
The direction of the associations is consistent with the goal of halving global road traffic deaths through targeted mitigation.( 5)
The dominance of income in the adjusted model reflects a well-documented paradox: low- and middle-income countries have fewer vehicles per person yet higher death rates per population, because exposure, infrastructure, vehicle standards and post-crash care all differ systematically with income.( 15)
Motorization showed no independent association once income was included, which suggests that the number of vehicles matters less than the conditions in which they are used.( 22) The fact that legislation retained an association after income was controlled therefore strengthens the case that the legislative package reflects more than wealth alone.
The speed domain showed the clearest pattern among the domains. Countries with an urban speed limit of 50 km/h or less had lower death rates after adjustment, consistent with before-and-after studies of city speed limit reductions( 23,24) and with reviews of 30 km/h zones in Europe.( 6)
This is physically plausible, because lower speeds reduce both the probability of a crash and the energy transferred in the event of a collision.( 6) Speed limits are also among the most readily enforceable of the five domains, which may explain why their association is detectable in cross-sectional data where enforcement intensity is not observed.( 11)
The consistency of the speed finding across designs strengthens confidence that it is not an artefact of the ecological setting, and it justifies the priority that speed management receives in the safe system approach.
The association for child restraint laws was similarly negative, in line with interrupted time series evidence on child restraint legislation,( 25) with worldwide reviews of child restraint adoption( 10) and with evaluations of child safety seat laws.( 26)
Qualitative syntheses show that the barriers to child restraint use are mainly practical and cultural, which suggests that a law is a necessary but not sufficient condition.(27) Child restraint laws are also comparatively inexpensive to adopt and enforce, and they target a particularly vulnerable group, which strengthens their policy appeal.(28)
The negative association observed here is therefore consistent with laws operating together with awareness and enforcement rather than alone.
The drink-driving criterion showed no independent association in this sample, which differs from studies of stricter drunk-driving laws within individual countries( 16,29) and from ecological evaluations of alcohol control policies.( 8,30)
One explanation is that the ecological comparison captures whether a country has a legal limit of 0.05 g/dl or less, but not the intensity of enforcement, which is the stronger determinant of effectiveness across countries.( 11) The near-universal adoption of drink-driving legislation also reduces the variation available to estimate an independent effect, and zero tolerance laws appear to matter most in specific settings.( 31)
The null results for the drink-driving and helmet criteria should not be read as evidence that these laws are ineffective. They indicate instead that, at the cross-national level and with the criteria coded as present or absent, the variation in these domains was insufficient to detect an independent association after adjustment.( 9)
Single-country studies with stronger designs continue to show that drink-driving and helmet legislation reduce deaths, which supports the retention of these laws within comprehensive packages even when the ecological signal is weak.( 16)
The helmet criterion likewise showed no independent association, in contrast with reviews of helmet legislation by income level.( 9,32)
The helmet criterion was the least frequently met in the sample, which reduces statistical power, and its operationalization as applicability to all occupants is more demanding than the existence of any helmet law.
Studies of helmet regulation in Vietnam illustrate how the same law can produce very different outcomes depending on enforcement and equity of access to helmets.( 33,34)
These null findings are consistent with the view that the existence of a law and its enforcement are distinct constructs in cross-national data.( 11)
The seat-belt criterion could not be analyzed because every country in the sample had a law, a ceiling also documented in global seat-belt policy assessments.( 35,36)
This universality is itself informative: it suggests that the remaining variation in seat-belt related outcomes across countries is driven by wearing rates and enforcement rather than by the presence of legislation. The sensitivity analysis that removed this near-constant domain returned the same estimate, which confirms that the composite score was not driven by the seat-belt component.
Several mechanisms could explain the association. Comprehensive legislation signals a functioning road safety management system and is usually accompanied by enforcement, safer infrastructure and post-crash care, which together reduce death rates.( 12)
Income operates through the same pathways, including vehicle safety and road quality, which is why it remained the strongest correlate in the adjusted model.( 22,37)
Policy action that combines legislation with enforcement has been associated with lower road casualties in settings as different as Zimbabwe and Vietnam.( 34,38)
he association between legislation and reduced traffic-related injuries has also been documented at the level of specific injury patterns.( 14)
The contrast between the composite score and the individual domains has a practical implication. The composite score showed a robust association, whereas several domains did not, which suggests that the legislative package matters more than any single law in isolation.( 12)
This is consistent with the safe system argument that road safety requires simultaneous action on multiple risk factors rather than a single priority intervention.( 6) Evaluations of cost-effective interventions in low- and middle-income countries reach the same conclusion, recommending bundled legislation together with enforcement.( 28)
At the population level, the implications are substantial even though the per-law association is modest. Road traffic mortality is a leading cause of death among young people, so a several-percent difference in the death rate corresponds to many preventable deaths in a single year.( 1)
The graded relationship observed across score categories suggests that the benefit is cumulative, with each additional law contributing to a safer legislative environment rather than any single law acting as a tipping point.( 12)
The association observed here has direct relevance for the global target to halve road traffic deaths by 2030, because it identifies legislative comprehensiveness as a measurable governance input that tracks mortality outcomes.( 5)
Regional analyses have likewise called for road traffic injury measurement to be aligned with road safety targets so that progress can be monitored over time.( 13) If the association is causal, then countries at the lower end of the legislative score have the largest room to reduce deaths by closing legislative gaps, and the score itself offers a simple instrument for tracking those gaps.
The strengths of this study include the global coverage of open data, the transparent complete-case definition of the exposure and the adjustment for the two main confounders. The use of best-practice criteria rather than the mere existence of a law captures the comprehensiveness to which the research question refers.
The figures follow the same logic: each pattern is anchored to its coefficient rather than presented as a visual impression, and the reproducibility of the analysis was verified by running it twice. The analysis also separates the association of the composite package from that of its components, which allows the findings to speak both to whole-package policy and to the prioritization of individual domains. The reliance on openly downloadable sources means that the study can be reproduced without access restrictions.
The road traffic death rate used here is a modelled estimate produced by the World Health Organization rather than a raw count, which improves comparability across countries but introduces uncertainty that is not reflected in the regression standard errors.( 2)
This measurement error in the outcome would not systematically bias the direction of the associations, but it may understate the true uncertainty. Studies that combine modelled death rates with administrative counts would help to bound this uncertainty.( 13)
The legislation indicators also carry measurement error that would tend to bias the associations toward the null. Each domain is collapsed to a binary criterion, which discards information about the quality of the law, its coverage of road types and engine types, and the penalties attached.( 2)
The complete-case restriction may further exclude countries with weaker data systems, which could attenuate the contrast between high- and low-performing countries. These sources of error make the observed adjusted association a conservative estimate of the underlying relationship.
The external validity of the findings is also limited by the countries that could be included, because the complete-case analytic sample may not represent every region of the world equally in its country composition.
The external validity of the findings is limited by the year of measurement. The legislative data refer to 2016 and 2017, and the relationship between legislation and mortality may have changed since then as vehicle fleets, urbanization and enforcement practices evolved.(37) The best-practice criteria nevertheless remain the reference standard used by the World Health Organization, and the open data allow the analysis to be repeated when the next round of the status report is released.(1) Replication across rounds would strengthen causal inference far more than any refinement of a single cross-section.
Future research should move from the static measurement of laws toward their implementation over time. Panel designs that track legislative changes and death rates within the same countries, together with enforcement and wearing-rate indicators, would address the confounding that limits the present cross-section.( 36)
Such designs could also test whether the sequence in which laws are adopted matters, for example whether speed management should precede other domains.( 6) The open data used here make this longitudinal extension feasible, because the same indicators are collected in each round of the status report.( 1)
From a governance perspective, the results connect road safety to the broader mobility agenda of transport policy. Legislation is a governance instrument that can be implemented independently of expensive infrastructure investment, which makes it especially relevant for low- and middle-income settings.( 28)
At the same time, the finding that income dominates the model cautions against expecting legislation alone to close the gap between rich and poor countries. The most plausible reading is that comprehensive legislation is a necessary component of a safe system that also requires enforcement, infrastructure and post-crash care.( 6)
The findings support road safety policies that adopt comprehensive legislative packages rather than isolated laws, with priority to speed limits of 50 km/h or less and to child restraint laws. For low- and middle-income countries, the results suggest that economic development is not sufficient and that legislative comprehensiveness should accompany income growth.( 28)
The direction of the associations is consistent with the goal of halving global road traffic deaths through targeted mitigation,( 5) and with regional calls to align road traffic injury measurement with road safety targets.( 13) Monitoring the comprehensiveness of national legislation should therefore remain a central indicator of road safety governance.
CONCLUSIONS
This study described the comprehensiveness of national road safety legislation across countries and showed that it varied from one to five of the five recommended laws. Countries with more comprehensive legislation had lower road traffic death rates in the unadjusted analysis. The association persisted after adjustment for income and motorization, although income absorbed a substantial part of it.
Speed limits of 50 km/h or less and child restraint laws showed the clearest independent associations, whereas the drink-driving and helmet criteria did not. The findings support the adoption of comprehensive legislative packages as a complement to economic development, while the cross-sectional design limits causal interpretation.
References
- 1 World Health Organization. Global status report on road safety 2023 [Internet]. 2023. Available from: https://iris.who.int/handle/10665/379826
- 2 World Health Organization. Global status report on road safety 2018 [Internet]. 2018. Available from: https://iris.who.int/handle/10665/276462
- 3 van der Lubbe SCC, Moberg ME, Aluquin D, Zhou Y, Lenox H, Abdullah, et al. Global, regional, and national burden of road injuries 1990–2023: a systematic analysis for the Global Burden of Disease Study 2023. The Lancet Public Health. 2026;11(9):e589-e603. doi: 10.1016/s2468-2667(26)00141-6
- 4 Khayesi M, Iaych K. Second downward trend in global road traffic deaths. Inj Prev. 2025;31(Suppl 1):i17-i23. doi: 10.1136/ip-2024-045487
- 5 Zou S, Lv F, Qian Y, Han C, Zhu J. Halving global road traffic deaths through targeted mitigation practices by 2050. Sci Rep. 2026;16(1):16850. doi: 10.1038/s41598-026-42076-z
- 6 Yannis G, Michelaraki E. Review of City-Wide 30 km/h Speed Limit Benefits in Europe. Sustainability. 2024;16(11):4382. doi: 10.3390/su16114382
- 7 Jimenez Chavez CL, Peltier MR, Mokwuah AA, Bin-Mahfouz A, Verplaetse TL, Zakiniaeiz Y, et al. Legal blood alcohol concentration limits and alcohol-attributable traffic mortality rates: an analysis across 165 countries. eClinicalMedicine. 2026;93:103794. doi: 10.1016/j.eclinm.2026.103794
- 8 Rehm J, Manthey J, Lange S, Badaras R, Zurlyte I, Passmore J, et al. Alcohol control policy and changes in alcohol‐related traffic harm. Addiction. 2020;115(4):655-665. doi: 10.1111/add.14796
- 9 Lepard JR, Spagiari R, Corley J, Barthélemy EJ, Kim E, Patterson R, et al. Differences in outcomes of mandatory motorcycle helmet legislation by country income level: A systematic review and meta-analysis. PLoS Med. 2021;18(9):e1003795. doi: 10.1371/journal.pmed.1003795
- 10 Al-Awad MA, Kharbeche M, Tarlochan F. Evaluating child restraint system (CRS) adoption and policy interventions worldwide: a review. IATSS Research. 2025;49(3):362-373. doi: 10.1016/j.iatssr.2025.09.003
- 11 Solmazer G, Üzümcüoğlu Y, Özkan T. The role of traffic law enforcements in the relationship between cultural variables and traffic fatality rates across some countries of the world. Transportation Research Part F: Traffic Psychology and Behaviour. 2016;38:137-150. doi: 10.1016/j.trf.2016.01.001
- 12 Rosen HE, Bari I, Paichadze N, Peden M, Khayesi M, Monclús J, et al. Global road safety 2010–18: An analysis of Global Status Reports. Injury. 2025;56(6):110266. doi: 10.1016/j.injury.2022.07.030
- 13 Soori H, Razzaghi A. Advancing road traffic injury measures in the WANA region towards road safety specific SDGs. International Journal of Injury Control and Safety Promotion. 2025;32(1):3-11. doi: 10.1080/17457300.2024.2440936
- 14 Grillo R, de Oliveira NK, Zindel Deboni MC. The impact of traffic legislation on maxillofacial trauma: A global retrospective review. Journal of Cranio-Maxillofacial Surgery. 2026;54(2):104402. doi: 10.1016/j.jcms.2025.11.005
- 15 Xu T, Wu B, Mao Y, Zhang L. Why is the difference so large in road death rates among countries. Transportation Engineering. 2024;16:100229. doi: 10.1016/j.treng.2024.100229
- 16 Eun SJ. Effects of stricter drunk-driving laws on alcohol-related road traffic death, injury, and crash rates in South Korea: A synthetic counterfactual approach using Bayesian structural time-series models. Accident Analysis & Prevention. 2021;163:106455. doi: 10.1016/j.aap.2021.106455
- 17 World Bank. World Development Indicators [Internet]. 2026. Available from: https://data.worldbank.org/indicator/SH.STA.TRAF.P5
- 18 Our World in Data. Registered vehicles per 1,000 people [Internet]. 2025. Available from: https://ourworldindata.org/grapher/registered-vehicles-per-1000-people
- 19 World Health Organization. Road Safety Indicators, Global Health Observatory [Internet]. 2018. Available from: https://data.humdata.org/api/3/action/resource_search?query=name:Road%20Safety%20Indicators
- 20 Law TH, Ng CP, Wang M, Wang Y, Deng T, He S, et al. Economic development and the shifting distribution of road traffic fatalities between children and older adults: Evidence from a global panel. Journal of Safety Research. 2026;98:443-454. doi: 10.1016/j.jsr.2026.08.006
- 21 Al-Mahamid H, Torok A. Road and social safety in Europe: how economic growth and regional dynamics shape mortality trends. Eur Transp Res Rev. 2026;18(1):4. doi: 10.1186/s12544-025-00751-8
- 22 Ngoc AM, Minh CC, Nhu NT, Nishiuchi H, Huynh N. Influence of the human development index, motorcycle growth and policy intervention on road traffic fatalities – A case study of Vietnam. International Journal of Transportation Science and Technology. 2023;12(4):925-936. doi: 10.1016/j.ijtst.2022.09.004
- 23 Lee HG, Kim JH. Impact of lowering the maximum speed limit of city roads on pedestrian traffic accident patients: A nationwide before-and-after study. PLoS One. 2025;20(6):e0325320. doi: 10.1371/journal.pone.0325320
- 24 Semple T, Fountas G. Twelve years of evidence: modelling the injury severity of single-vehicle collisions pre- and post-20mph (32 km/h) implementation in Edinburgh and Glasgow. Accident Analysis & Prevention. 2025;221:108183. doi: 10.1016/j.aap.2025.108183
- 25 Shanthosh J, Rogers K, Lung T, Brown J, Ivers R, Wilson A, et al. Effectiveness of child restraint legislation to reduce motor vehicle related serious injuries and fatalities: A national interrupted time series analysis. Accident Analysis & Prevention. 2020;142:105553. doi: 10.1016/j.aap.2020.105553
- 26 Abdulazeez MU, Abdullahi AS, Koppel S, Alao D, Abdullah K. Association between the United Arab Emirates child safety seat and mandatory seatbelt legislation and child passenger injuries and fatalities. Front Public Health. 2026;14:1846288. doi: 10.3389/fpubh.2026.1846288
- 27 Bhaumik S, Hunter K, Matzopoulos R, Prinsloo M, Ivers RQ, Peden M. Facilitators and barriers to child restraint use in motor vehicles: a qualitative evidence synthesis. Inj Prev. 2020;26(5):478-493. doi: 10.1136/injuryprev-2020-043655
- 28 Banstola A, Mytton J. Cost-effectiveness of interventions to prevent road traffic injuries in low- and middle-income countries: A literature review. Traffic Injury Prevention. 2017;18(4):357-362. doi: 10.1080/15389588.2016.1212165
- 29 Fei G, Li X, Sun Q, Qian Y, Stallones L, Xiang H, et al. Effectiveness of implementing the criminal administrative punishment law of drunk driving in China: An interrupted time series analysis, 2004-2017. Accident Analysis & Prevention. 2020;144:105670. doi: 10.1016/j.aap.2020.105670
- 30 Acat O, İmre O, Ulusal O, Çağlar S, Kara F. Alcohol-related fatal-and-injury traffic crashes in Türkiye (2015–2024): temporal trends and an ecological evaluation of alcohol control policies. BMC Public Health. 2026;26(1):2120. doi: 10.1186/s12889-026-27792-5
- 31 Ramasco A. Not a Sip: Effects of Zero Tolerance Laws on Road Traffic Fatalities. Health Economics. 2026;35(2):377-393. doi: 10.1002/hec.70056
- 32 Abdi N, Robertson T, Petrucka P, Crizzle AM. Do motorcycle helmets reduce road traffic injuries, hospitalizations and mortalities in low and lower-middle income countries in Africa? A systematic review and meta-analysis. BMC Public Health. 2022;22(1):824. doi: 10.1186/s12889-022-13138-4
- 33 Olson Z, Staples JA, Mock C, Nguyen NP, Bachani AM, Nugent R, et al. Helmet regulation in Vietnam: impact on health, equity and medical impoverishment. Inj Prev. 2016;22(4):233-238. doi: 10.1136/injuryprev-2015-041650
- 34 Ha NT, Ederer D, Vo VAH, Pham AV, Mounts A, Nolen LD, et al. Changes in motorcycle-related injuries and deaths after mandatory motorcycle helmet law in a district of Vietnam. Traffic Injury Prevention. 2018;19(1):75-80. doi: 10.1080/15389588.2017.1322203
- 35 Jokūbaitytė E, Casas Martínez G, Seguí-Gómez M. Missed prevention: global gaps in seat belt policy, monitoring, and road traffic mortality. Traffic Injury Prevention. 2026;27(sup1):S120-S130. doi: 10.1080/15389588.2026.2702029
- 36 Lourens A, Sinclair M, Willems B, Young T. Education, incentive, and engineering-based interventions to promote the use of seat belts. Cochrane Database of Systematic Reviews. 2024;2024(1):CD011218. doi: 10.1002/14651858.cd011218.pub2
- 37 Haddak MM, Havet N, Hayou B, Ganame A, Penot A. Changes in road traffic fatalities in France over a decade: Disentangling exposure and fatality risk. IATSS Research. 2026;50(3):1182-1192. doi: 10.1016/j.iatssr.2026.09.007
- 38 Muzondo PJ, Matowanyika K, Chipangamate N. The role of government policy in reducing road carnage: evidence from Zimbabwe’s public passenger transport sector. Transportation Research Interdisciplinary Perspectives. 2026;37:101929. doi: 10.1016/j.trip.2026.101929
Declarations
Funding
No financing
Conflict of interest
None
Authorship contributions
Drafting – original draft: Libardo Ramón Polanía, Ana Paulina Alfaro Rodríguez, Yasniel Sánchez Suárez.
Writing–review and editing: Libardo Ramón Polanía, Ana Paulina Alfaro Rodríguez, Yasniel Sánchez Suárez.