

Abstract
Introduction: The population aged 65 years and older is growing in the United States, yet updated nationally representative evidence on how trip frequency, mode use and driving cessation vary with age, health limitation and residence is sparse. Methods: Cross-sectional secondary analysis of the 2022 NextGen National Household Travel Survey. Weighted means and proportions and negative binomial and logistic regressions with cluster-robust 95% confidence intervals were estimated for persons aged 65 years and older. Results: The sample comprised 4,329 persons representing 54.5 million adults. They made a mean of 1.81 daily person trips, falling from 2.00 at ages 65 to 74 to 1.05 at ages 85 and older. A travel-limiting health condition affected 15.0% and was associated with a lower trip rate (incidence rate ratio 0.64; 95% CI 0.54 to 0.75). Driving accounted for 72.6% of trips and passenger travel for 18.8%. Non-driver status rose from 7.0% at ages 65 to 74 to 40.6% at ages 85 and older and reached 41.9% among adults with a health limitation. Conclusions: Trip frequency falls and non-driver status rises steeply with age and health limitation, while driving gives way to passenger travel. These gradients identify the groups for which transport services beyond the private car are most needed.
Keywords
aged, travel, automobile driving, transportation, rural population, health surveys
INTRODUCTION
The United States is ageing rapidly. The youngest members of the baby boom cohort reached age 65 during the 2010s, and that large generation now dominates the older adult population.( 1,2)
The ageing of the population changes what a national transport system must deliver, because mobility in later life conditions access to health care, food, social contact and, in turn, physical and mental well-being.( 3,4)
Travel-related barriers already limit access to medical care for millions of adults, and the burden falls unevenly across the population.( 5)
When driving stops, out-of-home activity contracts and depressive symptoms often increase.( 6,7) For transport planners and ageing-services agencies, the practical question is therefore not whether older adults will need alternatives to the private car, but which subgroups need them first and in what form.
The National Household Travel Survey (NHTS) has documented these patterns across successive cycles. Adults aged 65 years and older make fewer daily trips than working-age adults, travel shorter distances and depend on the private car for most journeys, and their trips concentrate in shopping, errands and social purposes rather than in commuting.( 8,9)
Trip generation declines further with a self-reported medical condition,( 10) is lower among women than among men,( 11) and differs between rural and urban residence.( 12)
Residential context shapes destination access and the number of trips actually made.( 13) The geography of the built environment matters as much as demography: neighborhood walkability, income and green cover are all associated with whether older adults walk or stay home.( 14,15)
Driving reduction and cessation, the most consequential change in later-life mobility, is gradual and self-regulated long before it becomes complete.( 16,17)
The drivers who remain in later life keep a strong symbolic attachment to the car and to the independence it represents,( 18) which is why the transition away from driving is so often delayed and then abrupt.( 19)
Most of this evidence predates the COVID-19 pandemic and rests on the 2001 and 2017 survey cycles. The pandemic temporarily reduced travel for all age groups and changed the activity patterns of older adults in particular.( 20)
The 2022 NextGen NHTS is the first post-pandemic national travel diary, yet few analyses have examined it jointly across age group, health limitation and urban or rural residence within a single framework that covers trip frequency, mode use and driving cessation.
This joint view matters in practice: a planner deciding where to concentrate demand-responsive transit needs to know whether the binding constraint is age, health or geography, and how the three interact. The question also matters for the design of future cohorts, because the baby boom generation travels differently from the cohorts that preceded it.( 1)
Driving cessation in particular deserves fresh national estimates, because most quantitative syntheses of the phenomenon draw on studies conducted before 2020,( 21,22) and the post-pandemic balance between in-person activities and alternatives such as telemedicine and home delivery may have changed the consequences of not driving.
The objective of this study was to quantify trip frequency, mode use and driving cessation among adults aged 65 years and older in the 2022 National Household Travel Survey and to compare them by age group, health limitation and urban or rural residence. The analysis treats these three outcomes as points along a single continuum of later-life mobility, from reduced trip making to the loss of the ability to drive.
METHODS
This was a cross-sectional secondary analysis of the 2022 NextGen National Household Travel Survey, a nationally representative 24-hour travel diary of the civilian noninstitutionalized population of the United States. The survey used a one-stage address-based sampling design and was fielded from January 2022 to January 2023, with travel days assigned across all seven days of the week over the thirteen-month field period.( 23)
Household members aged 5 years and older completed a diary for an assigned travel day that ran from 4:00 a.m. to 4:00 a.m., recording every trip, its mode, purpose and duration. Public-use household, person and trip files in CSV format were downloaded from the survey portal.( 24) Reporting followed the STROBE statement for observational studies.
The public-use person file records 16,997 persons from 7,893 households, weighted to national control totals derived from the American Community Survey. The trip file records 31,074 person trips. Because a person appears in the trip file only when at least one trip was made, the person file captures the full sample including persons with zero trips on the travel day.
The analysis sample comprised all persons aged 65 years and older in the person file with a usable person weight, which yielded 4,329 persons. The three files were merged on the household and person identifiers before analysis.
Trip-level records were linked to the person file to assign age, sex, health limitation and residential area to each trip, and the household-level urban or rural classification was carried on every record. Values coded as refused, do not know or not ascertained were retained as distinct categories for descriptive reporting and excluded only from the models that required the affected variable. The analysis script reads the raw public-use CSV files and reproduces every estimate from them, so the results can be regenerated by rerunning the script.
Trip frequency was the count of person trips on the travel day recorded in the person file, which includes persons with no trips. The measure is interpreted as trips per person per travel day rather than as a multi-day average. Mode use was derived from the trip-level mode variable and grouped into five mutually exclusive categories: private vehicle driver, private vehicle passenger, walk, transit, and other modes.
The driver and passenger categories were assigned from the household-vehicle driver and passenger flags for car, van, sport utility vehicle and pickup truck trips; transit combined public and commuter bus, streetcar, subway, commuter rail, Amtrak and paratransit; and other modes combined bicycle, motorcycle, recreational vehicle, airplane, taxi, ride-hailing, e-scooter and unspecified modes.
Driving cessation was measured in two complementary ways. Non-driver status was defined as reporting not being a driver, and health-related cessation was defined as selecting the reason "given up driving due to condition or disability" among persons who reported a condition or disability that makes travel difficult. Age group was classified as 65 to 74, 75 to 84, or 85 years and older.
The three-category split separates the young old, who largely resemble working-age adults in their travel, from the old old, among whom driving cessation and health limitation become common, and allows a direct comparison with the age bands used in previous NHTS analyses. Health limitation was a self-reported condition or disability that makes travel difficult, treated as a binary indicator; the small number of persons who refused, did not know or had no ascertained response was excluded from analyses that required the variable and is reported separately. Residential area was the household urban or rural classification based on 2020 census geography. Covariates were sex, recorded as reported by the respondent, and worker status during the reference period.
Person-level estimates used the national person weight, and trip-level mode shares used the annualized national trip weight. The person weight sums to the civilian noninstitutionalized population aged 5 years and older, and the trip weight sums to the national annualized person-trip total. Mode shares were computed as the ratio of weighted trips in each mode group to the weighted total of trips made by persons aged 65 years and older.
Because the survey clusters persons within households and stratification reflects the sampling design, all confidence intervals were estimated with cluster-robust standard errors on the household identifier; this yields design-based inference without requiring the full replicate-weight structure. Weighted means and weighted proportions were reported with 95% confidence intervals.
Daily trip frequency, a non-negative count with overdispersion relative to the Poisson distribution, was compared across age group, sex, health limitation, worker status and residential area with negative binomial regression, reported as incidence rate ratios. Non-driver status was modelled with logistic regression, reported as odds ratios. Both models included age group, sex, health limitation, worker status and residential area simultaneously, so each estimate is adjusted for the others.
Estimates for health limitation were computed among persons with a valid response, and the remaining covariates entered the models as indicator variables. Analyses were two-sided with alpha of 0.05.
RESULTS
Study population
The analysis sample comprised 4,329 persons aged 65 years and older, representing 54.5 million adults (Table 1). Women accounted for 52.3% of the weighted sample, and 76.1% lived in urban areas. A condition or disability that makes travel difficult was reported by 15.0% of adults, and 18.3% were workers. Non-drivers made up 11.8% of the sample, and 36.6% recorded no trips on the travel day.
The share with a health limitation rose from 10.0% at ages 65 to 74 to 45.9% at ages 85 and older, while the share of workers fell from 24.8% to 7.7%. Urban residence increased with age, from 75.1% at ages 65 to 74 to 80.7% at ages 85 and older, and the female share rose from 51.7% to 54.5%.
Characteristic | 65-74 years (n = 2866) | 75-84 years (n = 1186) | 85 years and older (n = 277) | Total (n = 4329) |
|---|---|---|---|---|
Weighted population (millions) | 33.3 | 17.0 | 4.1 | 54.5 |
Female (%) | 51.7 | 53.1 | 54.5 | 52.3 |
Urban residence (%) | 75.1 | 76.8 | 80.7 | 76.1 |
Rural residence (%) | 24.9 | 23.2 | 19.3 | 23.9 |
Health limitation (%) | 10.0 | 17.6 | 45.9 | 15.0 |
Worker (%) | 24.8 | 8.0 | 7.7 | 18.3 |
Non-driver (%) | 7.0 | 14.2 | 40.6 | 11.8 |
Zero trips on travel day (%) | 32.3 | 40.4 | 55.5 | 36.6 |
Note: Percentages are weighted survey estimates. Health limitation refers to a condition or disability that makes travel difficult; the estimate is computed among persons with a valid response.
Trip frequency
Adults aged 65 years and older made a mean of 1.81 daily person trips (95% CI 1.71 to 1.91). Frequency fell from 2.00 trips at ages 65 to 74 to 1.05 at ages 85 and older. Relative to ages 65 to 74, the trip rate was 0.86 for ages 75 to 84 (95% CI 0.78 to 0.96; p = 0.005) and 0.62 for ages 85 and older (95% CI 0.49 to 0.78; p < 0.001). Adults with a health limitation made 1.11 trips per day compared with 1.92 among those without, for a rate ratio of 0.64 (95% CI 0.54 to 0.75; p < 0.001).
Rural residents made 1.68 trips and urban residents 1.85. The difference did not reach significance after adjustment (rate ratio 0.88; 95% CI 0.75 to 1.02; p = 0.094). Women made fewer trips than men (rate ratio 0.89; 95% CI 0.81 to 0.98; p = 0.020), and workers made more trips than non-workers (rate ratio 1.29; 95% CI 1.11 to 1.50; p = 0.001). The share with a zero-trip day increased from 32.3% at ages 65 to 74 to 55.5% at ages 85 and older, and was higher in rural than in urban areas (39.9% versus 35.5%). Among adults who made at least one trip, the mean was 2.85 trips (95% CI 2.74 to 2.97).
Mode use
The private car dominated later-life travel (Table 2). Driving accounted for 72.6% of trips by older adults and riding as a passenger for 18.8%; walking made up 6.8% and transit 0.8%. The driver share fell with age, from 75.6% at ages 65 to 74 to 57.9% at ages 85 and older, while the passenger share rose from 16.9% to 30.3%. Walking rose modestly with age, from 5.9% at ages 65 to 74 to 8.2% at ages 85 and older, whereas transit fell from 0.9% to 0.1%. Health limitation shifted mode use more than age did.
Among adults with a travel-limiting condition, 48.9% of trips were as driver and 34.3% as passenger, compared with 74.8% and 17.3% among those without a condition. Walking and transit were both more common among adults with a condition (9.1% and 3.2%) than among those without (6.6% and 0.5%). By residence, walking reached 7.3% in urban areas and 5.1% in rural areas, and transit reached 0.8% and 0.5%.
Measure | Total | 65-74 years | 75-84 years | 85 years and older | Urban | Rural |
|---|---|---|---|---|---|---|
Daily person trips (mean) | 1.8 | 2.0 | 1.6 | 1.0 | 1.8 | 1.7 |
Daily person trips (95% CI) | 1.71-1.91 | 1.87-2.13 | 1.48-1.76 | 0.81-1.29 | 1.75-1.95 | 1.42-1.95 |
Private vehicle driver (%) | 72.6 | 75.6 | 67.5 | 57.9 | 72.5 | 72.9 |
Private vehicle passenger (%) | 18.8 | 16.9 | 21.5 | 30.3 | 18.3 | 20.5 |
Walk (%) | 6.8 | 5.9 | 8.8 | 8.2 | 7.3 | 5.1 |
Transit (%) | 0.8 | 0.9 | 0.6 | 0.1 | 0.8 | 0.5 |
Other modes (%) | 1.1 | 0.7 | 1.6 | 3.5 | 1.1 | 1.1 |
Note: Mode shares are weighted percentages of annualized person trips made by persons aged 65 years and older. CI = confidence interval.
Driving cessation
Non-driver status rose steeply with age (Figure 1). Overall, 11.8% of adults aged 65 years and older were non-drivers (95% CI 10.2% to 13.4%). The figure displays the urban and rural gradient of non-driver prevalence across the three age groups. The prevalence was 7.0% at ages 65 to 74, 14.2% at ages 75 to 84 and 40.6% at ages 85 and older. In the adjusted model, the odds of being a non-driver were 1.59 times higher at ages 75 to 84 (95% CI 1.00 to 2.51; p = 0.050) and 5.51 times higher at ages 85 and older (95% CI 3.34 to 9.08; p < 0.001) than at ages 65 to 74.
Health limitation was associated with the highest odds: 7.65 times higher among adults with a travel-limiting condition (95% CI 5.15 to 11.37; p < 0.001), and non-driver prevalence reached 41.9% in this group versus 6.9% without. Rural residence was associated with lower odds of being a non-driver (odds ratio 0.66; 95% CI 0.44 to 0.99; p = 0.047), and non-driver prevalence was 12.7% in urban areas versus 8.8% in rural areas. The odds of being a non-driver were 2.53 times higher for women than for men (95% CI 1.65 to 3.86; p < 0.001). Among adults with a travel-limiting condition, 32.9% (95% CI 27.3% to 38.6%) reported having given up driving due to the condition, rising from 20.1% at ages 65 to 74 to 53.2% at ages 85 and older.
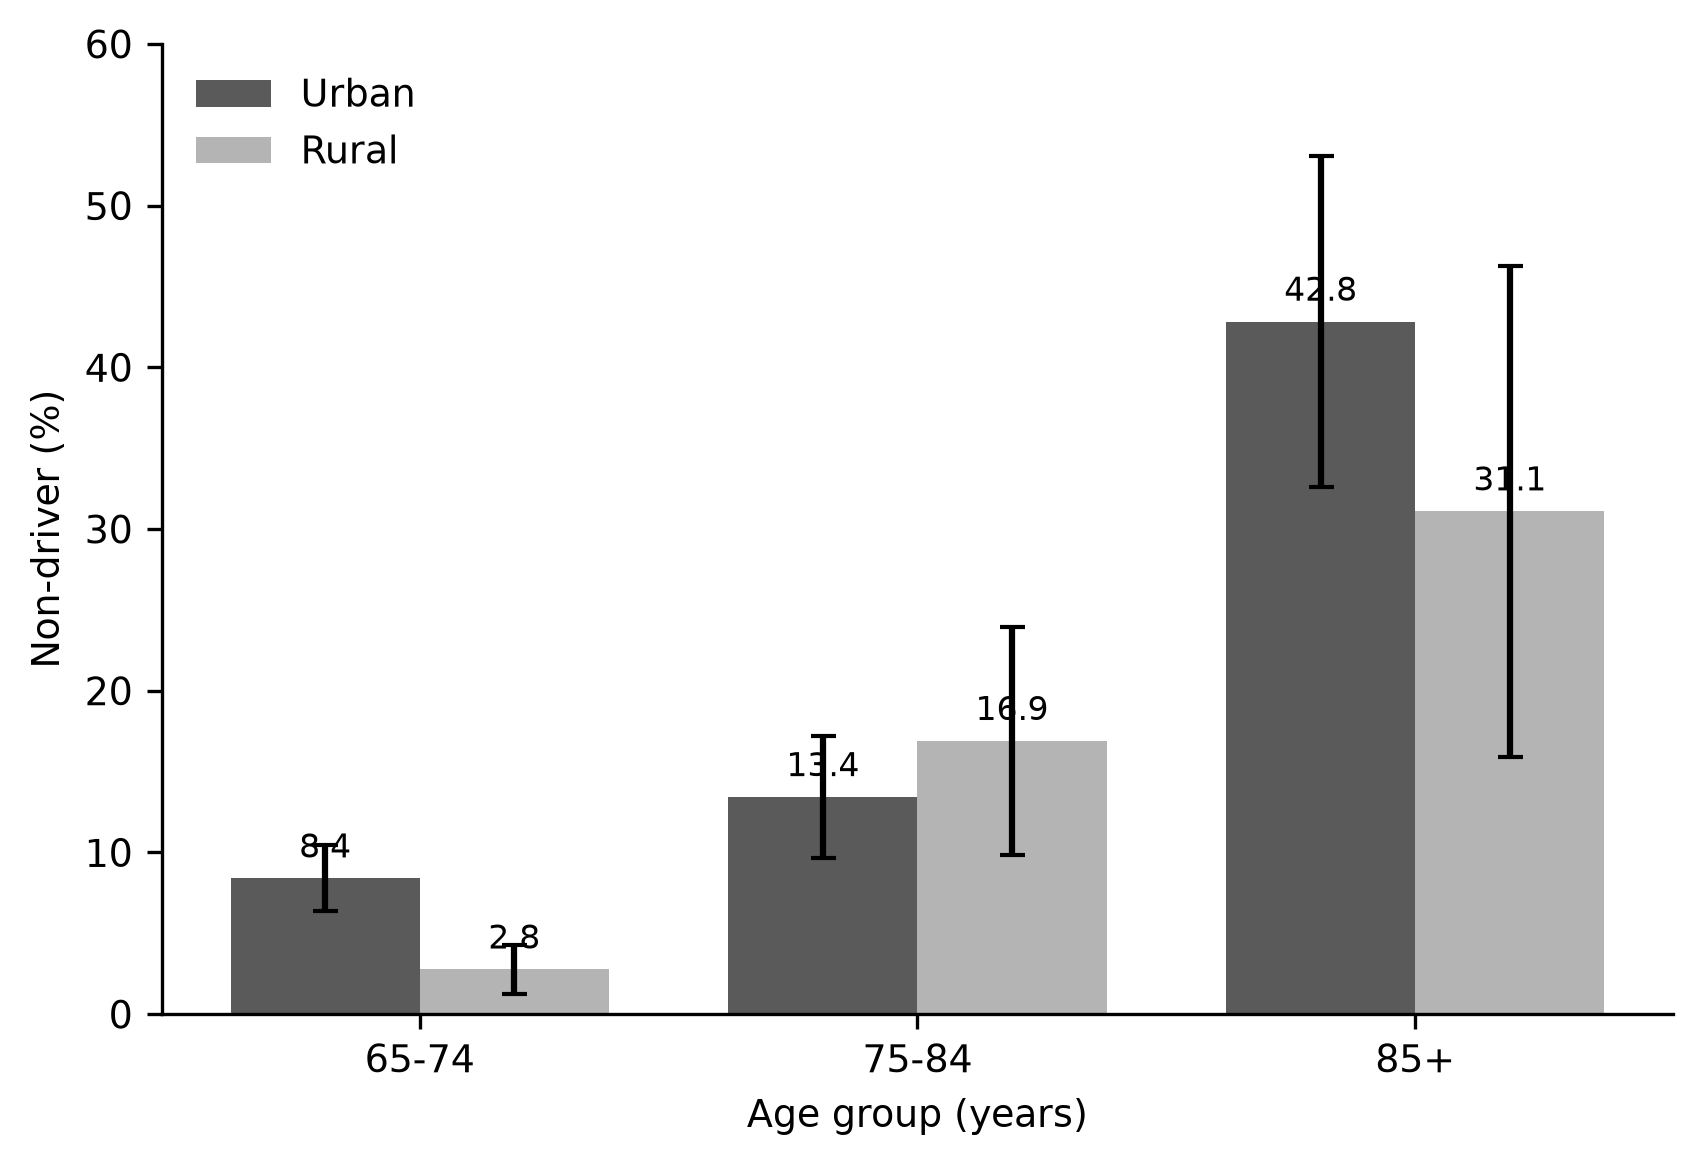
Figure 1. Non-driver prevalence among adults aged 65 years and older by age group and residential area.
DISCUSSION
In practice, these results identify two groups whose transport needs outpace the private car: the oldest old, and older adults whose health limits travel. Both groups make fewer daily trips, ride as passengers more often and stop driving at far higher rates than their younger and healthier counterparts. The main finding is that age and health limitation, rather than urban or rural residence, drive the gradient in later-life mobility, and that the two sharpen each other after age 85.
The trip-frequency estimates are consistent with previous NHTS-based work. Analyses of the 2001 to 2017 cycles reported that older adults made fewer daily trips than working-age adults and that trip making declined with age, with the steepest fall among the oldest groups.( 8,9)
The mean of 1.81 daily person trips observed here is lower than the pre-pandemic values reported for comparable groups, which is expected given the recovery of travel after 2020 and the ageing of the sample.( 9)
International comparisons point in the same direction: Swiss GPS data show that trip frequency and daily travel time decline monotonically with age,( 25) and a latent-demand framework applied to Chinese cities found the largest unmet travel demand among the oldest adults.( 26)
The health gradient also replicates earlier NHTS evidence that medical conditions reduce daily travel,( 10) here with a rate ratio of 0.64, which is larger than the age gradient between 65 and 74 and 75 to 84. Worker status operated in the expected direction, with workers making 1.29 times as many trips as non-workers, a reminder that part of the age decline in trip making is an employment effect rather than a purely physiological one.
The sensitivity analysis separates these margins: among adults who left home at least once, the mean rose to 2.85 trips, which shows that the zero-trip day, more than a reduction in trips per active day, drives the age decline. This distinction matters for service design, because an adult who never leaves home needs a different intervention from one who leaves home but makes few trips.
The mode-use findings describe a system that remains organized around the private car. The driver share of 72.6% and the passenger share of 18.8% are consistent with the car dependence documented for older Americans.( 8,27)
The shift from driver to passenger with age, and the much stronger shift associated with health limitation, has been described in car-dependent settings where older men and women compensate for reduced driving by riding with others.( 28,29)
In Japan, driving status separates older adults in their social participation more than residential density does.( 30) The finding that transit accounted for less than one percent of trips overall, and for 3.2% of trips even among adults with a travel-limiting condition, matches qualitative evidence that older adults withdraw from transit when it becomes physically or psychologically difficult.( 31,32)
This stands in contrast with settings where concessionary fares sustain higher transit use among older and disabled riders,( 33) which suggests that the low United States share reflects supply and fare policy rather than preference alone. For practitioners, this implies that expanding fixed-route transit alone will not reach most of the population identified here; the binding constraint is the first and last connection to the car.
The overall picture aligns with the broader literature that links the built and social environments to mobility and well-being in later life.( 34) Where older adults live determines the destinations they can reach and therefore the trips they take,( 13) and mode choice responds to the socioeconomic and built-environment context of the region in which they live.( 27)
Walking and the built environment deserve a separate reading. The walk share of 6.8% overall, higher in urban than in rural areas, is consistent with studies that tie older adults' walking to neighborhood walkability, income and the availability of destinations rather than to age alone.( 14,15)
Public transit stop density has also been associated with walking for exercise in a national sample of older adults,( 35) which suggests that the built environment can partially offset the decline in out-of-home activity documented here.
Ride-hailing adds a further layer: it was adopted by a measurable share of older adults before the pandemic,( 36) and it serves adults with disabilities alongside conventional taxis.( 37) The near-zero transit share reported here does not mean older adults reject shared mobility; it means the services they currently reach are organized around the car. Caregivers absorb much of the resulting gap, a burden concentrated in an ageing America.( 38)
Driving cessation followed the expected age curve and its health-related component was substantial. Non-driver prevalence of 11.8% overall and 40.6% at ages 85 and older is consistent with longitudinal evidence that driving cessation accelerates in late old age.( 17,22)
The odds ratio of 7.65 for health limitation exceeds the age gradient, which agrees with reviews showing that functional and medical decline, more than age itself, precipitates driving reduction and cessation.( 16,21)
The finding that 32.9% of adults with a travel-limiting condition reported having given up driving due to the condition, reaching 53.2% at ages 85 and older, aligns with studies of the transition to driving cessation in which older adults stop before they feel ready and often lack a planned alternative.( 19,39)
Driving cessation carries measurable consequences for mental health and social isolation,( 6,7) which makes the two high-risk groups identified here a priority for support.
State licensing policies also shape when and how much older adults drive: license renewal requirements are associated with daily driving among older Americans,( 40) and older-driver crash involvement has continued to decline even as the older population has grown.( 41)
Concessionary transit fares improve the well-being of older and disabled riders where they exist,(33) and environments that support mobility in later life are consistently linked to better well-being.(34)
These findings together imply that the decision to stop driving is not only a medical event; it is shaped by policy, by the availability of alternatives and by the meaning people attach to the car.
The mechanisms behind these gradients are likely to combine physical, cognitive and social processes. Declining vision, slower reaction times and reduced nighttime confidence narrow the situations in which a person feels able to drive, which is why self-regulation, the voluntary avoidance of difficult driving conditions, precedes cessation and why the transition is often gradual rather than sudden.( 16,17)
Medical events such as stroke, falls and dementia accelerate the process, and older adults with early-stage dementia often stop driving before any formal assessment.( 39) When alternatives are scarce, the same health events convert directly into fewer trips, because a person who cannot drive in a car-dependent area has no low-cost substitute.( 4,12)
The social meaning of driving then interacts with these constraints: older adults who define themselves as drivers delay planning for cessation, which makes the eventual transition more disruptive.( 18,19)
For the purpose of intervention, this sequence suggests three points of entry: support before cessation, alternatives at the moment of cessation, and social reintegration afterward.
Several differences by residence and sex deserve attention. Rural residents were less likely to be non-drivers and walked less than urban residents, a pattern consistent with the longer distances and weaker transit alternatives of rural areas.( 12,27)
The rural trip-frequency difference was small and not significant after adjustment, echoing evidence that rural older adults do not take fewer trips than their urban counterparts when a ride is available.( 12)
Women had higher odds of non-driver status and slightly lower trip frequency, which reproduces the gender gap in later-life mobility documented in earlier NHTS cycles.( 11)
Cohort effects also matter: the baby boom generation travels more than the silent generation did at the same ages,( 1,2) so future cohorts may retain driving longer and postpone the patterns described here.
Taken together, the three outcomes describe a predictable sequence rather than three separate problems. Trip frequency declines first and most gently; mode shift from driver to passenger follows as health and age advance; and driving cessation, the endpoint of the sequence, concentrates in the oldest and least healthy groups.
The practical value of quantifying all three in one national frame is that agencies can position services along this sequence. A paratransit provider planning capacity, for instance, needs the passenger-share gradient by health limitation more than it needs the aggregate trip count. A licensing authority weighing in-person renewal requirements needs the non-driver gradient by age and health more than it needs mode shares. Each gradient points to a different decision, and each decision has a different owner, which is the reason for reporting them side by side.
The study has strengths and limitations that bear on interpretation. The 2022 NextGen NHTS is the only national post-pandemic travel diary, and its person and trip weights allow nationally representative statements about the civilian population aged 65 years and older; the use of cluster-robust inference also respects the household-level design.
Against this, the survey measures a single travel day per person, which captures between-person variation in trip frequency but not within-person variation across the week; analyses that pool several diary days per respondent would reduce this noise and are recommended for future work. Health limitation is self-reported and does not distinguish the type or severity of the condition, so the health gradient should be read as the association of perceived travel difficulty rather than of specific diagnoses; linkage to administrative health records would sharpen this estimate.
The trip diary undercounts short and non-motorized trips relative to instrumented observation, which may bias the walking share downward; wearable or smartphone-based validation is recommended. Driving cessation is measured cross-sectionally, so the sequence between health decline and stopping driving cannot be established from these data alone; longitudinal panels that follow drivers through the cessation transition are recommended.
Finally, the sample of adults aged 85 and older is small in unweighted terms, which widens confidence intervals for the oldest group; oversampling the oldest old in future cycles is recommended. The analysis also treats residence as a two-category urban or rural indicator, which may mask gradients within metropolitan areas, where suburban environments differ from dense cores in ways that matter for walking and transit; finer geographic strata in future work are recommended.
Residual confounding is possible because education, income and household composition were not included in the models, and these characteristics correlate with both driving and trip making; household-level socioeconomic adjustment is recommended.
For practitioners, the implications are concrete. Ageing-services agencies should target driving-cessation support and volunteer ride programs at adults aged 75 years and older who report a travel-limiting condition, because this is the group in which passenger dependence rises most quickly. Transit agencies should design door-through-door and demand-responsive services rather than fixed routes alone, given that transit captures less than one percent of older adults' trips.
Rural mobility managers should prioritize rides for health care and errands over walkability investments, because walking plays a smaller role in rural areas. Health systems should screen for driving cessation in the same way they screen for falls, since the health-related component of cessation is large and consequential for mental health.
Licensing authorities should pair renewal procedures with referrals to mobility counselling, so that the administrative moment of licence renewal becomes a point of entry into alternatives rather than a cliff. Planners monitoring equity should track the passenger-share and non-driver gradients over time, because these two indicators capture the moment at which the private car stops meeting an older adult's needs. This implies that the most efficient use of transport resources is not a single programme for all older adults, but a sequence of services matched to the age and health gradients documented here.
CONCLUSIONS
Trip frequency among adults aged 65 years and older declined with age and with a travel-limiting health condition, while mode use remained organized around the private car: the driver share fell and the passenger share rose with age and with health limitation, and walking and transit stayed as minor shares that differed little by residence. Driving cessation rose steeply with age and was most strongly associated with health limitation, with the largest burden among adults aged 85 years and older and among those whose condition makes travel difficult.
For practitioners, the gradient points to a sequence rather than a single intervention: driving-cessation support and volunteer ride programmes for adults aged 75 years and older with a travel-limiting condition, door-through-door and demand-responsive transit for the connections that fixed routes do not serve, and health-system screening for driving cessation alongside screening for falls.
References
- 1 Li S. How do baby boomers travel differently from the silent generation?. Transportation. 2025;52(1):1-28. doi: 10.1007/s11116-023-10410-3
- 2 Zhang M, Li Y. Generational travel patterns in the United States: New insights from eight national travel surveys. Transportation Research Part A: Policy and Practice. 2022;156:1-13. doi: 10.1016/j.tra.2021.12.002
- 3 Ravulaparthy S, Yoon SY, Goulias KG. Linking Elderly Transport Mobility and Subjective Well-Being. Transportation Research Record: Journal of the Transportation Research Board. 2013;2382(1):28-36. doi: 10.3141/2382-04
- 4 Haustein S, Siren A. Seniors’ unmet mobility needs – how important is a driving licence?. Journal of Transport Geography. 2014;41:45-52. doi: 10.1016/j.jtrangeo.2014.08.001
- 5 Labban M, Chen CR, Frego N, Nguyen DD, Lipsitz SR, Reich AJ, et al. Disparities in Travel-Related Barriers to Accessing Health Care From the 2017 National Household Travel Survey. JAMA Netw Open. 2023;6(7):e2325291. doi: 10.1001/jamanetworkopen.2023.25291
- 6 Liddle J, Scott TL, Hoyle M, Salmon A, Gustafsson L, Pachana NA. The mental health outcomes of driving cessation for older people: A systematic review. International Psychogeriatrics. 2024:100020. doi: 10.1016/j.inpsyc.2024.100020
- 7 Choi NG, Marti CN. Transportation barriers, loneliness, and depressive/anxiety symptoms in older adults. Innovation in Aging. 2025;9(12):igaf127. doi: 10.1093/geroni/igaf127
- 8 Buehler R, Pucher J, Wittwer R, Gerike R. Travel Behavior of Older Adults in the USA, 2001-2017. Travel Behaviour and Society. 2024;36:100783. doi: 10.1016/j.tbs.2024.100783
- 9 Buehler R, Pucher J, Wittwer R, Gerike R. Trends and determinants of the mobility of older adults in the USA and Germany, 2001–2017. Transportation Research Part A: Policy and Practice. 2024;183:104065. doi: 10.1016/j.tra.2024.104065
- 10 Lidbe A, Adanu EK, Penmetsa P, Jones S. Changes in the travel patterns of older Americans with medical conditions: A comparison of 2001 and 2017 NHTS data. Transportation Research Interdisciplinary Perspectives. 2021;11:100463. doi: 10.1016/j.trip.2021.100463
- 11 Mitra S, Yao M, Ritchie SG. Gender differences in elderly mobility in the United States. Transportation Research Part A: Policy and Practice. 2021;154:203-226. doi: 10.1016/j.tra.2021.10.015
- 12 Shirgaokar M, Dobbs B, Anderson L, Hussey E. Do rural older adults take fewer trips than their urban counterparts for lack of a ride?. Journal of Transport Geography. 2020;87:102819. doi: 10.1016/j.jtrangeo.2020.102819
- 13 Chudyk AM, Winters M, Moniruzzaman M, Ashe MC, Gould JS, McKay H. Destinations matter: The association between where older adults live and their travel behavior. Journal of Transport & Health. 2015;2(1):50-57. doi: 10.1016/j.jth.2014.09.008
- 14 Kwon K, Akar G. Influence of neighborhood walkability on older adults’ walking trips: Does income matter?. Travel Behaviour and Society. 2025;38:100912. doi: 10.1016/j.tbs.2024.100912
- 15 Besser LM, Mitsova D, Williams CL, Wiese L. Redlining and Neighborhood Walking in Older Adults: The 2017 National Household Travel Survey. American Journal of Preventive Medicine. 2022;63(6):926-934. doi: 10.1016/j.amepre.2022.06.010
- 16 Molnar LJ, Charlton JL, Eby DW, Langford J, Koppel S, Kolenic GE, et al. Factors Affecting Self-Regulatory Driving Practices Among Older Adults. Traffic Injury Prevention. 2014;15(3):262-272. doi: 10.1080/15389588.2013.808742
- 17 Ang BH, Oxley JA, Chen WS, Yap KK, Song KP, Lee SWH. To reduce or to cease: A systematic review and meta-analysis of quantitative studies on self-regulation of driving. Journal of Safety Research. 2019;70:243-251. doi: 10.1016/j.jsr.2019.07.004
- 18 Róin T, Petersen MS, Róin Á. ‘I can still drive a car.’ Self-presentation in later life and the symbolic value of driving. Ageing and Society. 2025;45(1):164-175. doi: 10.1017/s0144686x23000326
- 19 Carpenter J, Koppel S, Modesto O, McGuckian TB, Weir B, Bennett JM. Driving retirement in older adults: a qualitative exploration into their plans, feelings, and support needs. The Gerontologist. 2026;66(10):gnag195. doi: 10.1093/geront/gnag195
- 20 Bamney S, Pulugurtha SS. Public transportation use and online shopping behavior among older adults: insights on the effect of the pandemic from the National Household Travel Survey (NHTS) data and the Environmental Protection Agency (EPA) smart location database. Case Studies on Transport Policy. 2026;26:101973. doi: 10.1016/j.cstp.2026.101973
- 21 Ang BH, Jennifer O, Chen WS, Lee SWH. Factors and challenges of driving reduction and cessation: A systematic review and meta-synthesis of qualitative studies on self-regulation. Journal of Safety Research. 2019;69:101-108. doi: 10.1016/j.jsr.2019.03.007
- 22 Savoie C, Voyer P, Lavallière M, Bouchard S. Transition from driving to driving-cessation: experience of older persons and caregivers: a descriptive qualitative design. BMC Geriatr. 2024;24(1):219. doi: 10.1186/s12877-024-04835-3
- 23 Federal Highway Administration; Oak Ridge National Laboratory. 2022 NextGen National Household Travel Survey User Guide, Version 2 (public use) [Internet]. 2024. Available from: https://nhts.ornl.gov/assets/2022/doc/2022%20NextGen%20NHTS%20User%27s%20Guide%20V2_PubUse.pdf
- 24 Federal Highway Administration; Oak Ridge National Laboratory. 2022 NextGen National Household Travel Survey: public-use data files [Internet]. 2024. Available from: https://nhts.ornl.gov/assets/2022/download/csv.zip
- 25 Ivanovic SS, Balac M. Who travels more and longer in Switzerland? Insights into mode choice, daily travel time, and trip frequency from GPS-based data. Transportation. 2026;53(7):5351-5386. doi: 10.1007/s11116-025-10687-6
- 26 Yin Y, Xi Y. Quantification of latent travel demand across age groups with a focus on older adults: a theoretical framework with empirical evidence from China. Transportation Research Part A: Policy and Practice. 2026;211:105130. doi: 10.1016/j.tra.2026.105130
- 27 Park S, Akar G. Analysis of socioeconomic and built environment factors influencing travel mode choice of older adults in Georgia. Journal of Transport Geography. 2024;121:104030. doi: 10.1016/j.jtrangeo.2024.104030
- 28 KING MJ, SCOTT-PARKER BJ. Older male and female drivers in car-dependent settings: how much do they use other modes, and do they compensate for reduced driving to maintain mobility?. Ageing and Society. 2017;37(6):1249-1267. doi: 10.1017/s0144686x15001555
- 29 Unsworth C, Dickerson A, Gélinas I, Harries P, Margot-Cattin I, Mazer B, et al. Linking people and activities through community mobility: an international comparison of the mobility patterns of older drivers and non-drivers. Ageing and Society. 2022;42(8):1938-1963. doi: 10.1017/s0144686x20001968
- 30 Abe T, Seino S, Hata T, Yamashita M, Ohmori N, Kitamura A, et al. Transportation modes and social participation in older drivers and non-drivers: Results from urbanised Japanese cities. Journal of Transport Geography. 2023;109:103598. doi: 10.1016/j.jtrangeo.2023.103598
- 31 Dilian O, Davidovitch N, Martens K. “I love public transport, but now I’m too afraid to use it”: a qualitative study of public transport use cessation among older adults. The Gerontologist. 2025;65(8):gnaf153. doi: 10.1093/geront/gnaf153
- 32 Alousi-Jones M, Carvalho T, Zhang M, Jimenez I, El-Geneidy A. Who is willing to take transit in the future? Older adults’ perceived challenges and barriers to using public transit across Canada. Transportation Research Part A: Policy and Practice. 2025;192:104376. doi: 10.1016/j.tra.2025.104376
- 33 Mackett R. Impact of Concessionary Bus Travel on the Well-Being of Older and Disabled People. Transportation Research Record: Journal of the Transportation Research Board. 2013;2352(1):114-119. doi: 10.3141/2352-13
- 34 Beckers C, Ermagun A, Cardon G, Witlox F. Moving well, ageing well: How built and social environments shape mobility and well-being in later life. Journal of Urban Mobility. 2026;10:100243. doi: 10.1016/j.urbmob.2026.100243
- 35 Twardzik E, Falvey JR, Clarke PJ, Freedman VA, Schrack JA. Public transit stop density is associated with walking for exercise among a national sample of older adults. BMC Geriatr. 2023;23(1):596. doi: 10.1186/s12877-023-04253-x
- 36 Mitra SK, Bae Y, Ritchie SG. Use of Ride-Hailing Services among Older Adults in the United States. Transportation Research Record: Journal of the Transportation Research Board. 2019;2673(3):700-710. doi: 10.1177/0361198119835511
- 37 Cochran AL, Chatman DG. Use of app-based ridehailing services and conventional taxicabs by adults with disabilities. Travel Behaviour and Society. 2021;24:124-131. doi: 10.1016/j.tbs.2021.02.004
- 38 Kim SO. Mobility of care and time poverty: the travel burdens of family caregivers in an aging America. Transportation. 2026;53(6):4083-4105. doi: 10.1007/s11116-025-10630-9
- 39 Begde A, Hogervorst E, Talbot R, Wilcockson T, Gyi D, Fildes B, et al. Early-stage dementia and driving: what do older adults want to happen when driving is no longer safe?. Accident Analysis & Prevention. 2026;236:108686. doi: 10.1016/j.aap.2026.108686
- 40 Shen S, Ratnapradipa KL, Pervall GC, Sweeney M, Zhu M. Driver License Renewal Laws and Older Adults’ Daily Driving, United States, 2003–2017. The Journals of Gerontology: Series B. 2020;75(10):2268-2277. doi: 10.1093/geronb/gbaa070
- 41 Cox AE, Cicchino JB. Continued trends in older driver crash involvement rates in the United States: Data through 2017–2018. Journal of Safety Research. 2021;77:288-295. doi: 10.1016/j.jsr.2021.03.013
Declarations
Funding
No financing
Conflict of interest
None
Authorship contributions
Drafting – original draft: Rómulo Esteban Montilla.
Writing–review and editing: Rómulo Esteban Montilla.