

Abstract
Introduction: The COVID-19 pandemic reduced public transport ridership in the United States more than service supply, but whether that divergence persisted through 2025 and how it varied by mode and agency size has not been quantified nationally. Methods: Ecological time-series study of monthly Federal Transit Administration records for 2019-2025. Recovery indices expressed unlinked passenger trips and vehicle revenue miles as percentages of 2019 values, and the service-ridership gap was computed as their difference. Crude and adjusted volume-weighted differences in the 2025 gap were estimated by mode and agency size. Results: Among 560 agencies and 1,123 agency-mode units, 2025 ridership reached 80.8% and service supply 94.6% of 2019 values, a gap of 13.8 percentage points. The gap was largest for commuter rail (23.4 pp), heavy rail (21.6 pp) and light rail and streetcar (20.5 pp), and smallest for demand response (1.4 pp). After adjustment, commuter rail, heavy rail and light rail remained 10.0, 12.9 and 9.0 percentage points above bus, whereas agency size differences attenuated. Conclusions: Service supply recovered faster and to a higher level than ridership; the residual gap was concentrated in rail modes and attributable to mode mix rather than agency size.
Keywords
public transit, ridership, vehicle revenue miles, service supply, COVID-19, United States
INTRODUCTION
Public transport ridership in the United States entered a period of decline before the pandemic and collapsed abruptly in 2020, while vehicle revenue miles fell by a smaller margin because agencies continued to operate service for essential workers and because federal relief reduced the pressure to cut service.( 1,2)
The pre-pandemic decline had already separated ridership from the growth of service in several large systems, a gap that was driven by rising car ownership, the spread of ride-hailing, and the suburbanization of employment.( 1)
The pandemic then compressed that process into a few months. The divergence between the two series is important for transport policy. Service supply is a major determinant of ridership, and agencies that preserve service during a demand shock incur operating costs that may exceed recovered fare revenue, a fiscal condition that cannot be sustained indefinitely.( 3,4)
In the first pandemic year, ridership fell to roughly half of its 2019 level, whereas service supply remained above three quarters, which created the largest supply-ridership gap in the modern history of United States transit.( 2)
National samples and individual systems have documented the depth and the unevenness of the recovery, with larger losses in dense, rail-oriented regions and among office commuters, while bus ridership held up better among essential workers and captive riders.( 5-7)
Ridership remained below the 2019 level through 2024 in most large metropolitan areas, and recovery has been slower than after earlier disruptive events such as strikes and natural disasters.(8,9)
The recovery did not follow a single national trajectory but a set of mode-specific and place-specific paths, with rail commuting recovering last.( 8,10)
The supply side has received less attention. Some agencies maintained near-normal service with the support of federal emergency funding, whereas others reduced service and concentrated the cuts in communities with high social vulnerability.( 11,12)
The equity stakes are high because the riders who remained were disproportionately lower-income, minority, and essential workers, the same groups who depend most on the service that was preserved or cut.( 5,13)
A longitudinal estimate of the elasticity of ridership with respect to service suggests that the service changes made during the pandemic continued to shape demand in the post-pandemic period.( 3)
The determinants of the ridership collapse itself have been attributed to a combination of policy orders, infection fear, and the persistence of telework, each of which operates on a different time scale than the supply decisions that agencies control.( 14)
What is missing is a national account of whether service supply and ridership recovered at different rates, by mode and by agency size, through 2025. Mode matters because rail and bus serve different demand bases and because rail operators, which run fixed infrastructure, cannot adjust service as flexibly as bus operators. Agency size matters because larger agencies are the ones that operate rail and because their fiscal exposure to a persistent gap is greater.
The objective of this study was to quantify whether the recovery of public transport service supply, measured as vehicle revenue miles, kept pace with the recovery of ridership, measured as unlinked passenger trips, in the United States between 2019 and 2025, by mode and by agency size. The hypothesis was that service supply recovered faster and to a higher level than ridership, and that the service-ridership gap was larger for rail modes and for larger agencies than for bus modes and smaller agencies.
METHODS
Design and setting
A retrospective ecological time-series study was conducted with monthly administrative records of United States public transport for the period 2019-2025. The period was chosen to span the last complete pre-pandemic year, the full shock and relief cycle, and the most recent complete year, so that recovery could be assessed against a stable 2019 baseline. The setting comprised all transit agencies that report monthly data to the National Transit Database, which covers the full universe of federally funded urban and rural transit service in the country.
Reporting followed the Strengthening the Reporting of Observational Studies in Epidemiology (STROBE) statement and, because the data were routinely collected, the RECORD extension for studies conducted using observational routinely-collected data.( 15,16)
The time-series structure of the monthly records is suited to the recovery-index approach used here, which is consistent with the methods applied in post-pandemic ridership forecasting studies.( 17)
Data source
Data were obtained from the Complete Monthly Ridership (with Adjustments and Estimates) dataset of the National Transit Database, published by the Federal Transit Administration through the data.transportation.gov portal.( 18)
The monthly module collects a limited set of key indicators by agency, mode, and type of service, including unlinked passenger trips, vehicle revenue miles, vehicle revenue hours, and vehicles operated in maximum service. The monthly series was preferred over the annual database because it allows year-specific recovery indices to be computed at the same temporal resolution at which agencies make service decisions, and because it includes the estimates and adjustments that the Federal Transit Administration applies to incomplete submissions.
Study units and eligibility
The unit of analysis was the agency-mode-type-of-service combination, defined by the five-digit NTD identifier, the mode, and the type of service, because an agency may operate the same mode under both directly operated and purchased transportation arrangements. Defining the unit at this level prevents double counting when the same service is reported twice under different operating arrangements and keeps the recovery index specific to a homogeneous service product.
Records with an active service status were included. Reporter types that operate regular revenue service were retained: full reporters, small systems reporters, rural reporters, and reduced asset reporters. Building reporters and separate service reporters were excluded because they do not represent regular revenue service. The analysis window was restricted to calendar months between January 2019 and December 2025, so that 2019 served as a complete pre-pandemic baseline and 2025 as the most recent complete year. A unit was retained for the recovery analysis only when it reported at least six months in 2019 with positive annual vehicle revenue miles and positive annual unlinked passenger trips. This criterion excluded units without a stable baseline while preserving the universe of pre-existing service.
Variables
Ridership was defined as annual unlinked passenger trips, and service supply as annual vehicle revenue miles, with vehicle revenue hours reported as a secondary supply measure. For each unit and each year, a recovery index was computed as the annual value divided by the 2019 value and multiplied by 100. The service-ridership gap was defined, in percentage points, as the service supply recovery index minus the ridership recovery index in a given year, so that positive values indicate that service recovered more than ridership.
Transit modes were grouped into nine categories: bus (motor bus, bus rapid transit, and trolleybus), commuter bus, demand response, vanpool, heavy rail, commuter rail, light rail and streetcar, ferryboat, and other modes. This grouping separates the fixed-route rail modes that are most exposed to the loss of office commuting from bus and paratransit services that serve a different demand base, and it avoids the coarser three-way split into bus, rail, and ferry that would hide the contrast between heavy rail and commuter rail.
Agency size was defined by the 2019 annual agency-level vehicle revenue miles, divided into terciles with cut points at 1,170,857.33 and 3,300,694.33 million vehicle revenue miles per year, labeled small, medium, and large. Terciles were chosen to produce three equally sized agency classes without imposing arbitrary external thresholds.
Statistical analysis
Recovery indices were computed first as aggregate ratios, by summing unit-level annual values within the balanced panel before division, so that national, mode, and size indices represent total volume relative to 2019. This aggregate definition avoids the instability of averaging unit-level ratios in which small baseline values produce extreme percentages, and it aligns the descriptive estimates with the volume-weighted inferential model. Monthly records with a missing value were treated as zero within the annual summation, so that units that stopped operating during the study window reduce the corresponding annual total. The primary outcome was the unit-level service-ridership gap in 2025.
Crude differences in the gap across mode groups and agency size classes were estimated with volume-weighted linear regression, using 2019 vehicle revenue miles as weights, which reflects the relative contribution of each unit to national service. Adjusted differences were estimated with a weighted linear model that included mode group and agency size class simultaneously, with bus as the reference mode and large agencies as the reference size class; bus was chosen as the reference because it is the largest single mode and the natural comparison for rail and paratransit services.
Heteroskedasticity-robust standard errors were used for all 95% confidence intervals, and two-sided p values were reported at a significance level of 0.05. Because the unit-level gap is skewed, the primary estimates are volume-weighted and the sensitivity analyses include winsorization; the choice of a linear model with robust errors was preferred over a log transformation so that the coefficients remain interpretable in percentage points. The adjusted model R-squared and the number of units were recorded.
Four sensitivity analyses were performed: restriction to full reporters, computation of the gap for 2024 instead of 2025, winsorization of the unit-level gap at the first and ninety-ninth percentiles, and cluster-robust standard errors at the agency level.
Bias
Several sources of bias were considered in the design. Selection bias arises because the balanced panel retains only units that existed in 2019, so the estimates describe the fate of pre-pandemic service rather than the full 2025 system; this restriction is reported transparently and preserves comparability. Information bias arises from agency reporting, because monthly values include adjustments and estimates that may smooth or lag the underlying activity.
To limit the influence of these errors, the analysis relied on annual sums and on aggregate indices rather than on individual monthly cells. Confounding by regional differences and local policy remains possible because the model adjusted only for mode and agency size; the sensitivity analyses were designed to test the stability of the main estimate under alternative definitions of the sample and the outcome.
Ethics statement
The study used public, aggregate, anonymized administrative data and did not involve human participants; ethics approval was not required.
RESULTS
Study units
A total of 560 agencies and 1,123 agency-mode-type-of-service units met the eligibility criteria and contributed a 2019 baseline across 18 reported modes (Table 1). Records with inactive service status, building reporters, and separate service reporters were excluded before the balanced panel was defined, as were units without at least six months of 2019 reporting.
In 2019 the included units carried 9.54 billion unlinked passenger trips and operated 4.07 billion vehicle revenue miles and 274.70 million vehicle revenue hours. Bus and heavy rail accounted for most ridership, whereas bus and demand response accounted for most service supply. Unit counts ranged from fewer than 20 for the smallest rail groups to more than 400 for bus and demand response (Table 1). Forty-nine units recorded no ridership in 2025, which indicates discontinued service or the complete loss of demand in those units.
Mode group | Agency-mode units | UPT 2019 (millions) | VRM 2019 (millions) | VRH 2019 (millions) |
|---|---|---|---|---|
Bus | 432 | 4438.0 | 1818.0 | 156.5 |
Commuter bus | 61 | 60.0 | 96.0 | 3.8 |
Demand response | 444 | 95.0 | 751.0 | 51.8 |
Vanpool | 65 | 31.0 | 201.0 | 5.5 |
Heavy rail | 15 | 3804.0 | 703.0 | 35.3 |
Commuter rail | 25 | 505.0 | 352.0 | 11.5 |
Light rail and streetcar | 39 | 492.0 | 120.0 | 8.2 |
Ferryboat | 25 | 76.0 | 4.0 | 0.4 |
Other | 17 | 42.0 | 20.0 | 1.8 |
Note: UPT = unlinked passenger trips; VRM = vehicle revenue miles; VRH = vehicle revenue hours.
Descriptive data
The national monthly indices show that ridership fell more deeply and earlier than service supply in 2020 and recovered more slowly thereafter (Figure 1). Annual ridership reached 46.5% of the 2019 level in 2020, while service supply remained at 79.8%. Both series recovered progressively, and in 2025 ridership reached 80.8% and service supply 94.6% of 2019 values (Table 2).
The national service-ridership gap narrowed from 33.3 percentage points in 2020 to 13.8 percentage points in 2025, after reaching its widest point of 34.6 percentage points in 2021, when service began to return while ridership remained depressed. The deepest modal declines in 2020 were also concentrated in rail: commuter rail ridership fell to 31.6% of its 2019 level and heavy rail to 39.0%, whereas bus ridership fell to 54.9%. The corresponding service supply indices in 2020 were 75.3% for commuter rail and 87.5% for bus. Demand response service fell to 63.8% while its ridership fell to 54.7%, a smaller divergence than in rail.
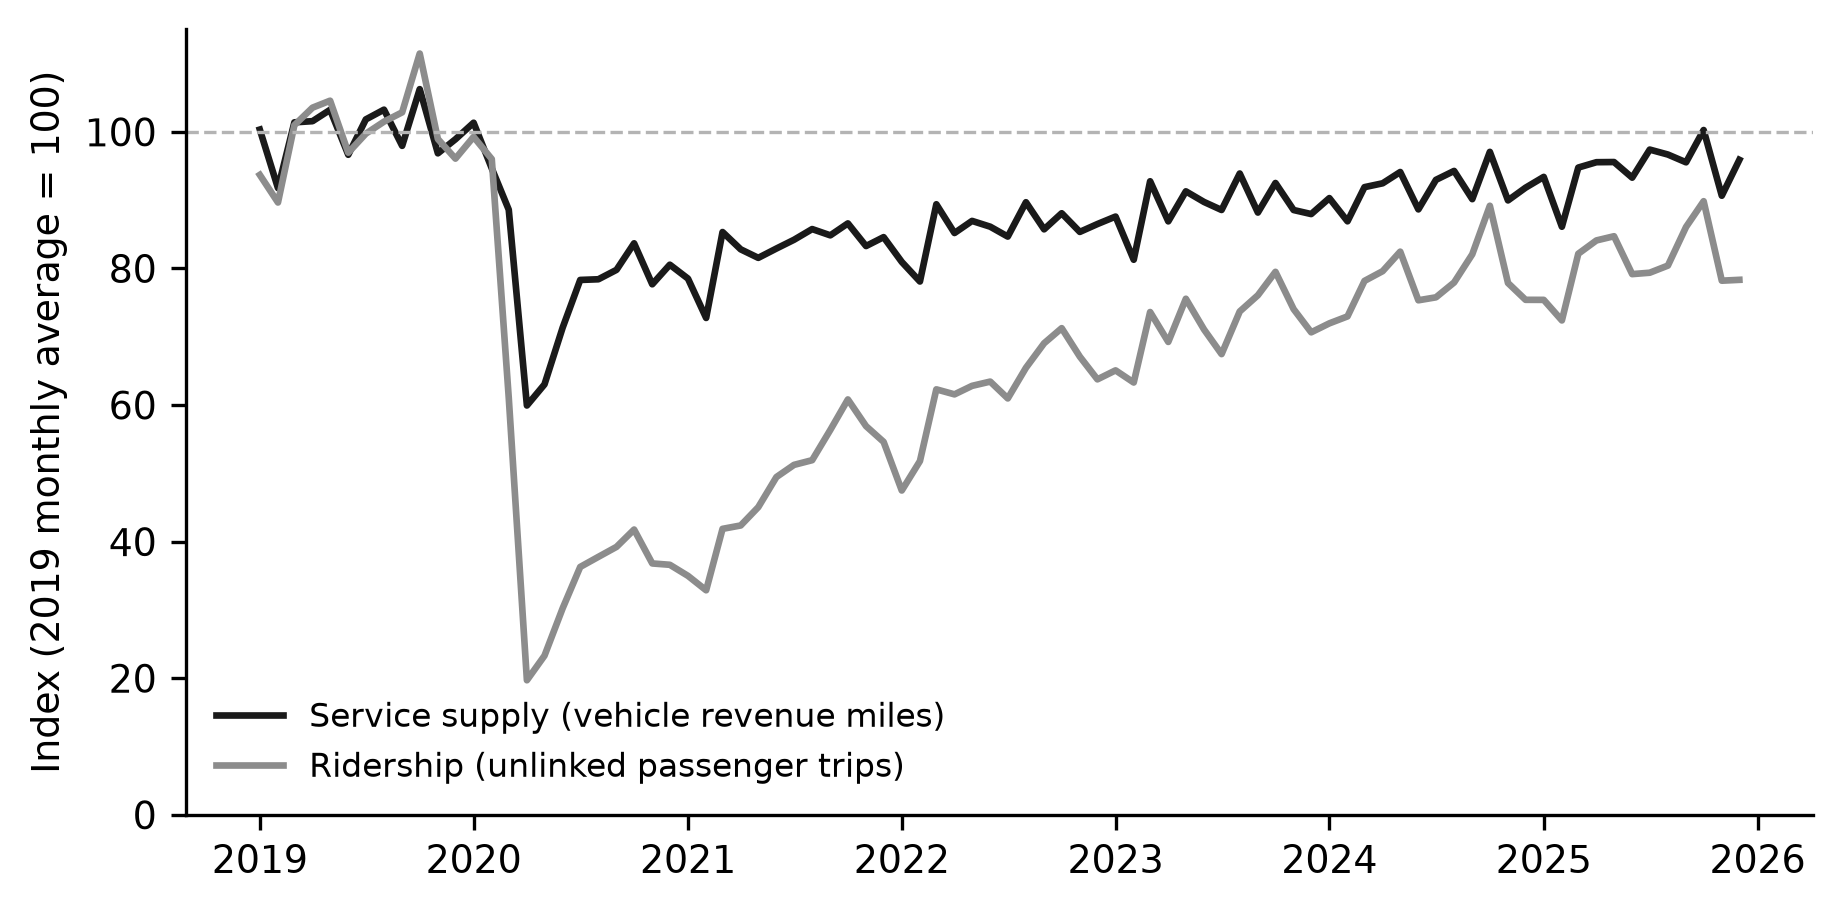
Figure 1. National monthly ridership and service supply indices, 2019-2025.
Note: Indices express each monthly total as a percentage of the 2019 monthly average.Year | UPT index (%) | VRM index (%) | Gap (percentage points) |
|---|---|---|---|
2020 | 46.5 | 79.8 | 33.3 |
2021 | 48.2 | 82.8 | 34.6 |
2022 | 62.2 | 85.6 | 23.3 |
2023 | 71.6 | 89.1 | 17.5 |
2024 | 78.2 | 91.7 | 13.5 |
2025 | 80.8 | 94.6 | 13.8 |
Note: Indices express each year total as a percentage of the 2019 total; gap = VRM index minus UPT index.
Main results
In 2025 the service-ridership gap varied substantially by mode (Table 3; Figure 2). The gap was largest for commuter rail (23.4 percentage points), heavy rail (21.6 percentage points), light rail and streetcar (20.5 percentage points), and ferryboat (27.1 percentage points). It was smallest for demand response (1.4 percentage points), and the other modes group was the only category in which ridership recovered more than service supply (−10.0 percentage points) (Table 3). The volume-weighted mean gaps were 13.7 percentage points for bus, 23.5 percentage points for commuter rail, 26.4 percentage points for heavy rail, and 1.2 percentage points for demand response.
Mode group | Units | UPT index (%) | VRM index (%) | Gap (pp) |
|---|---|---|---|---|
Bus | 432 | 83.9 | 95.7 | 11.8 |
Commuter bus | 61 | 52.3 | 64.2 | 11.9 |
Demand response | 444 | 90.8 | 92.2 | 1.4 |
Vanpool | 65 | 65.4 | 83.6 | 18.2 |
Heavy rail | 15 | 79.5 | 101.1 | 21.6 |
Commuter rail | 25 | 74.9 | 98.3 | 23.4 |
Light rail and streetcar | 39 | 73.7 | 94.2 | 20.5 |
Ferryboat | 25 | 89.6 | 116.7 | 27.1 |
Other | 17 | 53.9 | 44.0 | -10.0 |
Note: Indices express 2025 totals as a percentage of 2019 totals; gap = VRM index minus UPT index.
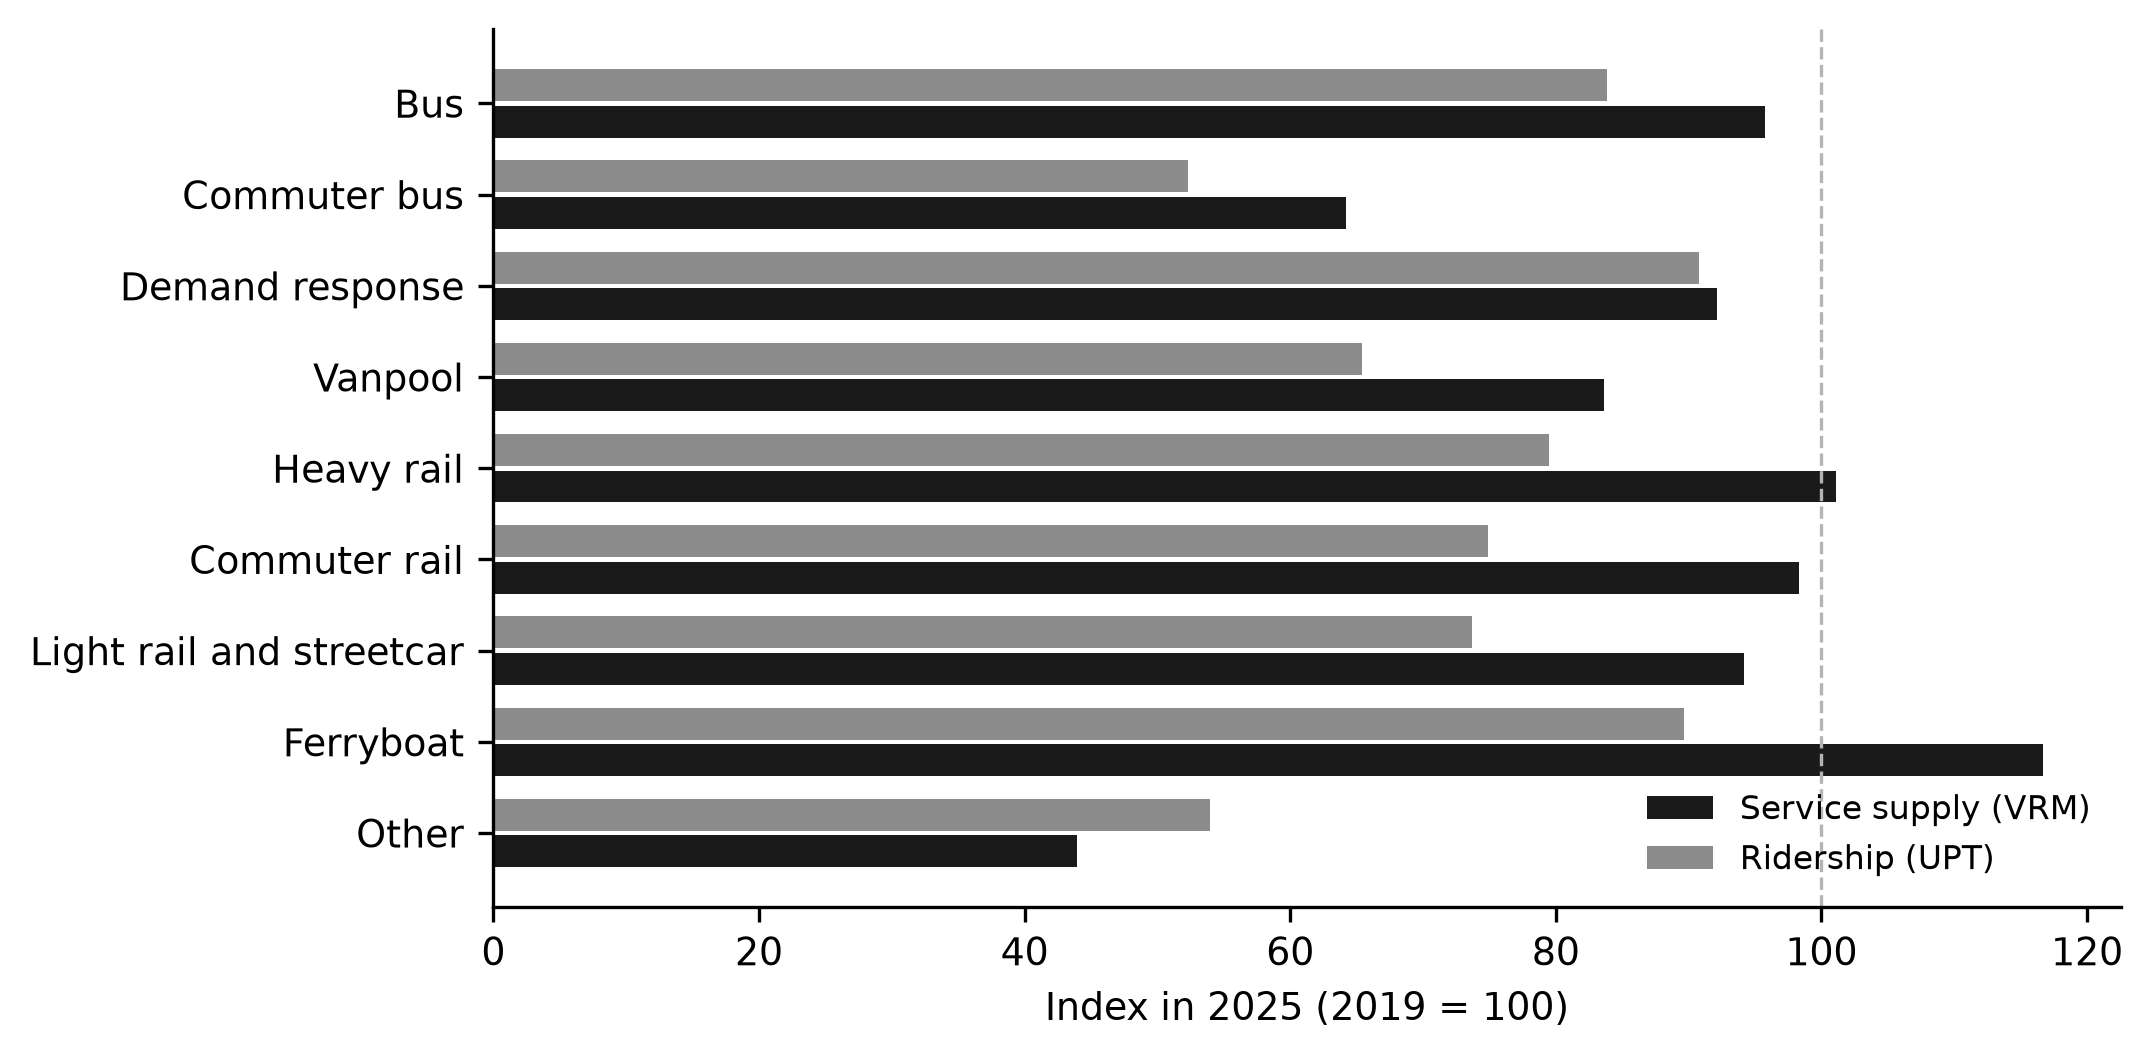
Figure 2. Ridership and service supply recovery indices by mode group in 2025.
In the crude volume-weighted analysis, the gap for heavy rail was 12.7 percentage points above bus (95% CI, 0.6 to 24.7); after adjustment for agency size, the difference was 12.9 percentage points (95% CI, 0.9 to 25.0; p = 0.036) (Table 4). The corresponding crude and adjusted differences were 9.8 and 10.0 percentage points for commuter rail (95% CI, 2.6 to 17.3; p = 0.008), and 8.8 and 9.0 percentage points for light rail and streetcar (95% CI, 2.9 to 15.2; p = 0.004). Demand response showed a crude difference of −12.6 percentage points below bus and an adjusted difference of −12.6 percentage points (95% CI, −16.9 to −8.4; p = <0.001) (Table 4; Figure 3).
The remaining modes did not differ from bus after adjustment: commuter bus −3.5 percentage points (95% CI, −10.3 to 3.2; p = 0.302), vanpool 4.1 percentage points (95% CI, −3.8 to 12.1; p = 0.306), ferryboat −6.8 percentage points (95% CI, −20.6 to 6.9; p = 0.331), and other modes −4.6 percentage points (95% CI, −11.0 to 1.8; p = 0.159) (Table 4).
With respect to agency size, the crude gap was −4.2 percentage points lower for small agencies and −2.1 percentage points lower for medium agencies relative to large agencies; after adjustment for mode, the differences were 1.1 percentage points (95% CI, −4.6 to 6.8; p = 0.702) and 2.5 percentage points (95% CI, −2.8 to 7.8; p = 0.355), respectively (Table 5; Table 4).
The adjusted model predicted a gap of 13.5 percentage points for the reference combination of bus and large agencies (95% CI, 11.4 to 15.5), which indicates that even the reference group retained a positive gap. The adjusted model explained 0.11 of the variance in the gap among 1,123 units.
Group | Level | Crude difference (pp) | Crude CI lower | Crude CI upper | Adjusted difference (pp) | Adjusted CI lower | Adjusted CI upper | Adjusted p |
|---|---|---|---|---|---|---|---|---|
Mode | Commuter bus | -3.2 | -9.9 | 3.5 | -3.5 | -10.3 | 3.2 | 0.3 |
Mode | Demand response | -12.6 | -16.8 | -8.4 | -12.6 | -16.9 | -8.4 | 0.0 |
Mode | Vanpool | 4.1 | -3.9 | 12.0 | 4.1 | -3.8 | 12.1 | 0.3 |
Mode | Heavy rail | 12.7 | 0.6 | 24.7 | 12.9 | 0.9 | 25.0 | 0.0 |
Mode | Commuter rail | 9.8 | 2.5 | 17.1 | 10.0 | 2.6 | 17.3 | 0.0 |
Mode | Light rail and streetcar | 8.8 | 2.7 | 14.9 | 9.0 | 2.9 | 15.2 | 0.0 |
Mode | Ferryboat | -6.0 | -19.3 | 7.3 | -6.8 | -20.6 | 6.9 | 0.3 |
Mode | Other | -4.7 | -10.9 | 1.5 | -4.6 | -11.0 | 1.8 | 0.2 |
Agency size | Small | -4.2 | -10.1 | 1.6 | 1.1 | -4.6 | 6.8 | 0.7 |
Agency size | Medium | -2.1 | -7.7 | 3.4 | 2.5 | -2.8 | 7.8 | 0.4 |
Note: Reference: Bus for mode and Large for agency size. Estimates are volume-weighted by 2019 vehicle revenue miles; adjusted estimates mutually adjust mode and size. 95% CI from heteroskedasticity-robust standard errors.
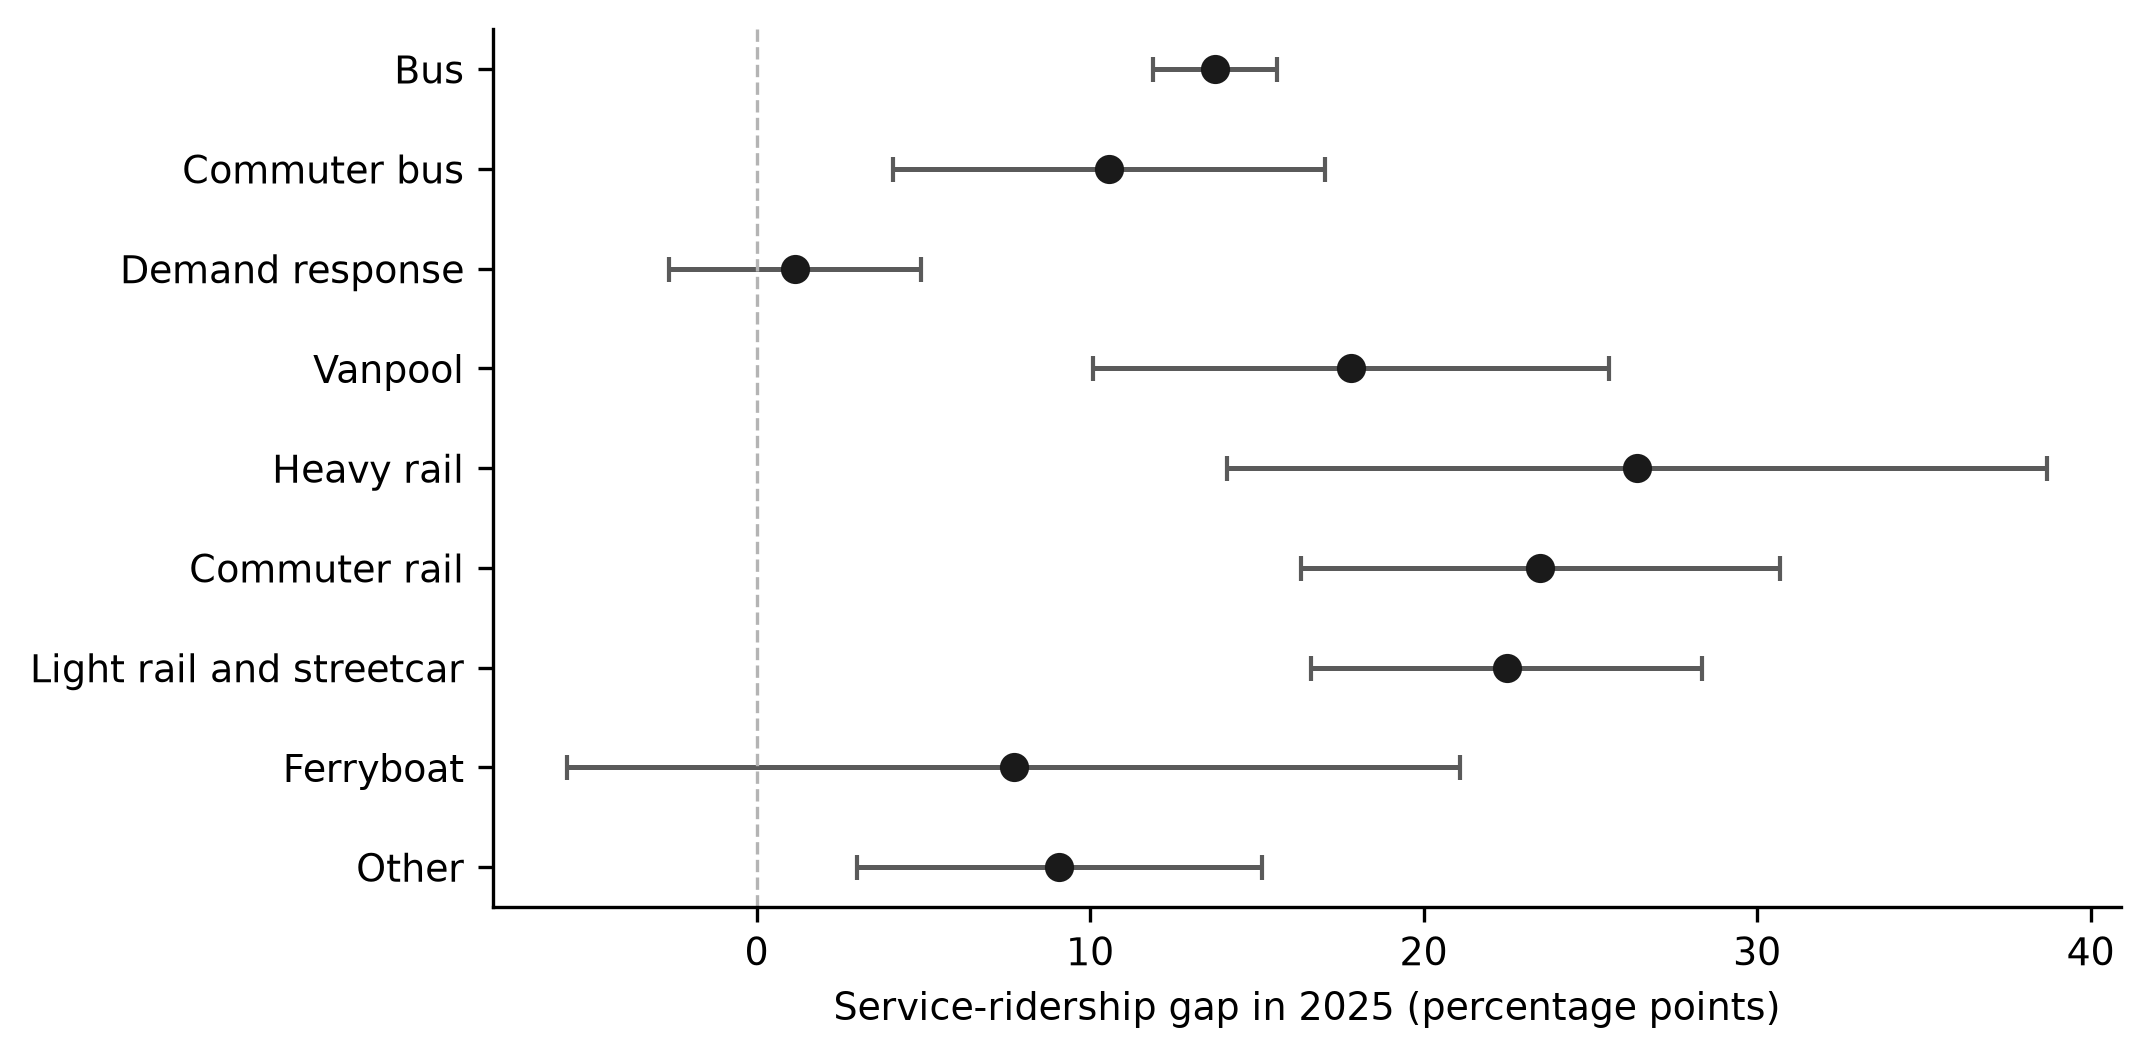
Figure 3. Volume-weighted service-ridership recovery gap in 2025 by mode group.
Note: Points indicate volume-weighted means and error bars indicate 95% confidence intervals.Other analyses
The results were robust to the sensitivity specifications. Restricted to full reporters, the adjusted commuter rail difference was 9.9 percentage points (p = 0.008). When the gap was computed for 2024 instead of 2025, the adjusted commuter rail difference was 12.0 percentage points (p = <0.001). Winsorization of the outcome at the first and ninety-ninth percentiles changed the estimate to 9.9 percentage points (p = 0.008), and cluster-robust standard errors at the agency level yielded p = 0.007.
None of these variations reversed the sign or the statistical significance of the rail contrasts. The descriptive size analysis showed that ridership and service indices were similar across the three agency size classes, with service between 94.2% and 97.7% of 2019 and ridership between 80.7% and 83.1% (Table 5).
Agency size | Agencies | Units | UPT index (%) | VRM index (%) | Gap (pp) |
|---|---|---|---|---|---|
Small | 166 | 265 | 82.8 | 94.2 | 11.5 |
Medium | 166 | 338 | 83.1 | 97.7 | 14.5 |
Large | 166 | 520 | 80.7 | 94.3 | 13.6 |
Note: Agency size classes are terciles of 2019 agency-level annual vehicle revenue miles; indices express 2025 totals as a percentage of 2019 totals.
DISCUSSION
Main findings
Service supply recovered faster and to a higher level than ridership throughout the 2019-2025 period, and the gap between the two series persisted after five years of recovery. By 2025 national service supply was within a few percentage points of its 2019 level, whereas ridership remained about one fifth below it. The residual gap was concentrated in rail modes, particularly commuter rail, and differences across agency size classes disappeared once mode composition was taken into account.
Interpretation and comparison with other studies
The depth of the ridership decline and the slow recovery observed here agree with national and comparative accounts of United States transit during the pandemic.( 2,8)
Ridership fell faster than service because the shock was concentrated in commuting, which is served disproportionately by rail, and because telework persisted after the health emergency ended.( 10,19)
The finding that commuter rail and heavy rail carried the largest service-ridership gaps is consistent with studies of individual systems. Metra ridership in Chicago recovered slowly and remained far below service levels through 2022, and Chicago Transit Authority rail recovered more slowly than bus.( 20,21)
Station-area and built-environment analyses also found weaker recoverability for rail ridership in California and for metro systems.( 22,23)
The demand response result, a gap near zero, reflects the resilience of paratransit and contracted services, whose ridership recovered almost in step with service. Performance analyses of Texas agencies reached a comparable conclusion that demand response and rural service were less disrupted than fixed-route service.( 24)
The absence of an independent agency size effect after adjustment is explained by mode composition: large agencies are the ones that operate rail, so the apparent size gradient was a rail effect rather than a scale effect.( 11)
The descriptive pattern is consistent with the observation that service cuts during the pandemic were not distributed uniformly and that the equity consequences of supply decisions fell on the communities that depend most on transit.( 12,13,25)
Several mechanisms explain why service outpaced ridership. Federal emergency funding allowed agencies to retain service that fare revenue alone would not have supported, and some agencies avoided cuts altogether in the first years of the pandemic.( 4,11)
Where cuts did occur, they were concentrated in low-income and minority communities, which implies that the service side of the recovery also has an equity dimension.( 5,12)
The estimated elasticity of ridership with respect to service indicates that the decision to maintain service supported ridership in the post-pandemic period, so the observed gap may partly reflect a deliberate policy of supply-led recovery.( 3)
Ridership itself remained constrained by infection fear, changes in the predictors of transit use, and the loss of former commuters, all of which are demand-side factors that service alone cannot reverse.( 10,26,27)
he initial collapse also responded to executive orders and public fear rather than to service reductions alone, which supports the interpretation that supply and demand moved for different reasons.( 14)
The comparison with studies that emphasize demand-side recovery adds a supply-side complement. Segmenting riders and tailoring service to returning groups, retaining bus riders in place-based markets, and adapting strategies to agency characteristics are all framed as ridership interventions, yet they presuppose that service is available to be used.( 28-30)
Analyses of who returned to transit identify the same groups that are most sensitive to service reliability, which connects the supply decision to the composition of recovered demand.( 31)
Public transit in transition and resilience analyses likewise describe a system in which supply decisions shape the speed and the equity of recovery.( 32-34)
The user experience of urban public transport, measured as perceived service quality, is one channel through which maintained service may have influenced the willingness of riders to return.( 35)
Fare policy experiments in the United States further show that changes in price and service interact with ridership and finances, which cautions against reading the supply-ridership gap as a permanent equilibrium.( 36)
The interpretation of the gap also depends on the counterfactual that is implicit in each study. If the benchmark is a demand-led recovery, the rail gap appears as a fiscal problem, because agencies operate more service than riders are buying. If the benchmark is a supply-led recovery, the same gap appears as a deliberate investment in accessibility, because maintaining service kept destinations reachable for riders who remained dependent on transit.
The evidence gathered here cannot distinguish these two readings, but the persistence of the gap and the concentration of the residual in rail modes suggest that agencies, especially large rail operators, treated service restoration as a public obligation rather than as a response to observed demand.( 4,11)
The financing structure that made this possible was exceptional, and its continuation is not guaranteed, which is why the supply-ridership gap is best read as a transitional state rather than a new steady state.( 4,36)
The United States pattern can be positioned against international experience. Comparative work on public transport during the pandemic in the United Kingdom, Germany, Canada, and Australia found that ridership fell everywhere but that the strength and the timing of the recovery diverged with each country's service and subsidy decisions, which supports the view that the supply-ridership gap is a policy outcome rather than an inevitable consequence of the shock.( 2)
Montreal, for example, experienced a comparable collapse and a slow rail-led recovery, while systems with stronger state operating support restored service more completely.( 2)
These parallels suggest that the mechanisms identified here, commuting loss concentrated in rail and supply protected by public funding, generalize to settings with similar institutional arrangements, and they reinforce the practical value of monitoring service and ridership jointly rather than in isolation.
A limitation of vehicle revenue miles as a supply measure deserves emphasis in the interpretation. Miles measure how much service is produced but not how usefully it is distributed across the day, and a rail agency can restore mileage while offering a timetable that is poorly matched to a hybrid work week. Frequency, span of service, and reliability are the attributes that riders perceive, and studies of post-pandemic avoidance show that perceived risk and service quality weigh more than raw mileage in the decision to return.( 26,35)
Future work could therefore replace the mileage index with frequency-based measures of service, or pair the National Transit Database with general transit feed specification schedules, to test whether the supply-ridership gap reflects miles that were restored but not effectively scheduled. Such an extension would connect the aggregate finding reported here to the operational choices that determine whether maintained service actually becomes usable service for the riders who have not returned.
The study has several strengths that support the interpretation of the results. It used a complete national administrative series rather than a sample of agencies, which removes the selection concerns that affect case-study comparisons of recovery.
The unit-level definition of the service-ridership gap is transparent and can be recomputed from the public dataset, and the separation of crude from adjusted estimates, together with the sensitivity analyses, shows that the rail pattern is not an artifact of the weighting or the sample. The inclusion of small, rural, and reduced-asset reporters extends the analysis beyond the large urban systems that dominate the literature on transit recovery, and the six-year window covers the full cycle of decline and partial recovery rather than a single cross-section. These properties make the findings suitable as a national benchmark against which agency-level and city-level studies can be compared.
Limitations
This study has several limitations. The design is ecological, so associations at the mode and agency level cannot be interpreted as individual behavior, and the adjusted differences identify associations rather than causal effects of mode or size. The data are administrative and depend on the accuracy of agency reporting, including adjustments and estimates in the monthly module; validation against audited annual files would strengthen the estimates.
The balanced panel excludes units without a 2019 baseline, so the indices describe the recovery of pre-existing service rather than the entry of new services; this choice was intentional to keep year-to-year comparisons stable. The unit-level gap is skewed and was therefore analyzed with volume weighting, which gives more weight to large producers of service and less to the many small units.
The analysis adjusted only for mode and agency size, so residual confounding by region, funding, and local policy remains possible, and future work could add these covariates in a multilevel design. The recovery index uses annual sums and cannot separate frequency from trip length, and it does not measure service quality attributes such as frequency, reliability, or crowding, which may matter as much as mileage for ridership. Finally, the 2025 endpoint is recent, and late-arriving data revisions could alter the final-year estimates slightly.
Generalizability
The findings apply to the United States, where federal relief and the structure of the National Transit Database supported a supply-led recovery, and they may not transfer to countries without comparable operating subsidies or reporting systems. Within that context, the results are relevant to transit agencies that must decide whether to hold service at recovered levels when ridership remains below baseline, because the persistence of the rail gap suggests that the operating cost of maintained service will continue to exceed recovered fare revenue unless demand returns or subsidies adjust.
For planning practice, the mode-specific pattern of the gap implies that uniform service restoration rules are poorly suited to a system whose modes serve different demand bases; a commuter rail agency and a demand response provider face opposite mismatches between what they operate and what riders use. The same logic argues for setting service targets by mode rather than by a single national benchmark. For fiscal policy, the results support monitoring the service-ridership gap as a leading indicator of structural imbalance, together with the fare and subsidy instruments that determine whether the gap closes through demand recovery or through service retrenchment.( 4,36)
CONCLUSIONS
The recovery of service supply, measured as vehicle revenue miles, outpaced the recovery of ridership between 2019 and 2025, and the two series remained separated by a substantial gap in 2025. The service-ridership gap was largest for commuter rail, heavy rail, and light rail and smallest for demand response, a pattern that persisted after adjustment for agency size and across the sensitivity analyses. Agency size did not independently explain the gap once mode composition was accounted for, which indicates that the observed size gradient reflected the concentration of rail operations in large agencies. The results support monitoring service and ridership together as a fiscal and accessibility indicator for the post-pandemic transit system.
References
- 1 Erhardt GD, Hoque JM, Goyal V, Berrebi S, Brakewood C, Watkins KE. Why has public transit ridership declined in the United States?. Transportation Research Part A: Policy and Practice. 2022;161:68-87. doi: 10.1016/j.tra.2022.04.006
- 2 Buehler R, Pucher J, White P, Currie G. Public transport and the COVID-19 pandemic: A comparative analysis of trends and policies in Great Britain, Germany, the USA, Canada, and Australia. Transportation Research Part A: Policy and Practice. 2025;199:104549. doi: 10.1016/j.tra.2025.104549
- 3 Redelmeier P, El-Geneidy A. If You Cut It Will They Ride? Longitudinal Examination of the Elasticity of Public Transport Ridership in the Post-Pandemic Era. Transportation Research Record: Journal of the Transportation Research Board. 2024;2678(11):241-252. doi: 10.1177/03611981241240754
- 4 Zhu P, Wang Z, Zhang X, Wang K. Public transit funding and transit use: a panel study of U.S. urbanized areas 2010–2019. Transportation Research Part A: Policy and Practice. 2026;212:105133. doi: 10.1016/j.tra.2026.105133
- 5 Paul J, Taylor BD. Pandemic transit: examining transit use changes and equity implications in Boston, Houston, and Los Angeles. Transportation. 2024;51(2):615-643. doi: 10.1007/s11116-022-10345-1
- 6 Ziedan A, Lima L, Brakewood C. A multiple mediation analysis to untangle the impacts of COVID-19 on nationwide bus ridership in the United States. Transportation Research Part A: Policy and Practice. 2023;173:103718. doi: 10.1016/j.tra.2023.103718
- 7 Magassy TB, Batur I, Mondal A, Asmussen KE, Bhat CR, Salon D, et al. Evolution of Mode Use During the COVID-19 Pandemic in the United States: Implications for the Future of Transit. Transportation Research Record: Journal of the Transportation Research Board. 2024;2678(12):567-579. doi: 10.1177/03611981231166942
- 8 Smith BV, Robbennolt D, Bhat CR. An evaluation of the long-term effects of the COVID-19 pandemic on public transit use in the United States. Transport Policy. 2025;169:90-100. doi: 10.1016/j.tranpol.2025.04.027
- 9 Liu Y, Osorio J, Ouyang Y. How long it took transit ridership to recover from disruptive events: A review into the recent history. Journal of Public Transportation. 2023;25:100051. doi: 10.1016/j.jpubtr.2023.100051
- 10 Abdollahpour SS, Le HTK, Hankey S. Changes in the predictors of transit ridership in post-COVID-19 US metropolitan areas. Travel Behaviour and Society. 2025;40:101002. doi: 10.1016/j.tbs.2025.101002
- 11 Karner A, LaRue S, Klumpenhouwer W, Rowangould D. Evaluating public transit agency responses to the Covid-19 pandemic in seven U.S. regions. Case Studies on Transport Policy. 2023;12:100989. doi: 10.1016/j.cstp.2023.100989
- 12 Kar A, Carrel AL, Miller HJ, Le HTK. Public transit cuts during COVID-19 compound social vulnerability in 22 US cities. Transportation Research Part D: Transport and Environment. 2022;110:103435. doi: 10.1016/j.trd.2022.103435
- 13 Jiao J, Hansen K, Azimian A. Disparities in the Impacts of the COVID-19 Pandemic on Public Transit Ridership in Austin, Texas, U.S.A. Transportation Research Record: Journal of the Transportation Research Board. 2023;2677(4):287-297. doi: 10.1177/03611981231159906
- 14 Osorio J, Liu Y, Ouyang Y. Executive orders or public fear: What caused transit ridership to drop in Chicago during COVID-19?. Transportation Research Part D: Transport and Environment. 2022;105:103226. doi: 10.1016/j.trd.2022.103226
- 15 von Elm E, Altman DG, Egger M, Pocock SJ, Gøtzsche PC, Vandenbroucke JP. The Strengthening the Reporting of Observational Studies in Epidemiology (STROBE) statement: guidelines for reporting observational studies. The Lancet. 2007;370(9596):1453-1457. doi: 10.1016/s0140-6736(07)61602-x
- 16 Benchimol EI, Smeeth L, Guttmann A, Harron K, Moher D, Petersen I, et al. The REporting of studies Conducted using Observational Routinely-collected health Data (RECORD) Statement. PLoS Med. 2015;12(10):e1001885. doi: 10.1371/journal.pmed.1001885
- 17 Hightower A, Ziedan A, Guo J, Zhu X, Brakewood C. A comparison of time series methods for post-COVID transit ridership forecasting. Journal of Public Transportation. 2024;26:100097. doi: 10.1016/j.jpubtr.2024.100097
- 18 Federal Transit Administration. Complete Monthly Ridership (with Adjustments and Estimates) [Internet]. 2026. Available from: https://data.transportation.gov/Public-Transit/Complete-Monthly-Ridership-with-Adjustments-and-Est/8bui-9xvu
- 19 Yu F, Batur I, Haddad AJ, Hennessy EM, Rodriguez Ocana MG, Chen C, et al. A U-shaped paradigm: understanding the impact of telecommuting on public transit ridership before and after the pandemic. Transportation Research Part A: Policy and Practice. 2026;211:105128. doi: 10.1016/j.tra.2026.105128
- 20 Light E, Osorio J, Liu Y, Ouyang Y. How COVID-19 impacted Chicago Metra’s ridership loss and recovery: 2019–2022. Transportation Research Part D: Transport and Environment. 2025;146:104857. doi: 10.1016/j.trd.2025.104857
- 21 Liu Y, Osorio J, Ouyang Y, Ayvalik C, Abraham C. COVID-19’s Impacts on Chicago Transit Authority Rail and Bus Ridership in Northeastern Illinois. Transportation Research Record: Journal of the Transportation Research Board. 2025;2679(6):631-647. doi: 10.1177/03611981251320393
- 22 Li M, Rodriguez DA, Pike S, McNally M. Rail transit ridership changes in COVID-19: Lessons for station area planning in California. Journal of Urban Mobility. 2025;8:100153. doi: 10.1016/j.urbmob.2025.100153
- 23 Cui M, Yu L, Dai Z, Wu Y, Wang Y, Cao J. Metro ridership recoverability and the built environment: Exploring station-level non-linear impacts. Transportation Research Part D: Transport and Environment. 2025;147:104852. doi: 10.1016/j.trd.2025.104852
- 24 Mahmoudzadeh A, Elgart Z, Walk M, Rodman W, Arezoumand S. Analysis of the impacts of COVID-19 on the performance of Texas transit agencies. Case Studies on Transport Policy. 2023;14:101069. doi: 10.1016/j.cstp.2023.101069
- 25 Qiang D, McKenzie G. Navigating the post-pandemic urban landscape: Disparities in transportation recovery & regional insights from New York City. Computers, Environment and Urban Systems. 2024;110:102111. doi: 10.1016/j.compenvurbsys.2024.102111
- 26 Sarker R, Currie G, Reynolds J. The pandemic is over but riders still fear infection − An extended behavioural model explaining post-pandemic transit avoidance related to perceived infection fear. Transportation Research Part A: Policy and Practice. 2025;192:104363. doi: 10.1016/j.tra.2024.104363
- 27 Soria J, Edward D, Stathopoulos A. Requiem for transit ridership? An examination of who abandoned, who will return, and who will ride more with mobility as a service. Transport Policy. 2023;134:139-154. doi: 10.1016/j.tranpol.2023.02.016
- 28 Tiznado-Aitken I, Palm M, Farber S. Segmenting transit ridership: From crisis to opportunity. Transportation Research Part A: Policy and Practice. 2024;190:104239. doi: 10.1016/j.tra.2024.104239
- 29 Srinivasan S, Shamsuddin S, Cheng J. Bus ridership retention, place-based factors, and COVID-19 in the Boston area. Transportation Research Part A: Policy and Practice. 2025;196:104479. doi: 10.1016/j.tra.2025.104479
- 30 Chen A, Li W, Lee C, Towne SD, Zhong S, Ory MG. Ridership-Boosting Strategies for Transit Agencies with Different Characteristics: Insights from a Nationwide Survey. Transportation Research Record: Journal of the Transportation Research Board. 2025;2679(4):478-492. doi: 10.1177/03611981241292587
- 31 Kutela B, Shita H, Novat N, Ngotonie M, Kinero A, Langa N. Who is returning to normal ridership? A socio-demographic study on pre- and post-covid-19 public transit ridership in San Francisco. Journal of Transport & Health. 2025;43:102065. doi: 10.1016/j.jth.2025.102065
- 32 Pezeshknejad P, Palm M, Rowangould D. Public transit in transition: The “new normal” or a return to normal?. Transport Policy. 2025;171:1076-1089. doi: 10.1016/j.tranpol.2025.07.018
- 33 Forouhar A, Chapple K, Pokharel R, Allen J. Transit-driven resilience: Unraveling post-COVID-19 urban recovery dynamics. Journal of Transport Geography. 2025;128:104327. doi: 10.1016/j.jtrangeo.2025.104327
- 34 Chen P, Yang X, Zhang Y, Hu S. The resiliency of transit and ride-hailing system through the coronavirus pandemic: Lessons from six large US cities. Case Studies on Transport Policy. 2025;20:101470. doi: 10.1016/j.cstp.2025.101470
- 35 Guzmán Oros GC, Martínez García VM, Romero YD, Valdez Lizárraga PA, Reyes Machain JDJ, Morán Sánchez SA. User experience of urban public transport in Mazatlán: A preliminary review of a scale. SAP Transport, Mobility and Society. 2026;5:300. doi: 10.62486/tms2026300
- 36 Tyndall J. Fare-free transit in the United States: Effects on ridership, service, and finances. Transport Policy. 2026;187:104318. doi: 10.1016/j.tranpol.2026.104318
Declarations
Funding
No financing
Conflict of interest
None
Authorship contributions
Drafting – original draft: Rómulo Esteban Montilla, Edixon Chacón Guerrero.
Writing–review and editing: Rómulo Esteban Montilla, Edixon Chacón Guerrero.