

Abstract
Introduction: Road transport is one of the largest sources of energy-related CO2, and the degree to which its emissions have decoupled from economic growth is uneven across regions. Methods: An ecological longitudinal study aggregated 187 economies into seven World Bank regions for 2013-2023, combining JRC EDGAR IEA-EDGAR road transport CO2 (IPCC 2006 sector 1.A.3.b) with World Bank GDP at constant 2015 US dollars and applying the Tapio decoupling elasticity. Results: World road transport CO2 rose from 5,482.8 to 6,100.1 Mt (11.3%) while GDP grew 32.1%, an elasticity of 0.35 and weak decoupling. No region achieved absolute decoupling; elasticity ranged from 0.03 in North America to 0.76 in Sub-Saharan Africa. Per capita, global CO2 changed 0.2% against 19.0% GDP growth, an elasticity of 0.01, with three regions in per capita absolute decoupling. Sub-period elasticities were 0.51, 3.55 and 0.95. Conclusions: Road transport CO2 decoupled only relatively from economic growth between 2013 and 2023, with no region reaching absolute decoupling, and the pandemic interruption did not reverse the underlying coupling.
Keywords
road transport, carbon dioxide emissions, economic growth, decoupling, Tapio elasticity, world regions
INTRODUCTION
Motorized road transport ranks among the largest sources of carbon dioxide released by human activity, and its emissions have grown for decades in most parts of the world.( 1)
Vehicles on roads consume most of the oil used in the transport sector and account for the largest share of the sector's CO2.( 2)
The sector occupies this position because road mobility supports production, trade and daily access to work and services, so that the demand for movement tends to expand whenever income expands.( 3)
Its emissions have risen in step with motorization and freight growth, which makes the trajectory of the road sector a decisive input to any projection of the global carbon budget.( 1) The resulting tension between economic growth and greenhouse gas mitigation has made road transport one of the sectors that climate policy finds hardest to move, and the volume of emissions involved means that small differences in its growth path have large consequences for the global carbon budget.( 4)
The possibility that emissions can grow more slowly than the economy, or decline while it grows, has been formalized through the concept of decoupling, which distinguishes absolute decoupling, in which emissions fall as output rises, from relative decoupling, in which emissions rise but at a slower rate than output.(4)
Applied to transport, country-level work reports relative decoupling of CO2 from gross domestic product as the most common state. This pattern has been documented in Vietnam between 2011 and 2017, where transport emissions detached from GDP even though transport volumes remained coupled to it,( 5) and in China, where the economy as a whole was shown to decouple from carbon emissions.( 6)
Elasticity-based metrics in the Gulf economies point in the same direction.( 7) Assessments that cover longer periods find that several economies have decoupled transport CO2 from GDP growth since 1970,( 2) and a global comparison concluded that 49 of 164 countries had decoupled total CO2 emissions from economic growth, with Europe and Oceania further along than Africa, Asia and the Americas.( 8)
These studies differ in the emissions boundary applied to the road sector, in the price basis of GDP and in the way countries are grouped, which limits direct comparison across regions.
Most work concentrates on a single country, on a small group of economies or on subnational units,( 9,10) and the periods examined rarely span the full decade before and after the COVID-19 pandemic, an event that temporarily collapsed road traffic and then released a sharp rebound.
A consistent account of whether road transport CO2 has decoupled from economic growth across the major world regions, using a single emissions inventory and a single GDP series, is therefore lacking for 2013 to 2023. Such an account matters because it locates the regions in which growth is still being converted into additional road emissions, which is the information most relevant to climate and transport policy.
The objective of this study was to quantify the decoupling of road transport CO2 emissions from economic growth across world regions between 2013 and 2023, and to identify which regions show absolute or relative decoupling. The study describes regional emissions and gross domestic product in 2013 and 2023, estimates the Tapio decoupling elasticity for each region, classifies each region, and examines the sub-periods around the pandemic. It was hypothesized that higher-income regions show stronger decoupling than lower-income regions.
METHODS
Design and period
An ecological longitudinal study was conducted over 2013 to 2023. The units of analysis were the seven geographic regions defined by the World Bank: East Asia and Pacific, Europe and Central Asia, Latin America and the Caribbean, Middle East and North Africa, North America, South Asia and Sub-Saharan Africa. Regions rather than countries were chosen because the research question concerns the major geographic groupings, and because regional totals are more stable than individual country series, which are volatile for small economies. Regions were constructed by summing country-level series, which preserves a single definition of the road sector and of GDP across all units. Reporting followed the STROBE statement for observational studies.
Data sources
Road transport CO2 emissions were obtained from the EDGAR database of the European Commission Joint Research Centre, specifically the IEA-EDGAR CO2 file covering 1970 to 2023.( 1) Emissions correspond to fossil CO2 from road transportation, the IPCC 2006 category 1.A.3.b, and are expressed in gigagrams per country and year. The IEA-EDGAR compilation reconciles energy statistics with the EDGAR sectoral mapping and covers the whole study window, which makes the road sector directly comparable with the GDP series.
The file was downloaded on 28 October 2026 from the JEODPP open data repository of the Joint Research Centre. Gross domestic product at constant 2015 United States dollars, indicator NY.GDP.MKTP.KD, and total population, indicator SP.POP.TOTL, were obtained from the World Bank World Development Indicators through the World Bank API, retrieved in three pages per indicator, together with the country metadata that assigns each economy to a geographic region and an income group.( 11) Both sources are openly redistributable under their respective terms and required no authorization.
Variables
The exposure was regional gross domestic product and the outcome was regional road transport CO2. Country emissions were converted from gigagrams to megatonnes and GDP to trillions of 2015 United States dollars for presentation; these conversions do not alter the elasticities because each elasticity is a ratio of percentage changes. Region was treated as the stratification variable, with seven categories defined by the World Bank classification. Per capita variants were obtained by dividing each regional aggregate by the regional population, so that a region's per capita CO2 equals its total road transport CO2 divided by its total population. Two further grouping variables, the pre-pandemic and post-pandemic sub-periods, were defined to isolate the interruption associated with COVID-19.
Aggregation
Of the 208 economies with road transport emissions in the EDGAR file, 194 had a World Bank region classification. Economies without such classification, including Taiwan and several dependent territories, were excluded because they could not be assigned to a region, and they represented less than one percent of global road transport CO2. Duplicate country entries were checked in both sources and none were found; economies with more than one World Bank identifier were resolved to their current ISO3 code.
After requiring complete GDP in the anchor years 2013, 2019, 2020 and 2023, the final sample comprised 187 economies covering 98.8%% of EDGAR global road transport CO2 in 2013. No imputation was applied; economies with incomplete GDP in an anchor year were dropped rather than estimated, which keeps the series transparent.
The requirement of complete GDP in the anchor years guarantees that the full-period elasticity and every sub-period elasticity are computed on exactly the same set of economies, which is what makes them comparable. Regional totals were the sum of country values within each region, and the world total was the sum of the seven regions. The Middle East and North Africa region follows the current World Bank grouping, which includes Afghanistan and Pakistan.
Procedure
The road transport rows of the emissions file were selected by their IPCC 2006 code, joined to the World Bank region and GDP series by ISO3 country code, and restricted to economies with complete data in the anchor years. Unit conversions were applied at the country level before summation, and the regional and world totals were computed from the resulting country table. The same table was used for the full-period elasticities, the sub-period elasticities and the per capita sensitivity, so that differences between these quantities cannot arise from differences in coverage.
Statistical analysis
Decoupling was quantified with the Tapio elasticity, defined as the percentage change in road transport CO2 divided by the percentage change in GDP over the same period.( 4) An elasticity of one indicates proportional growth of emissions and output, an elasticity of zero indicates emissions that do not change as output rises, and a negative elasticity indicates emissions that fall while output rises. Elasticities were computed for the full period 2013 to 2023 and for three sub-periods, 2013-2019, 2019-2020 and 2020-2023, which separate the pre-pandemic trend, the pandemic shock and the recovery. Regions were classified according to the Tapio states: strong decoupling when GDP rose and CO2 fell, which corresponds to absolute decoupling; weak decoupling when both rose and the elasticity remained below 0.8, which corresponds to relative decoupling; expansive coupling when the elasticity lay between 0.8 and 1.2; and expansive negative decoupling above 1.2.
The recessive states apply when GDP fell. Because the complete population of economies with a World Bank classification was analyzed rather than a sample, the results are descriptive and no hypothesis tests were performed. As a sensitivity analysis, the elasticities were recomputed with per capita CO2 and per capita GDP, which removes the contribution of population growth and reveals whether the aggregate result is driven by more people rather than by more emissions per person. Because the analysis involves seven regions and three sub-periods, the number of comparisons is small and no correction for multiplicity was required. Analyses were conducted in Python 3.14 with pandas, NumPy and Matplotlib, and the analysis script was executed twice to confirm that the outputs were identical.
Ethical considerations
The study used aggregated, anonymized, publicly available secondary data and required no ethics approval.
RESULTS
Regional road transport CO2 emissions and gross domestic product
World road transport CO2 reached 6,100.1 Mt in 2023, up from 5,482.8 Mt in 2013, a rise of 11.3%% (Table 1). World GDP amounted to 93.17 trillion 2015 US dollars in 2023, from 70.54 trillion in 2013, an increase of 32.1%% (Table 2). Output therefore expanded almost three times faster than emissions over the decade. North America remained the largest emitting region in both years, and Sub-Saharan Africa remained the smallest.
Region | CO2 2013 (Mt) | CO2 2023 (Mt) | Change (%) |
|---|---|---|---|
East Asia and Pacific | 1296.6 | 1591.7 | 22.76 |
Europe and Central Asia | 1129.0 | 1215.1 | 7.63 |
Latin America and the Caribbean | 564.2 | 570.5 | 1.11 |
Middle East and North Africa | 547.9 | 616.8 | 12.59 |
North America | 1543.3 | 1555.1 | 0.77 |
South Asia | 223.5 | 336.3 | 50.47 |
Sub-Saharan Africa | 178.4 | 214.6 | 20.28 |
World | 5482.8 | 6100.1 | 11.26 |
Note: CO2 = carbon dioxide; Mt = megatonnes. Regions follow the World Bank geographic classification. Source: Own elaboration from the JRC EDGAR IEA-EDGAR CO2 dataset (IPCC 2006, sector 1.A.3.b_noRES) and the World Bank country classification.
Region | GDP 2013 (trillion 2015 US$) | GDP 2023 (trillion 2015 US$) | Change (%) |
|---|---|---|---|
East Asia and Pacific | 19.836 | 29.883 | 50.65 |
Europe and Central Asia | 19.748 | 23.694 | 19.98 |
Latin America and the Caribbean | 5.204 | 5.735 | 10.20 |
Middle East and North Africa | 3.271 | 4.294 | 31.27 |
North America | 18.844 | 23.943 | 27.06 |
South Asia | 2.091 | 3.660 | 75.06 |
Sub-Saharan Africa | 1.550 | 1.965 | 26.77 |
World | 70.544 | 93.173 | 32.08 |
Note: GDP = gross domestic product at constant 2015 US$; trillion = 10^12. Source: Own elaboration from the World Bank World Development Indicators (GDP, constant 2015 US$, indicator NY.GDP.MKTP.KD).
The growth of emissions was uneven across regions. South Asia recorded the largest relative increase, 50.5%%, from 223.5 to 336.3 Mt, followed by East Asia and Pacific with 22.8%%. Sub-Saharan Africa grew by 20.3%% and the Middle East and North Africa by 12.6%%. Europe and Central Asia occupied an intermediate position, with an increase of 7.6%%. The smallest changes were observed in Latin America and the Caribbean, 1.1%%, and in North America, 0.8%%, where emissions rose by less than one percentage point.
GDP also rose in every region, and its growth generally exceeded the growth of emissions. The fastest expansion was recorded in South Asia, 75.1%%, and in East Asia and Pacific, 50.6%%, the two regions with the strongest output growth. Growth was slowest in Latin America and the Caribbean, 10.2%%.
East Asia and Pacific overtook Europe and Central Asia as the second-largest regional economy over the period. In 2023 the descending order of regions by emissions was the same as in 2013: North America, East Asia and Pacific, Europe and Central Asia, Latin America and the Caribbean, the Middle East and North Africa, South Asia and Sub-Saharan Africa. Output grew faster than emissions in all seven regions, so the ratio of emissions to output fell everywhere, although to very different degrees.
Decoupling elasticity and classification, 2013 to 2023
The world Tapio elasticity was 0.35, corresponding to weak, or relative, decoupling (Table 3). No region showed strong decoupling, because road transport CO2 rose in all seven regions while GDP also rose. Elasticities ranged from 0.03 in North America to 0.76 in Sub-Saharan Africa. The lowest value, in North America, is the closest the analysis comes to absolute decoupling, since its emissions were nearly flat while its output rose by 27.1%%.
South Asia and Sub-Saharan Africa approached the coupling threshold of 0.8, with values of 0.67 and 0.76 respectively. Between these extremes, East Asia and Pacific registered 0.45, the Middle East and North Africa 0.40, Europe and Central Asia 0.38, and Latin America and the Caribbean 0.11. Europe and Central Asia, the Middle East and North Africa and East Asia and Pacific occupied the middle of the distribution, with elasticities close to the world value. The scatter of regional changes in CO2 against changes in GDP shows all points within the weak decoupling quadrant (Figure 1).
Region | CO2 change (%) | GDP change (%) | Elasticity | Decoupling state |
|---|---|---|---|---|
East Asia and Pacific | 22.76 | 50.65 | 0.45 | Weak decoupling |
Europe and Central Asia | 7.63 | 19.98 | 0.38 | Weak decoupling |
Latin America and the Caribbean | 1.11 | 10.20 | 0.11 | Weak decoupling |
Middle East and North Africa | 12.59 | 31.27 | 0.40 | Weak decoupling |
North America | 0.77 | 27.06 | 0.03 | Weak decoupling |
South Asia | 50.47 | 75.06 | 0.67 | Weak decoupling |
Sub-Saharan Africa | 20.28 | 26.77 | 0.76 | Weak decoupling |
World | 11.26 | 32.08 | 0.35 | Weak decoupling |
Note: Elasticity = percentage change in road transport CO2 divided by percentage change in GDP. Weak decoupling denotes relative decoupling; strong decoupling would denote absolute decoupling. Source: Own elaboration from the JRC EDGAR IEA-EDGAR CO2 dataset and the World Bank World Development Indicators.
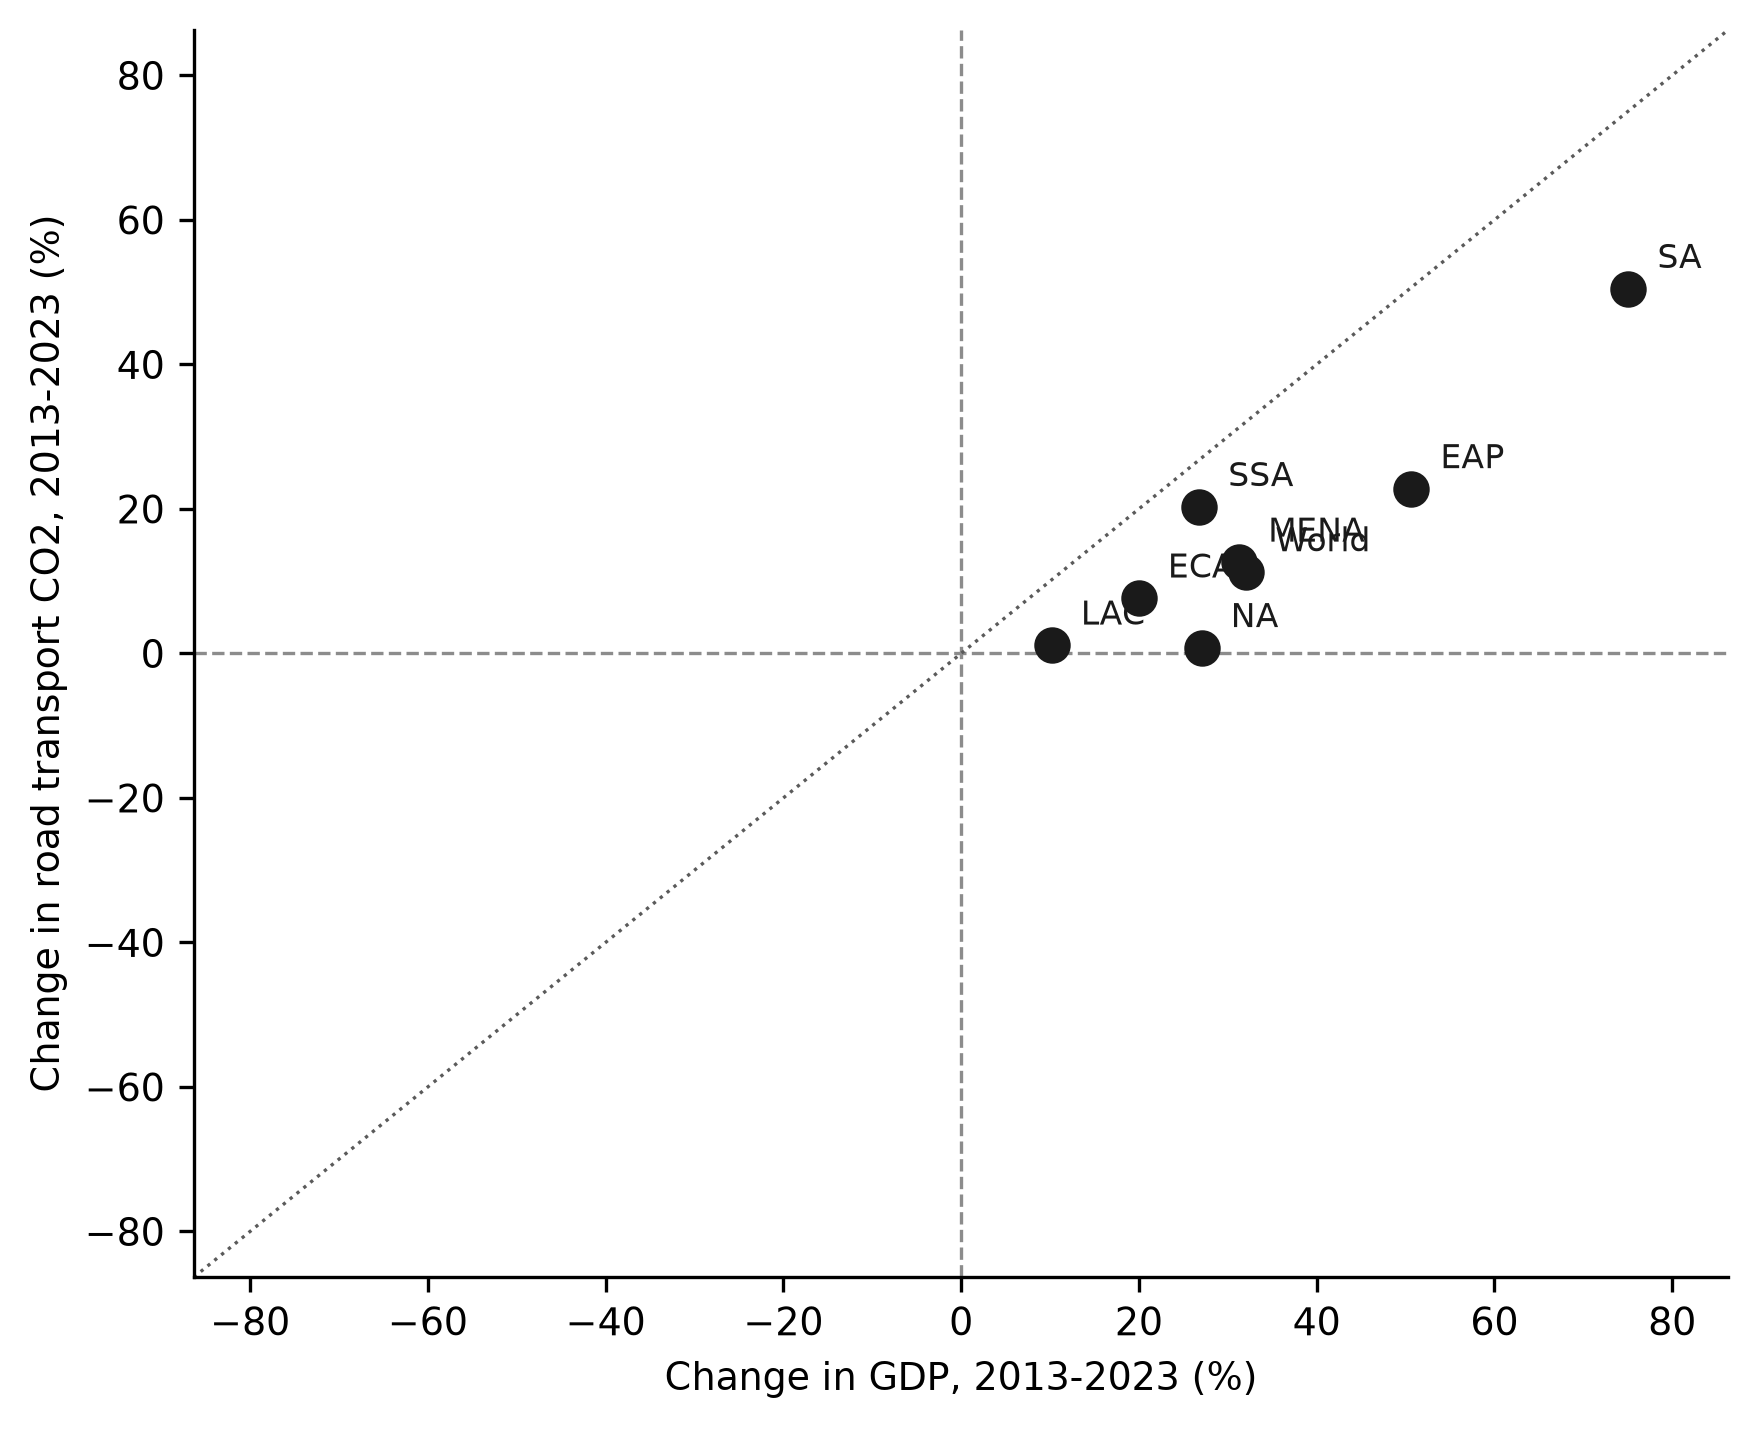
Figure 1. Change in road transport CO2 against change in GDP by world region, 2013-2023.
Note: The dashed lines mark zero change; the dotted line marks equal percentage change, an elasticity of 1. Source: Own elaboration from the JRC EDGAR IEA-EDGAR CO2 dataset and the World Bank World Development Indicators.Sub-period dynamics around the pandemic
Decoupling was not uniform across the decade (Table 4). Between 2013 and 2019 the world elasticity was 0.51, close to the full-period value, and every region except Sub-Saharan Africa stayed below the coupling threshold. Latin America and the Caribbean registered a negative pre-pandemic elasticity of −0.14, the only instance of absolute decoupling in any sub-period.
Between 2019 and 2020 GDP contracted in most regions and the world elasticity reached 3.55, a recessive decoupling in which emissions fell more than output; all seven regions were in a recessive state, with output and emissions falling together but emissions falling faster. Between 2020 and 2023 the rebound produced a world elasticity of 0.95, near the coupling threshold, and the elasticity exceeded 0.8 in every region except the Middle East and North Africa, where it was 0.72. Latin America and the Caribbean recorded the largest recovery elasticity, 1.68, exceeding one. The value of 43.22 for East Asia and Pacific in 2019-2020 reflects a near-zero regional GDP change in that year.
Region | 2013-2019 | 2019-2020 | 2020-2023 |
|---|---|---|---|
East Asia and Pacific | 0.53 | 43.22 | 0.92 |
Europe and Central Asia | 0.67 | 1.96 | 0.88 |
Latin America and the Caribbean | -0.14 | 2.57 | 1.68 |
Middle East and North Africa | 0.56 | 2.19 | 0.72 |
North America | 0.26 | 5.17 | 0.82 |
South Asia | 0.75 | 1.95 | 0.92 |
Sub-Saharan Africa | 1.11 | 2.87 | 0.98 |
World | 0.51 | 3.55 | 0.95 |
Note: Elasticity = percentage change in road transport CO2 divided by percentage change in GDP. The 2019-2020 value for East Asia and Pacific reflects a near-zero regional GDP change. Source: Own elaboration from the JRC EDGAR IEA-EDGAR CO2 dataset and the World Bank World Development Indicators.
Per capita sensitivity
Removing population growth changed the estimates. Global per capita road transport CO2 changed by 0.2%% between 2013 and 2023, against 19.0%% growth in per capita GDP, a per capita elasticity of 0.01. Three regions moved into strong per capita decoupling, with declining per capita emissions and rising per capita GDP: Latin America and the Caribbean, −6.7%%, the Middle East and North Africa, −5.5%%, and North America, −5.9%%. East Asia and Pacific and South Asia retained positive per capita elasticities of 0.39 and 0.62, and Europe and Central Asia recorded 0.28. In Sub-Saharan Africa per capita GDP fell by −2.5%% and per capita emissions fell by −7.5%%.
DISCUSSION
Between 2013 and 2023 road transport CO2 decoupled from economic growth only in relative terms across the world regions, and no region reached absolute decoupling.
The relative decoupling observed here is consistent with the country-level literature. Vietnam recorded decoupling of transport CO2 from GDP between 2011 and 2017 even though transport volumes remained coupled to output.( 5)
Analyses of transport CO2 and GDP since 1970 likewise describe relative rather than absolute decoupling in most economies.( 2)
Trend analyses of Mexico, Spain and the United States document decoupling of transport CO2 but with differences in pace among the three countries,( 9) and studies of China describe an economy that decoupled from total carbon while its transport emissions continued to rise.( 6)
At the aggregate level, a comparison of 164 countries found that only 49 had decoupled total emissions from growth, concentrated in Europe and Oceania, which parallels the finding that the highest-income regions sit closest to the frontier of decoupling.( 8) The regional values reported here place North America and Europe close to those high-income cases and place South Asia and Sub-Saharan Africa near the coupled end, which is what the income gradient would predict.
The ordering of elasticities followed the income gradient stated in the hypothesis, although not completely. The lowest elasticities appeared in North America, Europe and Central Asia and Latin America and the Caribbean; the highest appeared in South Asia and Sub-Saharan Africa. This is consistent with the challenge identified for developing countries, where transport emissions still grow in step with output and motorization.( 3)
The Gulf economies illustrate an intermediate case, in which elasticity-based metrics show transport emissions decoupling slowly from income and urbanization.( 7)
In the European Union, decoupling of CO2 from growth has advanced in the central and eastern member states,( 12) and energy transition pathways in the Union associate deeper decoupling with the decarbonization of electricity.( 13)
A time-varying test of the environmental Kuznets curve in France since 1890 finds that decoupling has strengthened only in the recent period.( 14)
Subnational evidence points in the same direction, with transport CO2 decoupling in Chinese regions varying with local economic structure,( 15,16) spatially resolved road inventories in Chile reflecting a similar dependence,( 17) and spatio-temporal analyses reporting heterogeneous decoupling states across space and time.( 18) In member countries of the Regional Comprehensive Economic Partnership, decoupling states and their drivers also differ with trade structure.( 19)
The elasticities also reflect the pace of growth, not only its carbon content. South Asia combined the fastest expansion of GDP with the fastest expansion of emissions, so its elasticity remained moderate even though its emissions grew strongly; Sub-Saharan Africa, with slower growth, appears closer to coupling despite a smaller absolute rise in emissions.
This dependence of the elasticity on the growth denominator means that the same underlying trend in the carbon intensity of output can be read as stronger or weaker decoupling depending on the phase of the economic cycle, which is a further reason to pair the elasticity with the levels reported in the tables.
The hypothesis was only partially supported. Although the richest regions, North America and Europe, did show the weakest coupling, the ordering was not a simple function of income. Latin America and the Caribbean, a middle-income region, decoupled more strongly than the Middle East and North Africa, which contains several high-income oil exporters, and South Asia coupled less than Sub-Saharan Africa despite comparable income levels. These exceptions suggest that the carbon intensity of the energy system and the dependence of the economy on oil matter as much as the level of income.
The result that no region achieved absolute decoupling differs from studies that report absolute decoupling of total carbon emissions from growth in some economies.( 6)
The discrepancy is explained by the boundary of the analysis. Economies can decouple total CO2 through changes in industry and the power mix while road transport remains coupled because vehicle stocks and travel demand continue to grow with income; the sector is, in that sense, slower to detach from output than the economy as a whole.
Several mechanisms explain why decoupling has remained relative. Road transport still runs almost entirely on fossil fuels, and the shift to electric vehicles has only begun to erode the link between distance travelled and emissions.( 20)
In regions with rising car ownership, such as India, projected growth in vehicle stock and energy demand keeps emissions rising with income.( 21)
The substitution of electricity for oil decarbonizes road transport only where the electricity itself is low-carbon,( 22) and early electric-mobility regions show that progress concentrates in cities with supporting infrastructure.( 23)
Freight activity, which expands with trade and construction, is a further source of coupling,( 24,25) and international trade relocates emissions relative to the income they generate,( 26) a pattern also visible in the decoupling of Chinese provinces through global value chains.( 27) Differences in the eco-performance of transport sectors reflect these technology and efficiency gaps.( 28)
The drivers of road transport decoupling also differ from those of total CO2. For the economy as a whole, the shift from coal to gas and renewables in the power sector can reduce emissions even while road fuels are unchanged, which is why total-CO2 decoupling can run ahead of road-transport decoupling in the same economy.( 6)
For road transport, the equivalent lever is the carbon intensity of the fuel and the energy intensity of the fleet, both of which change slowly because vehicle stocks turn over across a decade or more.( 20)
Electrification alters the fuel intensity only when the electricity is clean,( 22) and the early mobility leaders show how much depends on local charging infrastructure and urban form.( 23)
These slower stock dynamics explain why the road sector sits behind the power sector in the sequence of decoupling.
The pandemic produced a temporary break rather than a structural change. The 2019-2020 recessive decoupling, in which road CO2 fell faster than GDP, coincided with lockdowns that suppressed mobility,( 29,30) and the 2020-2023 rebound returned the world elasticity close to the coupling threshold.
Short-run evidence from China likewise indicates that the emissions reduction was transitory.( 31) Restrictions altered activity without changing the underlying technology and income drivers, so the interruption did not reverse the coupling.
The per capita analysis clarifies how much of the aggregate coupling is demographic. Once population growth is removed, the world per capita elasticity approaches zero, and three high-income regions move into absolute decoupling, meaning that emissions per person declined while income per person rose.
This is consistent with the finding that the association between per capita GDP and per capita CO2 has been weakening over time, and that only some high-income countries show a reversed association.( 8)
The contrast between the aggregate and per capita states indicates that population growth remains a substantial part of the growth in road emissions in several regions, and that the reductions per vehicle and per kilometre already visible in the richest regions have not yet been enough to turn total emissions downward.
The pre-pandemic window offers a related warning. Latin America and the Caribbean was the only region with a negative elasticity before 2020, indicating that its road emissions had begun to fall while output grew, but this early signal was erased by the pandemic and the subsequent rebound. The reversal illustrates how fragile absolute decoupling can be when it rests on a narrow margin rather than on a structural change in the fleet and in fuels, and it reinforces the conclusion that the full-period state of every region remained relative.
The interpretation of the thresholds also deserves care. The value of 0.8 that separates weak decoupling from expansive coupling is a convention rather than a statistical boundary, and the classification of a region can change with the price basis of GDP or with the inventory used for the road sector.
Constant 2015 prices attribute growth to real activity, whereas nominal prices would let inflation influence the elasticity, so part of the difference between the values reported here and those obtained with nominal GDP in other work can be traced to the deflator.( 4) The sector boundary is a second source of variation, because inventories differ in how they allocate fuels between road transport and other activities.( 1)
The study has several strengths. It applies one emissions inventory and one GDP series across all regions, which makes the elasticities directly comparable, and it covers a full decade that includes the pandemic. The coverage is nearly complete, since the included economies account for almost all of global road transport emissions, and the use of a single IPCC sector definition for the road sector avoids the boundary inconsistencies that complicate comparisons across the literature.
It also reports aggregate and per capita elasticities, separating the contribution of population growth from genuine decoupling, and it verifies the main result against a per capita specification rather than presenting a single estimate. Finally, the analysis is fully reproducible, because the data are public and the code regenerates every figure and table from the downloaded files.
Generalizing the results nevertheless requires care. The regions are broad, and several of them are dominated by a small number of large economies; North America, for example, is effectively three countries, so its elasticity is driven by a small number of fleets. Regional averages also smooth over the differences between large and small economies within each region. The consistent relative decoupling across all seven regions, obtained with one inventory and one deflator, is nonetheless a robust characterization of the road sector as a whole.
Several limitations qualify the interpretation. First, emissions rely on an inventory whose sector attribution and country totals may differ from national reports, so the results should be tested against national inventories. Second, regional aggregates conceal within-region heterogeneity, and country-level decomposition within each region would identify which economies drive the result.
Third, the exclusion of territories without a World Bank classification removes a small share of emissions, and the 2015 price basis of GDP does not capture differences in national price levels. Fourth, the Tapio elasticity is sensitive near zero GDP growth, as the 2019-2020 East Asia value shows, and complementary indices such as the Tapio-Z extension should be reported alongside it.( 32)
Fifth, the inventory does not publish uncertainty intervals for the road sector, so the precision of the elasticities cannot be quantified and they should be read as point values. Finally, the ecological design cannot attribute causality, and econometric models with additional covariates would be required to isolate policy effects.
From a policy perspective, the absence of absolute decoupling indicates that growth-oriented road transport systems continue to add CO2, and that fleet electrification, modal shift and fuel efficiency must accelerate if the sector is to contribute to climate targets. The per capita results suggest that high-income regions are closest to turning relative into absolute decoupling, while lower-income regions would need support to avoid repeating a high-carbon motorization path.( 3)
Fleet-level analyses in Canada and freight policy options in North Africa illustrate the levers available to weaken the coupling,( 33,34) and system dynamics models can support the design of such mitigation policies in the road sector.( 35)
The regional gradient also suggests differentiated priorities. In high-income regions the task is to convert near-flat emissions into absolute declines through accelerated fleet turnover, tighter standards and modal shift, a direction supported by fleet-level analyses.( 33)
In South Asia and Sub-Saharan Africa, where motorization is still rising, the priority is to avoid locking in a high-carbon fleet through public transport, non-motorized infrastructure and early electrification.( 3)
The pandemic shows that demand-side reductions are achievable but only while restrictions last, which points to structural rather than episodic measures.( 31)
The policy arithmetic follows directly from the elasticity. While the elasticity is positive, any further growth in output adds emissions, so meeting absolute climate targets requires the elasticity to become negative in the regions that are still growing, or requires growth itself to slow. The regions that are closest, North America and Latin America and the Caribbean, show that a negative elasticity is attainable when the fleet and its fuels change faster than the underlying demand for movement grows.( 20) The regions that are furthest, South Asia and Sub-Saharan Africa, face the harder task of decoupling while motorization is still expanding.( 21)
CONCLUSIONS
Across the seven world regions, road transport emissions and economic output both grew between 2013 and 2023, with the fastest emission growth in South Asia and the slowest in North America. The estimated Tapio elasticity was below one in every region, so decoupling was relative everywhere. Accordingly, no region was classified as absolutely decoupled over the full period. The sub-period analysis showed a pandemic-related interruption followed by a rebound toward coupling, and the per capita sensitivity moved three high-income regions into absolute decoupling. The persistence of relative decoupling across all regions indicates that stronger, region-specific measures will be required to bring road transport emissions onto a declining path.
References
- 1 European Commission, Joint Research Centre. GHG emissions of all world countries: 2024 report [Internet]. 2024 [cited 2026 Oct 28]. Available from: https://edgar.jrc.ec.europa.eu/dataset_ghg2024
- 2 Parker S. Assessing progress in decoupling transport CO2 emissions from GDP growth since 1970. Empir Econ. 2024;66(1):27-51. doi: 10.1007/s00181-023-02459-x
- 3 Foster V, Dim JU, Vollmer S, Zhang F. Understanding the challenge of decoupling transport-related CO2 emissions from economic growth in developing countries. World Development Sustainability. 2023;3:100111. doi: 10.1016/j.wds.2023.100111
- 4 Tapio P. Towards a theory of decoupling: degrees of decoupling in the EU and the case of road traffic in Finland between 1970 and 2001. Transport Policy. 2005;12(2):137-151. doi: 10.1016/j.tranpol.2005.01.001
- 5 Parker S. A decoupling analysis of transport CO2 emissions from economic growth: Evidence from Vietnam. International Journal of Sustainable Transportation. 2022;16(10):928-941. doi: 10.1080/15568318.2021.1952661
- 6 Wang Q, Jiang R. Is China's economic growth decoupled from carbon emissions?. Journal of Cleaner Production. 2019;225:1194-1208. doi: 10.1016/j.jclepro.2019.03.301
- 7 Melhim SH, Isaifan RJ. Economic Growth, Urbanization, and Transport Emissions: An Investigation of Elasticity-Based Decoupling Metrics in the Gulf. Economies. 2025;13(11):323. doi: 10.3390/economies13110323
- 8 Freire-González J, Padilla Rosa E, Raymond JL. World economies’ progress in decoupling from CO2 emissions. Sci Rep. 2024;14(1):20480. doi: 10.1038/s41598-024-71101-2
- 9 Percastre Gómez A, Bonilla D, Banister D. Decoupling transport-CO2 emissions: Mexico, Spain and The USA: A trend analysis. Transportation Research Part D: Transport and Environment. 2024;137:104510. doi: 10.1016/j.trd.2024.104510
- 10 Lee K, Jeon G. Decoupling Urban Development and Transport Carbon Emissions: A Hierarchical Regression of the TOD 7D Framework in the Seoul Metropolitan Area. Sustainability. 2025;17(23):10511. doi: 10.3390/su172310511
- 11 World Bank. World Development Indicators (GDP, constant 2015 US$; indicator NY.GDP.MKTP.KD) [Internet]. 2025 [cited 2026 Oct 28]. Available from: https://api.worldbank.org/v2/country/all/indicator/NY.GDP.MKTP.KD
- 12 Ziemblińska K, Urbaniak M, Jinlong H, Olejnik J, Kundzewicz ZW. Decoupling of economic growth and CO2 emissions in 11 European Union Member States in Central and Eastern Europe. Sustainable Energy Technologies and Assessments. 2025;82:104482. doi: 10.1016/j.seta.2025.104482
- 13 Bluszcz A, Manowska A, Mansor NS. Decoupling Economy Growth and Emissions: Energy Transition Pathways Under the European Agenda for Climate Action. Energies. 2025;18(19):5096. doi: 10.3390/en18195096
- 14 Saglam MS, Yilanci V, Kongkuah M. Decoupling economic growth and carbon emissions: a time-varying analysis of the environmental kuznets curve hypothesis in France (1890–2019). Environ Dev Sustain. 2025:102530. doi: 10.1007/s10668-025-06310-4
- 15 Cai J, Deng Z, Li L. High-resolution mapping of transport CO 2 emission in Beijing–Tianjin–Hebei region: Spatial-temporal characteristics and decoupling effects. International Journal of Sustainable Transportation. 2024;18(4):301-314. doi: 10.1080/15568318.2023.2299008
- 16 Zhang S, Li Y, Liu Z, Kou X, Zheng W. Towards a Decoupling between Economic Expansion and Carbon Dioxide Emissions of the Transport Sector in the Yellow River Basin. Sustainability. 2023;15(5):4152. doi: 10.3390/su15054152
- 17 Osses M, Rojas N, Ibarra C, Valdebenito V, Laengle I, Pantoja N, et al. High-resolution spatial-distribution maps of road transport exhaust emissions in Chile, 1990–2020. Earth Syst Sci Data. 2022;14(3):1359-1376. doi: 10.5194/essd-14-1359-2022
- 18 Simbi CH, Yao F, Zhang J, Lin J, Seka AM, Magati MT, et al. Decoupling for a greener future: a spatio-temporal analysis of CO2 emissions and economic growth. Environ Sci Pollut Res. 2023;31(46):56886-56900. doi: 10.1007/s11356-023-29622-2
- 19 Luo X, Zhao H. Evolution analysis of the decoupling state and drivers between economic growth and CO2 emissions in RCEP member countries. Energy Strategy Reviews. 2025;59:101709. doi: 10.1016/j.esr.2025.101709
- 20 Aslam B, Zhantian B, Amjad MA, Zhang G. Decarbonizing transport: EV production versus conventional vehicles. Transport Policy. 2025;174:103821. doi: 10.1016/j.tranpol.2025.103821
- 21 Krishna BA. Medium-term projections of vehicle ownership, energy demand and vehicular emissions from private road transport in India. Environ Dev Sustain. 2024;27(6):13839-13867. doi: 10.1007/s10668-024-04473-0
- 22 Helgeson B, Peter J. The role of electricity in decarbonizing European road transport – Development and assessment of an integrated multi-sectoral model. Applied Energy. 2020;262:114365. doi: 10.1016/j.apenergy.2019.114365
- 23 Tsoi KH, Loo BPY, Tal G, Sperling D. Pioneers of electric mobility: Lessons about transport decarbonisation from two bay areas. Journal of Cleaner Production. 2022;330:129866. doi: 10.1016/j.jclepro.2021.129866
- 24 Liimatainen H, Pöllänen M. The impact of sectoral economic development on the energy efficiency and CO2 emissions of road freight transport. Transport Policy. 2013;27:150-157. doi: 10.1016/j.tranpol.2013.01.005
- 25 M'raihi R, Mraihi T, Harizi R, Taoufik Bouzidi M. Carbon emissions growth and road freight: Analysis of the influencing factors in Tunisia. Transport Policy. 2015;42:121-129. doi: 10.1016/j.tranpol.2015.05.018
- 26 Wang S, Wang J, Fang C, Chen X, Liang J, Liu Y, et al. International Trade Reshapes the Decoupling of Emissions from Economic Growth. Environ Sci Technol. 2024;58(33):14662-14674. doi: 10.1021/acs.est.4c03995
- 27 Zheng J, Wu S, Li S, Lei Y, Li L, Fan X. Role of global value chain changes in decoupling CO2 emissions from economic growth in Chinese provinces. Structural Change and Economic Dynamics. 2025;72:193-208. doi: 10.1016/j.strueco.2024.09.016
- 28 Chen X, Miao Z, Wang K, Sun C. Assessing eco-performance of transport sector: Approach framework, static efficiency and dynamic evolution. Transportation Research Part D: Transport and Environment. 2020;85:102414. doi: 10.1016/j.trd.2020.102414
- 29 Hajmohammadi H, Salehi H. The Impacts of COVID-19 Lockdowns on Road Transport Air Pollution in London: A State-Space Modelling Approach. IJERPH. 2024;21(9):1153. doi: 10.3390/ijerph21091153
- 30 Gürbüz H, Şöhret Y, Ekici S. Evaluating effects of the Covid-19 pandemic period on energy consumption and enviro-economic indicators of Turkish road transportation. Energy Sources, Part A: Recovery, Utilization, and Environmental Effects. 2025;47(2):1889077. doi: 10.1080/15567036.2021.1889077
- 31 Pan S. The short-term impacts of COVID-19 outbreak on carbon emissions: causal evidence from China. Applied Economics Letters. 2025;32(2):263-269. doi: 10.1080/13504851.2023.2266566
- 32 Khan R, Zhuang W. Tapio-Z Decoupling of the Valuation of Energy Sources, CO2 Emissions, and GDP Growth in the United States and China Using a Fuzzy Logic Model. Energies. 2025;18(15):4188. doi: 10.3390/en18154188
- 33 Guo X, Kou R, He X. Towards Carbon Neutrality: Machine Learning Analysis of Vehicle Emissions in Canada. Sustainability. 2024;16(23):10526. doi: 10.3390/su162310526
- 34 Mraïhi R, Harizi R. Road Freight Transport and Carbon Dioxide Emissions: Policy Options for Tunisia. Energy & Environment. 2014;25(1):79-92. doi: 10.1260/0958-305x.25.1.79
- 35 Barisa A, Rosa M. A system dynamics model for CO2 emission mitigation policy design in road transport sector. Energy Procedia. 2018;147:419-427. doi: 10.1016/j.egypro.2018.07.112
Declarations
Funding
No financing
Conflict of interest
None
Authorship contributions
Drafting – original draft: Yennifer Díaz Romero, Yeimys Judith Diaz Herrera.
Writing–review and editing: Yennifer Díaz Romero, Yeimys Judith Diaz Herrera.