

Abstract
Introduction: Commute-time inequality is a central dimension of social inequality in Latin American cities, yet the gradient across Bogotá's socioeconomic strata has not been quantified with representative microdata. Methods: Cross-sectional secondary analysis of the 2021 Encuesta Multipropósito de Bogotá-Cundinamarca (DANE). The sample comprised employed Bogotá residents aged 15 years or older with a valid socioeconomic stratum and commute time (n = 68,175; weighted 2,355,227). Weighted means and weighted linear regression with sequential adjustment for age, sex and mode were used, followed by a decomposition of the stratum 1 versus stratum 6 gap. Results: Mean one-way commute time was 60.9 minutes in stratum 1 and 39.7 minutes in stratum 6, a crude gap of 21.2 minutes (95% CI 19.0 to 23.3). Strata 3 to 6 differed little. Public transport accounted for 61.3% of commutes in stratum 1 versus 15.1% in stratum 6, where private cars reached 71.1%. Working from home rose from 14.6% in stratum 1 to 62.1% in stratum 5. Mode explained only 8.7% of the gap; the fully adjusted gap remained 19.9 minutes (95% CI 17.7 to 22.1). Conclusions: Commute-time inequality in Bogotá is a bottom-of-distribution penalty that mode of transport only marginally explains, indicating that residential distance from employment drives most of the gap.
Keywords
commuting, travel time, mode choice, socioeconomic status, urban transport, Bogotá
INTRODUCTION
The unequal distribution of travel time is one of the most direct ways in which urban transport systems reproduce social inequality. Travel time is a scarce daily resource that households must allocate against work, care and rest, so a longer journey to work subtracts directly from the hours available for everything else. In Bogotá, a city of roughly eight million inhabitants organised into six official socioeconomic strata, the daily commute absorbs far more time for low-income residents than for the affluent, and the difference is widely attributed to where those residents can afford to live.
The city's income geography is stark: the affluent north and the low-income south and south-west flank a corridor of employment, so residential location largely predetermines the length of the trip to work. The stratum classification itself, originally designed to target utility subsidies, has become the reference frame for social policy in the city, yet its relationship with the experience of the daily commute has rarely been measured directly with representative microdata.
Logiodice and Giannotti( 1) argued that this geography of mobility injustice is a defining feature of cities in the Global South, where the transport system often deepens rather than compensates for residential disadvantage.
The socioeconomic gradient in commuting is documented in other Latin American and middle-income cities.
Bautista-Hernández( 2) identified disadvantaged groups with longer commutes in the Mexico City metropolitan area, and Santana Palacios and Rayle( 3) found that bus rapid transit shortened commutes in Barranquilla but with distributional effects that favoured some groups over others. Bittencourt and Giannotti( 4) showed that time, cost and transfer accessibility impose unequal burdens across classes and races in Brazilian cities.
Beyond the region, transport poverty and long journeys to work are consistently concentrated among low-income workers in Lagos( 5) and in Chinese cities.( 6) These studies establish that the gradient exists; what they rarely provide is a decomposition showing how much of it is attributable to the mode of transport rather than to the distance that separates residence from work.
For Bogotá the evidence is rich but leaves this question open. Guzman et al.( 7) estimated that accessibility to employment and study by public transport in the Bogotá region is lowest precisely in the low-income periphery, whereas Peña et al.( 8) reported that commuting inequalities widen as employment centres concentrate near higher-income areas.
Studies of specific groups and of capabilities describe unequal access in the same direction: domestic workers, who are among the lowest paid, endure some of the longest and least protected journeys,( 9) and the capability approach applied to Bogotá shows that accessibility is systematically lower for the poor.( 10)
Bocarejo and Urrego( 11) showed that formalising and integrating public transport improved social equity, which implies that mode availability matters.
The everyday mobility-work-household triad observed during the pandemic in the low-income peripheries of Lima and Bogotá( 12) further suggests that the commute cannot be understood in isolation from household obligations. Nonetheless, no representative analysis has quantified the gradient of commute time across the six strata or separated the contribution of mode from the residual that persists within each mode.
The absence of that decomposition matters for policy. If the gap were driven mainly by mode, then extending rapid transit and subsidising fares would be the obvious remedy. If instead it persists within modes, the binding constraint would be residential distance and spatial mismatch, which transport investment alone cannot undo. Lachapelle and Boisjoly( 13) argued that transport equity policies require the travel time of a trip to be broken into its components before remedies are chosen, and Karner et al.( 14) warned that equity measurement itself shapes which groups appear disadvantaged.
This study aimed to quantify differences in commute time to work and mode of transport across socioeconomic strata in Bogotá and to estimate the share of the lowest-versus-highest stratum gap in commute time that is associated with mode of transport. The analysis uses the official expansion factors of the survey, so the estimates describe the employed population of the city rather than a convenience sample of travellers. We hypothesised that commute time would be longer in lower strata and that mode of transport would account for a substantial part of the gap.
METHODS
Design and data source
We conducted a cross-sectional secondary analysis of anonymised individual microdata from the 2021 Encuesta Multipropósito de Bogotá-Cundinamarca, a probabilistic household survey carried out by the National Administrative Department of Statistics of Colombia (DANE).( 15)
The survey is the reference source for socio-demographic and living-conditions indicators of the capital region and uses a probabilistic, multi-stage, stratified sample with expansion factors that reproduce official population totals. It collects, among other modules, detailed information on the labour force, including the journey to work, and records the socioeconomic stratum of each dwelling.
The microdata were downloaded from the open DANE microdata catalogue, using four chapters: identification, dwelling and environment, household composition and demography, and labour force. The files were joined through the dwelling and person identifiers and analysed with the official person expansion factor, which weights each record to the population it represents.
Study population and variables
The study population comprised employed persons aged 15 years or older residing in Bogotá D.C. (municipality code 11001). We excluded persons whose main workplace was their own dwelling, because they have no journey to work, and records with a missing or invalid commute time. The analytic sample consisted of commuters with a socioeconomic stratum between 1 and 6 and a valid one-way commute time.
The outcome was one-way commute time to work in minutes, self-reported and including waiting time for the mode used. The exposure was the socioeconomic stratum of the dwelling, the six-level tariff classification used for utility billing in Colombia, where stratum 1 is the lowest and stratum 6 the highest. Covariates were age in years, sex, and primary mode of transport to work. Mode was derived from the fifteen-mode checklist of the labour force module and grouped into seven mutually exclusive categories: public transport (TransMilenio, SITP buses, bus or colectivo, intermunicipal bus, bicitaxi or mototaxi), private car, motorcycle, taxi or ride-hailing, active transport (walking, bicycle, electric micro-mobility), company transport, and other.
Statistical analysis
We described weighted means, medians and interquartile ranges of commute time and weighted percentages of mode use by stratum. Means are reported with Taylor-linearised 95% confidence intervals. To estimate the adjusted stratum gradient we fitted weighted linear regressions of commute time on socioeconomic stratum, with stratum 6 as the reference so that positive coefficients express the excess time of the lower strata.
Model 1 adjusted for age and sex, and model 2 additionally adjusted for mode of transport. The share of the crude stratum 1 versus stratum 6 gap associated with mode was computed as the attenuation of the age-and-sex-adjusted gap after adding mode, divided by the crude gap.
Heteroscedasticity-consistent (HC1) standard errors were used throughout, and the regression was repeated on the log scale as a sensitivity analysis because commute time is right-skewed. Missing values for the covariates were negligible among commuters; records with an invalid socioeconomic stratum or commute time were excluded, and the resulting counts are reported in the sample description.
The tariff stratum was retained as the exposure because it is the classification that social and transport policy in Bogotá actually uses, which makes the estimates directly translatable to that policy.(14)
RESULTS
The mean one-way commute of workers in stratum 1 exceeded that of stratum 6 by 53.3%, a crude difference of 21.2 minutes (95% CI 19.0 to 23.3) (Table 1).
Socioeconomic stratum | n | Weighted n | Age, mean (years) | Female (%) | Commute time, mean (95% CI) (min) | Commute time, median (P25-P75) (min) |
|---|---|---|---|---|---|---|
1 | 7785 | 234878 | 36.9 | 35.9 | 60.9 (59.7-62.0) | 60 (25-90) |
2 | 27180 | 1061947 | 38.2 | 39.7 | 50.4 (49.8-50.9) | 45 (20-60) |
3 | 22523 | 798035 | 39.8 | 43.0 | 39.8 (39.3-40.3) | 35 (15-52) |
4 | 7572 | 177390 | 41.7 | 46.9 | 40.3 (39.4-41.1) | 35 (20-45) |
5 | 1817 | 49052 | 43.3 | 46.5 | 39.2 (37.9-40.6) | 35 (20-50) |
6 | 1298 | 33925 | 43.7 | 43.4 | 39.7 (37.9-41.5) | 35 (20-60) |
All | 68175 | 2355227 | 39.0 | 41.2 | 46.7 (46.4-47.0) | 40 (20-60) |
Note: CI = confidence interval; P25-P75 = interquartile range. Weighted n is the population represented after applying the official expansion factor.
The gradient was not linear. Mean commute time stood at 60.9 minutes in stratum 1 and 50.4 minutes in stratum 2, then fell to a plateau between 39.8 and 40.3 minutes in strata 3 to 6, which differed little from one another (Figure 1). The median followed the same ordering, from 60 minutes in stratum 1 to 35 minutes in stratum 3 and above.
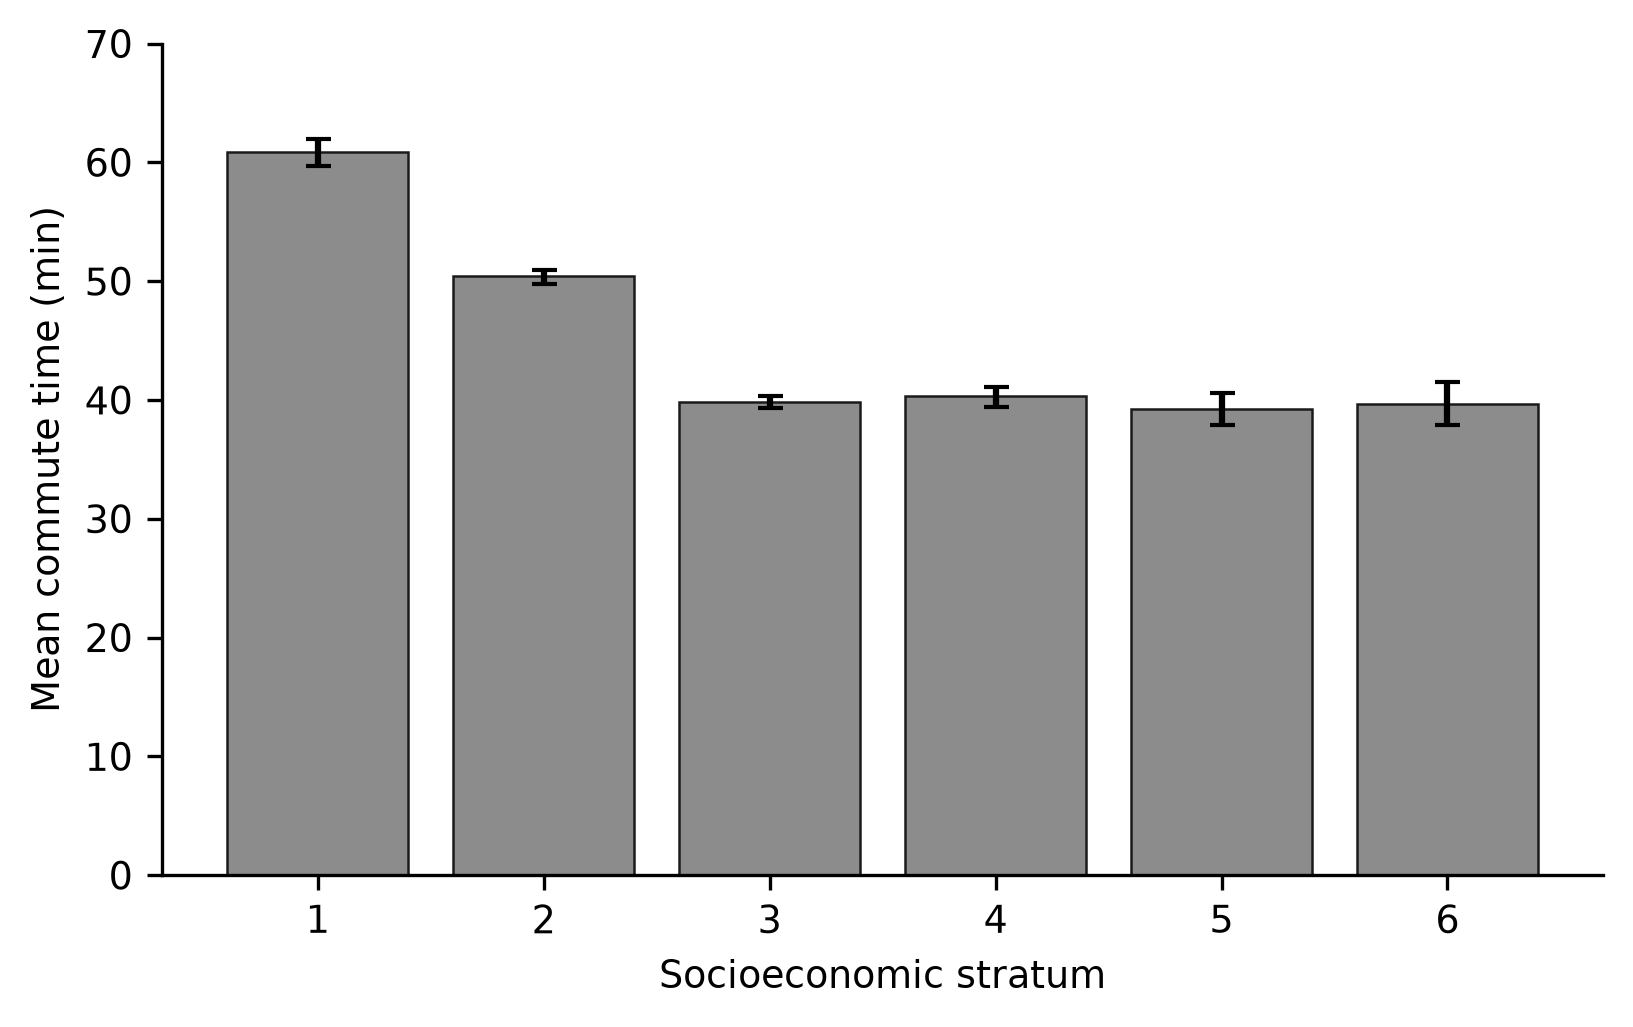
Figure 1. Weighted mean one-way commute time to work by socioeconomic stratum.
The distribution was right-skewed in every stratum. The interquartile range was widest in stratum 1, from 25 to 90 minutes, and narrower in the upper strata, where three quarters of commuters travelled 52 minutes or less.
Adjustment for age, sex and mode preserved this shape. Relative to stratum 6, the fully adjusted difference was 19.9 minutes (95% CI 17.7 to 22.1) for stratum 1 and 11.7 minutes (95% CI 9.7 to 13.7) for stratum 2, whereas strata 3 to 5 differed by less than two minutes and their confidence intervals included zero.
Mode use diverged sharply across strata. Public transport predominated in stratum 1, where it accounted for 61.3% of commutes, against 15.1% in stratum 6, a ratio of 4.1 (Table 2) (Figure 2).
Socioeconomic stratum | Public transport (%) | Private car (%) | Motorcycle (%) | Taxi or ride-hail (%) | Active (%) | Company transport (%) | Other (%) | Working from home (%) |
|---|---|---|---|---|---|---|---|---|
1 | 61.3 | 2.1 | 8.2 | 0.9 | 25.6 | 1.2 | 0.7 | 14.6 |
2 | 52.9 | 3.8 | 9.0 | 1.5 | 30.3 | 1.8 | 0.7 | 19.6 |
3 | 46.7 | 11.9 | 7.2 | 2.6 | 28.3 | 2.4 | 0.8 | 35.1 |
4 | 35.9 | 39.9 | 3.5 | 5.4 | 11.6 | 3.2 | 0.7 | 56.5 |
5 | 24.6 | 55.4 | 2.0 | 7.3 | 7.3 | 2.3 | 1.1 | 62.1 |
6 | 15.1 | 71.1 | 1.5 | 3.3 | 6.5 | 1.9 | 0.6 | 56.4 |
All | 49.2 | 11.1 | 7.7 | 2.2 | 27.0 | 2.1 | 0.7 | 31.6 |
Note: Values are weighted percentages of commuters, except working from home, which is the share of all employed residents of each stratum.
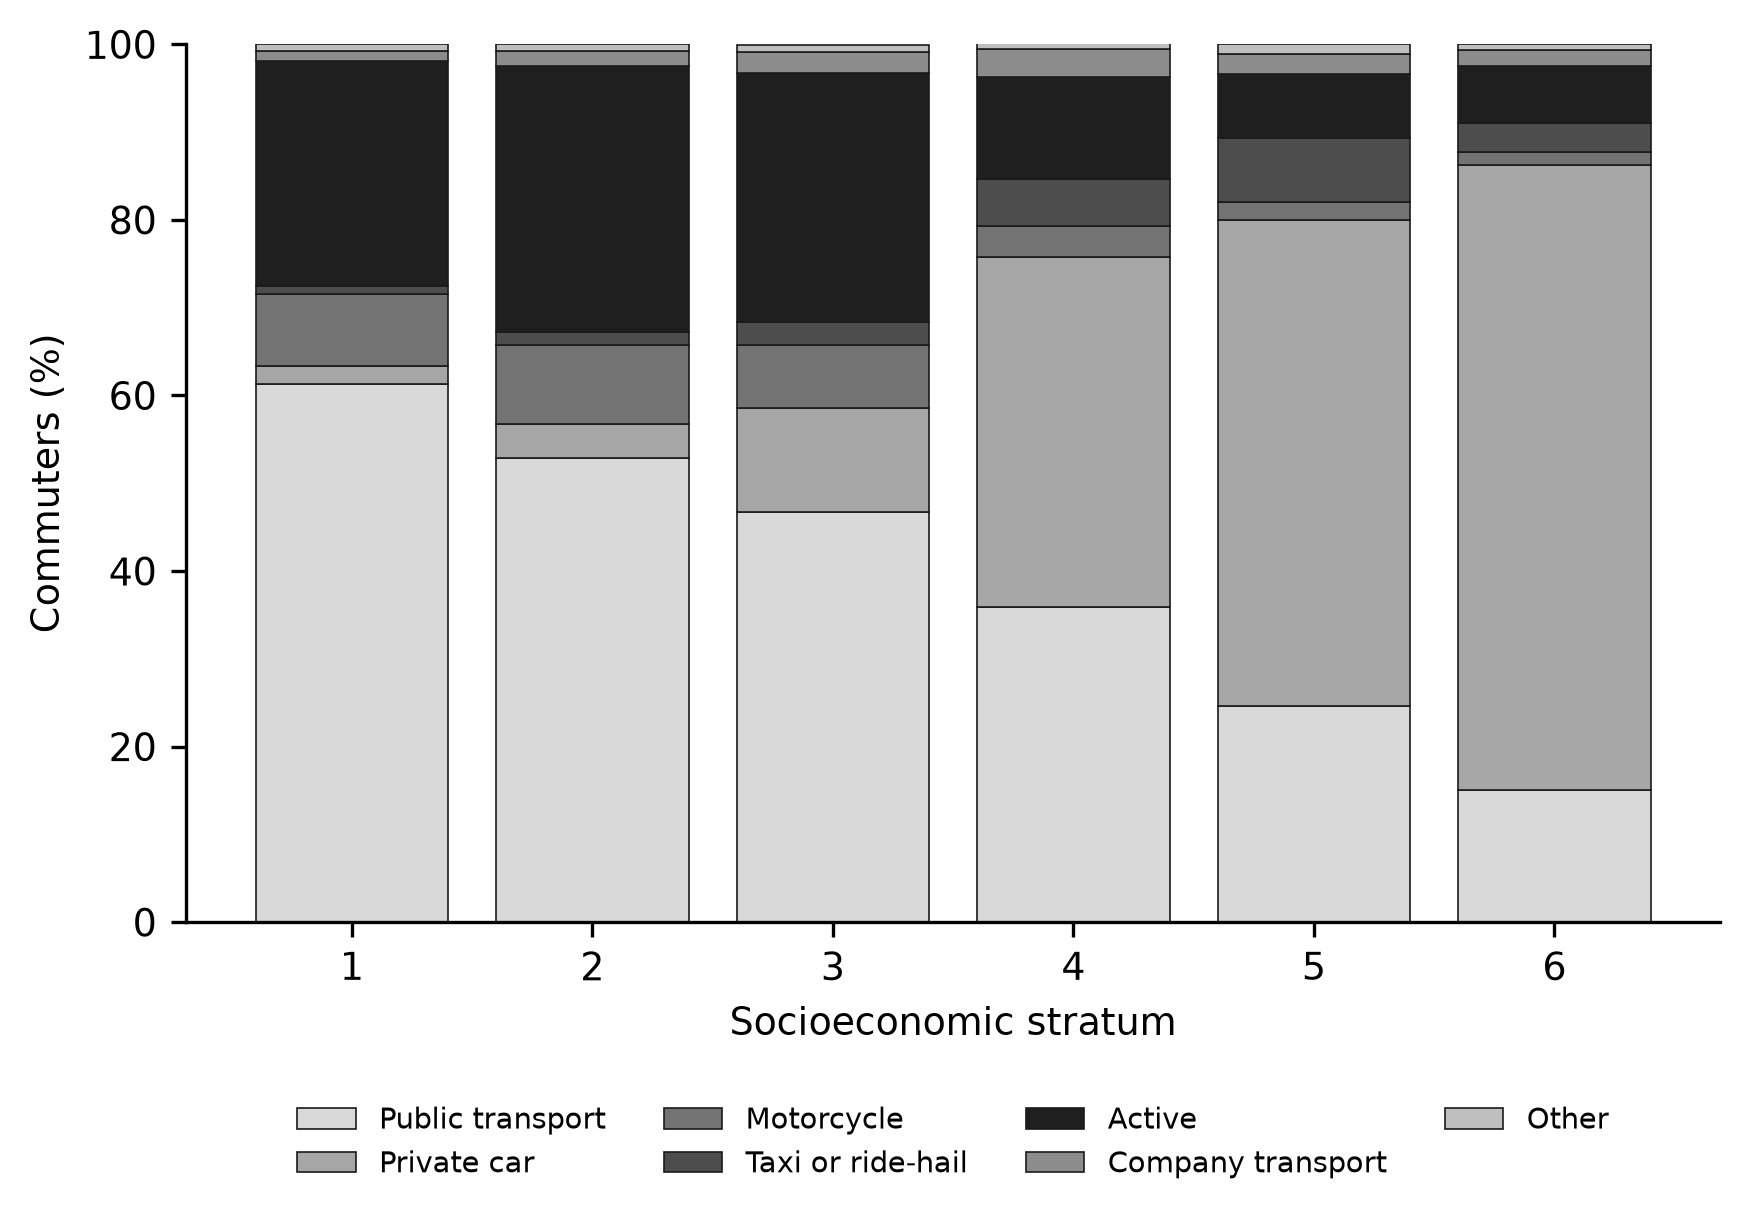
Figure 2. Mode of transport to work by socioeconomic stratum.
The private car showed the opposite pattern, reaching 71.1% in stratum 6 and 2.1% in stratum 1. The motorcycle was more frequent in the lower strata, at 8.2% in stratum 1 against 1.5% in stratum 6, whereas taxi or ride-hailing rose with stratum, from 0.9% to 3.3% (Table 2).
Active transport was concentrated in the lower strata, at 25.6% of commutes in stratum 1 and 30.3% in stratum 2, compared with 6.5% in stratum 6. Company transport remained a minor category in every stratum, never exceeding four per cent.
Working from home followed the same socioeconomic ordering as mode. The share of employed residents whose main workplace was their own dwelling rose from 14.6% in stratum 1 to 62.1% in stratum 5, a ratio of 4.3, before falling to 56.4% in stratum 6.
Adjusting for age and sex left the stratum 1 versus stratum 6 gap essentially unchanged at 21.7 minutes (95% CI 19.6 to 23.9). Adding mode attenuated it only to 19.9 minutes (95% CI 17.7 to 22.1), so mode accounted for 8.7% of the crude gap and 94.0% remained unexplained by the measured covariates.
The result was unchanged when commute time was log-transformed, and the pattern was stable across the sensitivity specification. The confidence intervals of the stratum-specific means were narrow overall, tightest around the large middle strata and widest around strata 5 and 6, whose unweighted counts were smallest. The crude stratum 1 versus stratum 6 gap excluded zero by a wide margin, and the adjusted gap did so as well.
The analytic sample comprised 68,175 commuters, representing 2,355,227 workers after weighting, with an overall weighted mean commute of 46.7 minutes (95% CI 46.4 to 47.0) and a median of 40 minutes. Stratum 2 and stratum 3 contributed the largest weighted counts, and strata 5 and 6 the smallest. Mean age rose from 36.9 years in stratum 1 to 43.7 years in stratum 6, and the female share from 35.9% in stratum 1 to 46.9% in stratum 4.
DISCUSSION
Contrary to the expectation that a poor worker's long commute is mainly a consequence of riding slow public transport, and contrary to the modal reading of commuting inequality proposed by Lachapelle and Boisjoly,( 13) mode of transport explained less than one tenth of the stratum gap.
Bautista-Hernández( 2) and Peña et al.( 8) located the main driver of commuting inequality in the spatial separation between homes and jobs, and our decomposition is consistent with that reading: the residual gap after accounting for age, sex and mode remained almost as large as the crude difference, which points to distance and residential location as the dominant channel rather than to the vehicle a worker boards.
The shape of the gradient also departs from the image of a smooth income gradient. Commute time fell steeply from stratum 1 to stratum 2 and then flattened, so that strata 3 to 6 were statistically indistinguishable after adjustment.
This bottom-of-distribution pattern matches evidence from Brazil, where Oliveira et al.( 16) found transport poverty concentrated in the lowest income groups, and from São Paulo, where Slovic et al.( 17) described overlapping job accessibility restrictions for the poorest workers. Unlike the more graded commutes reported in Canadian cities by Allen et al.,( 18) the Bogotá pattern is better described as a penalty on the lowest stratum than as a disadvantage spread across all strata.
The penalty is large in absolute terms. A stratum 1 worker who commutes in both directions five days a week spends roughly 3.5 additional hours travelling each week relative to a stratum 6 counterpart, time that compounds over the year and competes directly with care and rest.( 19) This weekly figure translates the single-trip estimate into the lived burden that the social exclusion literature treats as the mechanism connecting transport disadvantage to poverty.
The mode composition we observed reproduces a well-documented Latin American pattern. Public transport carried most workers in the lower strata, whereas the private car dominated the highest stratum, a split consistent with the accessibility analyses of Guzman et al.( 7) and with the car and motorcycle ownership gradients reported for Bogotá by Rodriguez-Valencia et al..( 20)
Guerra et al.( 21) likewise showed that urban form and transit supply structure travel behaviour across income groups in Latin America, which helps explain why the mode gradient is so steep even though mode explains little of the time gap.
The finer modal structure within each stratum reinforces the gradient. Cycling has been advanced as an affordable modal alternative in Bogotá,( 22) and its practice is more common among lower-income commuters,( 23) whereas motorcycle and ride-hailing services are adopted mainly by middle and higher income groups.( 24)
The evidence on e-bikes from São Paulo and Rio de Janeiro( 25) indicates that even new micromobility options can widen job accessibility gaps if their uptake follows income, which cautions against reading the active travel of the lower strata as a free choice rather than a consequence of constrained alternatives. The prominence of walking and cycling in the lower strata is equally consistent with the built environment and sociodemographic correlates of these modes in Bogotá.( 26)
Reading the active share of the lower strata as a preference would be misleading: cycling is practised more where alternatives are scarce,( 23) walking distances respond to the built environment of low-income neighbourhoods rather than to choice,( 26) and Oviedo and Sabogal-Cardona( 22) frame cycling as a mechanism for modal shift precisely because it is the affordable option for those the transport system has not served.
The working-from-home gradient is the finding that most clearly separates the strata. Telework and home-based work were more than four times as frequent in stratum 5 as in stratum 1, an ordering consistent with the socioeconomic gradient in mobility during the pandemic described for Bogotá's rapid transit demand.( 27)
Evidence from Brazil( 28) and Barcelona( 29) likewise indicates that telework substitutes work trips mainly among higher-income workers, and López Soler et al.( 30) linked telework and online shopping to socioeconomic position in Europe. This means the commuting burden is doubly concentrated: lower strata both commute longer when they do travel and enjoy far less access to the remote work that would remove the trip altogether.
Remote work operates as a form of commute relief that is itself stratified, so the groups that benefit most from avoiding the journey are the groups that needed the relief least. The pattern matches the Brazilian finding that telework substitutes work trips mainly where physical and virtual accessibility are already high,( 28) and the European evidence that telework and online shopping reinforce existing socioeconomic patterns of transport demand.( 30) If remote work persists, it will widen rather than narrow the commuting gap unless it is extended deliberately to the lower strata.
The mode gradient also carries a gender and labour dimension. Long commutes to low-wage jobs are disproportionately borne by women and by racialised workers in comparable North American labour markets,( 31) and in Bogotá the most exposed group, domestic workers, combines a low-paid occupation with long, multi-stage public transport journeys.( 9)
During the pandemic, mode captivity deepened among lower-income travellers in the region as restrictions removed alternatives for those without access to a private car.( 32) Our data show the same structural divide in a year in which the city had largely returned to normal travel.
Several mechanisms reconcile these findings. The first is residential sorting, whereby low-income households locate in peripheral areas where land is cheaper and jobs are scarce, a mechanism advanced for Bogotá by Oviedo et al.( 33) and for comparable metropolitan economies by Smith et al..( 34)
The second is the spatial mismatch between affordable housing and employment centres, which Peña et al.( 8) quantified for Bogotá and which Cui et al.( 35) framed as an equity problem of the journey to work in general.
The third is the uneven effect of transport improvements: bus rapid transit and cable cars have reduced travel times for some peripheral groups,( 36) but the benefits are not uniform across strata, as Santana Palacios and Rayle( 3) demonstrated for Barranquilla.
The dependence of the lower strata on public transport makes them captive riders in the strict sense: their travel times are set by the frequency and speed of a mode they cannot leave, and any deterioration of that service falls entirely on them. This dependence also means that land-use and transport interventions interact. Transit-oriented development that places affordable housing near the trunk corridors would shorten the trips of the captive population more than an equivalent investment in road capacity, which would be captured by the car-owning strata.
The Bogotá evidence on the formalisation of public transport reaches the same conclusion:(11) integration improved equity precisely because it served the strata that had no alternative.
The stability of strata 3 to 6 deserves comment. These strata concentrate in the consolidated centre and north of the city, closer to employment and to the trunk transit corridors, so their travel times converge even though their incomes and car ownership differ.
The finding mirrors the compact-city result of Smith et al.,( 34) in which accessibility inequality appears between occupational classes at the extremes rather than across every rung of the distribution. For Bogotá this implies that the policy target is narrower than the whole stratification: the lowest two strata, and above all stratum 1, are where the commuting penalty is concentrated.
In high-income cities the same pattern often takes a different form. McLafferty and Preston( 31) showed that long commutes to low-wage jobs in the New York region are shaped by race and gender as much as by income, and Allen et al.( 18) found extreme commuting rising in Canadian metropolitan areas.
The Bogotá case differs in that the stratification is inscribed in the dwelling and in the utility tariff, which makes the gradient administratively legible in a way that income or race alone is not. That legibility is an opportunity for targeting, but it also carries the risk of treating the stratum as the cause of the disadvantage when the operative mechanism is location.
Our estimate that mode accounts for only a small fraction of the crude gap should be read alongside studies that reach the opposite conclusion in other settings.
Lachapelle and Boisjoly( 13) argued that mode-specific trip components are essential for equity policy, Silver et al.( 37) showed that fare structure shapes distributional outcomes in Lisbon, and Braga et al.( 38) found that travel time inaccuracy and variability worsen socio-spatial inequalities in accessibility. The difference is one of geography: in Bogotá the lower strata already rely on public transport, so holding mode constant removes little of the gap, whereas the distance to employment, which the survey does not record, remains untouched.
This interpretation carries a policy implication that differs from a purely modal fix. Extending rapid transit to the periphery remains valuable, but it will not close the commute-time gap by itself. What the persistence of the within-mode gap suggests is that the binding constraint is residential distance, which transport policy alone cannot undo.
Policies that bring jobs closer to low-income areas, that support relocation, or that widen access to remote work address the channel that mode leaves unexplained. Mejía-Dorantes et al.( 29) reached a similar conclusion about the limits of transport policy when telework is unequally distributed, and the equity gains that Bocarejo and Urrego( 11) attributed to formalising public transport in Bogotá should be understood as necessary but not sufficient.
The instruments available to the city are therefore bounded. The tariff stratum is already used to target transport subsidies, and the results support focusing that targeting on strata 1 and 2 rather than spreading it across the middle.
Land-use planning that retains affordable housing near employment, together with the consolidation of the SITP network and the TransMilenio trunk lines, addresses the residential channel more directly than any fare measure. The cable car experience in the region shows that connecting peripheral settlements can reduce travel times for the poor,( 36) but only where those settlements remain connected to the labour market and where the surrounding street network allows the last mile to be travelled quickly.
The choice of the six-level tariff stratum, rather than a continuous income or expenditure measure, could be questioned on the grounds that it compresses within-stratum variation. The results suggest the opposite concern is more important: the gradient is so concentrated in the lowest stratum that a continuous measure might have understated the extremity of the disadvantage by averaging across the large middle. The stratum classification therefore served not as a convenience but as a lens that exposed the bottom penalty, and the confidence intervals show that the finding is not an artefact of small stratum-specific samples.( 14)
The main strength of this study is its use of official, population-representative microdata with expansion factors, which allows the stratum gradient to be measured directly rather than inferred from accessibility models. A second strength is the decomposition, which isolates the role of mode from the residual and thereby avoids overstating the importance of modal differences.
Karner et al.( 14) note that measurement choices in equity analyses are rarely neutral, and the choice of the tariff stratum as the exposure follows the classification actually used for social policy in Bogotá, which makes the results directly translatable to that policy.
Several limitations qualify these results. Commute time is self-reported and right-skewed, and the mean is sensitive to a small number of very long journeys, although the median showed the same pattern and the log-scale sensitivity was consistent. The survey records no trip distance, so the residual cannot be attributed to distance directly and is best read as the combined effect of residential location and other unmeasured factors.
The cross-sectional design precludes causal statements about mode or location, and the 2021 fieldwork coincided with pandemic-era restrictions that may have amplified the working-from-home gradient. The timing deserves emphasis: the survey was fielded while remote work was still elevated, so the working-from-home shares are likely an upper bound of the long-run tendency. If remote work recedes among the upper strata the commute-time gradient could narrow, and if it persists the gradient could widen. Either way, the structural gradient among those who do travel is the parameter most relevant to transport planning, and it was measured under conditions that make its persistence the more notable.
Hayvon( 19) notes that travel time, risk and cost interact in the geography of opportunity, and the built environment shapes mode choice in non-linear ways,(39) which suggests that future work should model distance and location explicitly.
These limitations suggest concrete refinements. Linking the same microdata to a network-based origin-destination distance measure would allow the residual to be attributed directly. Pooling the 2017 and 2021 rounds of the survey would reveal whether the gradient changed as the pandemic receded, and the effect of remote work on the strata could be tested as telework normalises. The comparison with Jakarta( 40) and Curitiba( 41) suggests that the same decomposition applied to other Latin American and Asian cities would clarify how much of the pattern is specific to Bogotá.
The distributional reading is consistent across the mean and the median. Because the mean is inflated by a small number of very long journeys, the median is the more conservative indicator, and it too places stratum 1 well above the rest. The interquartile range is widest in the lowest stratum, which shows that the burden is not uniform even within stratum 1: some of its workers travel very long distances while others live close to their jobs. This heterogeneity is exactly what aggregate means conceal, and it argues for reporting commuting equity as distributions rather than as single averages.( 14)
The results also speak directly to the concept of transport-related social exclusion, which treats the inability to reach opportunities as a mechanism through which transport disadvantage is converted into social disadvantage.
Bueno Rezende de Castro et al.( 5) traced this conversion in a low-income community in Lagos, and Kong et al.( 6) systematised it for Chinese cities, where transport poverty persists even where public transport is dense. In Bogotá the conversion is visible in the same stratum where the commute penalty, the dependence on public and active modes, and the scarcity of remote work coincide, which is precisely the profile that the exclusion framework predicts will be most affected.
The broader relevance of this decomposition for the Global South is that mode-based remedies are easy to propose and easy to oversell. Where the poor already use public transport, the commute-time gap cannot be closed by improving that same mode, because the gap lives in distance rather than in the vehicle.
Logiodice and Giannotti( 1) frame urban mobility injustice precisely as a question of where people are located and how much mobility they can command, and Kong et al.( 6) reach the same conclusion for Chinese cities, where transport poverty persists despite dense public transport.
Robert et al.( 12) show that the everyday mobility-work-household triad compounds these constraints in the low-income peripheries of Lima and Bogotá, which is exactly the population in which our stratum 1 penalty is concentrated.
CONCLUSIONS
Commute time to work in Bogotá was sharply stratified at the bottom of the socioeconomic distribution, with the lowest stratum bearing a commute-time penalty relative to the highest while the middle and upper strata remained statistically indistinguishable. Mode of transport was itself strongly stratified, with public and active travel dominating the lower strata and the private car dominating the highest, yet mode accounted for only a small fraction of the crude gap. The persistence of the gap within modes indicates that residential distance from employment, not the choice of mode, is the main channel of commute-time inequality in the city.
References
- 1 Logiodice PDCR, Giannotti M. Framing urban mobility injustice from the Global South. Urban Studies. 2025;62(11):2258-2274. doi: 10.1177/00420980241306676
- 2 Bautista-Hernández DA. Commuting inequality, role of urban structure, and identification of disadvantaged groups in the Mexico City metropolitan area. JTLU. 2020;13(1):159-183. doi: 10.5198/jtlu.2020.1611
- 3 Santana Palacios M, Rayle L. Shorter commutes, but for whom? Comparing the distributional effects of Bus Rapid Transit on commute times in Cape Town, South Africa, and Barranquilla, Colombia. JTLU. 2021;14(1):647-667. doi: 10.5198/jtlu.2021.1907
- 4 Bittencourt TA, Giannotti M. The unequal impacts of time, cost and transfer accessibility on cities, classes and races. Cities. 2021;116:103257. doi: 10.1016/j.cities.2021.103257
- 5 Bueno Rezendede Castro A, Ortega Sandoval AD, Odamtten G. Up around the bend? How transport poverty can lead to social exclusion in a low-income community in Lagos, Nigeria. Journal of Transport Geography. 2022;102:103388. doi: 10.1016/j.jtrangeo.2022.103388
- 6 Kong W, Pojani D, Sipe N, Stead D. Transport Poverty in Chinese Cities: A Systematic Literature Review. Sustainability. 2021;13(9):4707. doi: 10.3390/su13094707
- 7 Guzman LA, Oviedo D, Rivera C. Assessing equity in transport accessibility to work and study: The Bogotá region. Journal of Transport Geography. 2017;58:236-246. doi: 10.1016/j.jtrangeo.2016.12.016
- 8 Peña J, Guzman LA, Arellana J. Which dots to connect? Employment centers and commuting inequalities in Bogotá. JTLU. 2022;15(1):17-34. doi: 10.5198/jtlu.2022.2100
- 9 Montoya-Robledo V, Escovar-Álvarez G. Domestic workers’ commutes in Bogotá: Transportation, gender and social exclusion. Transportation Research Part A: Policy and Practice. 2020;139:400-411. doi: 10.1016/j.tra.2020.07.019
- 10 Oviedo D, Guzman LA. Revisiting Accessibility in a Context of Sustainable Transport: Capabilities and Inequalities in Bogotá. Sustainability. 2020;12(11):4464. doi: 10.3390/su12114464
- 11 Bocarejo JP, Urrego LF. The impacts of formalization and integration of public transport in social equity: The case of Bogota. Research in Transportation Business & Management. 2022;42:100560. doi: 10.1016/j.rtbm.2020.100560
- 12 Robert J, Pereyra O, Sáenz-Acosta H, Gouëset V. Accessibility and the ‘everyday mobility–work–household’ triad: an exploration during the COVID-19 crisis in low-income peripheries of Lima and Bogotá. Area Development and Policy. 2025;10(2):162-180. doi: 10.1080/23792949.2024.2320653
- 13 Lachapelle U, Boisjoly G. Breaking down public transit travel time for more accurate transport equity policies: A trip component approach. Transportation Research Part A: Policy and Practice. 2023;175:103756. doi: 10.1016/j.tra.2023.103756
- 14 Karner A, Pereira RHM, Farber S. Advances and pitfalls in measuring transportation equity. Transportation. 2025;52(4):1399-1427. doi: 10.1007/s11116-023-10460-7
- 15 Departamento Administrativo Nacional de Estadística (DANE). Encuesta Multipropósito Bogotá-Cundinamarca 2021: microdatos anonimizados [Internet]. 2021. Available from: https://microdatos.dane.gov.co/index.php/catalog/743
- 16 Oliveira R, Szklo A, Cruz T. Revealing transport poverty: A Brazilian application of the half-median metric. Energy and Climate Change. 2025;6:100226. doi: 10.1016/j.egycc.2025.100226
- 17 Slovic AD, Tomasiello DB, Giannotti M, Andrade MDF, Nardocci AC. The long road to achieving equity: Job accessibility restrictions and overlapping inequalities in the city of São Paulo. Journal of Transport Geography. 2019;78:181-193. doi: 10.1016/j.jtrangeo.2019.06.003
- 18 Allen J, Palm M, Tiznado-Aitken I, Farber S. Inequalities of extreme commuting across Canada. Travel Behaviour and Society. 2022;29:42-52. doi: 10.1016/j.tbs.2022.05.005
- 19 Hayvon JC. Reducing intersectional educational and social inequalities: a conceptual review of travel time, risk, cost in geographies of opportunity. Studies in the Education of Adults. 2024;56(2):137-157. doi: 10.1080/02660830.2024.2395251
- 20 Rodriguez-Valencia A, Ortúzar JDD, Mesa-Garcia S. Understanding the differences between car and motorcycle ownership. The case of Bogotá, Colombia. Journal of Transport Geography. 2024;114:103773. doi: 10.1016/j.jtrangeo.2023.103773
- 21 Guerra E, Caudillo C, Monkkonen P, Montejano J. Urban form, transit supply, and travel behavior in Latin America: Evidence from Mexico's 100 largest urban areas. Transport Policy. 2018;69:98-105. doi: 10.1016/j.tranpol.2018.06.001
- 22 Oviedo D, Sabogal-Cardona O. Arguments for cycling as a mechanism for sustainable modal shifts in Bogotá. Journal of Transport Geography. 2022;99:103291. doi: 10.1016/j.jtrangeo.2022.103291
- 23 Rosas-Satizábal D, Guzman LA, Oviedo D. Cycling diversity, accessibility, and equality: An analysis of cycling commuting in Bogotá. Transportation Research Part D: Transport and Environment. 2020;88:102562. doi: 10.1016/j.trd.2020.102562
- 24 Muchlisin M, Soza-Parra J, Ettema D. Adoption and frequency of motorcycle and car-based ride-hailing use across income groups in Yogyakarta, Indonesia. Transportation Research Part A: Policy and Practice. 2025;201:104671. doi: 10.1016/j.tra.2025.104671
- 25 Louro TV, Grigolon AB, Cunha AL, Geurs KT. E-bikes’ impact on job accessibility and equity in São Paulo and Rio. Transportation Research Part D: Transport and Environment. 2025;149:105072. doi: 10.1016/j.trd.2025.105072
- 26 Guzman LA, Peña J, Carrasco JA. Assessing the role of the built environment and sociodemographic characteristics on walking travel distances in Bogotá. Journal of Transport Geography. 2020;88:102844. doi: 10.1016/j.jtrangeo.2020.102844
- 27 Caicedo JD, Walker JL, González MC. Influence of Socioeconomic Factors on Transit Demand During the COVID-19 Pandemic: A Case Study of Bogotá’s BRT System. Front Built Environ. 2021;7:642344. doi: 10.3389/fbuil.2021.642344
- 28 Pedreira Junior JU, Pitombo CS. Unveiling substitution patterns of work trips by teleworking and their associations with physical and virtual accessibility in the Brazilian COVID-19 crisis. Travel Behaviour and Society. 2024;34:100657. doi: 10.1016/j.tbs.2023.100657
- 29 Mejía-Dorantes L, Montero L, Barceló J. Discussing teleworking and travel implications in Barcelona from a gender perspective. Journal of Transport Geography. 2025;126:104251. doi: 10.1016/j.jtrangeo.2025.104251
- 30 López Soler J, Christidis P, Vassallo J. Teleworking and Online Shopping: Socio-Economic Factors Affecting Their Impact on Transport Demand. Sustainability. 2021;13(13):7211. doi: 10.3390/su13137211
- 31 McLafferty S, Preston V. Who has long commutes to low-wage jobs? Gender, race, and access to work in the New York region. Urban Geography. 2019;40(9):1270-1290. doi: 10.1080/02723638.2019.1577091
- 32 Puello LP. Impact of COVID-19 restrictions on mode use and mode captivity the city of Santo Domingo in Latin America. Transportation Research Interdisciplinary Perspectives. 2022;13:100515. doi: 10.1016/j.trip.2021.100515
- 33 Oviedo D, Guzmán LA, Oviedo-Dávila N. Productive exclusion: Accessibility inequalities and informal employment in Bogotá. Geoforum. 2025;159:104208. doi: 10.1016/j.geoforum.2025.104208
- 34 Smith DA, Shen Y, Barros J, Zhong C, Batty M, Giannotti M. A compact city for the wealthy? Employment accessibility inequalities between occupational classes in the London metropolitan region 2011. Journal of Transport Geography. 2020;86:102767. doi: 10.1016/j.jtrangeo.2020.102767
- 35 Cui B, Boisjoly G, El-Geneidy A, Levinson D. Accessibility and the journey to work through the lens of equity. Journal of Transport Geography. 2019;74:269-277. doi: 10.1016/j.jtrangeo.2018.12.003
- 36 Cardona-Urrea S, Soza-Parra J, Ettema D. Aerial cable cars as a transit mode: a review of technological advances, service area characteristics, and societal impacts in Latin America and the Caribbean. Transport Reviews. 2024;44(3):684-708. doi: 10.1080/01441647.2023.2294752
- 37 Silver K, Lopes A, Vale D, da Costa NM. The inequality effects of public transport fare: The case of Lisbon's fare reform. Journal of Transport Geography. 2023;112:103685. doi: 10.1016/j.jtrangeo.2023.103685
- 38 Braga CKV, Loureiro CFG, Pereira RHM. Evaluating the impact of public transport travel time inaccuracy and variability on socio-spatial inequalities in accessibility. Journal of Transport Geography. 2023;109:103590. doi: 10.1016/j.jtrangeo.2023.103590
- 39 Yu M, Tong Z, Yang J, Lu Y, Liu Y, Liu Y, et al. Nonlinear relationship between built environment and commute mode choice: A comparison of commuters within and beyond the long commute threshold. Journal of Transport Geography. 2025;129:104430. doi: 10.1016/j.jtrangeo.2025.104430
- 40 Andani IGA, Qamilla N, Izdihar RP, Safira M, Sakti AD, Syabri I. Spatial, mobility, or socio-economic inequity? A district level job accessibility evaluation in Jakarta, Indonesia. International Journal of Urban Sciences. 2025:1-29. doi: 10.1080/12265934.2025.2553714
- 41 Araujo ASD, Massucheto J, Bugs GT, Saraiva MVP, Duarte F. Unveiling inequalities: The intersection of gender and income in accessibility in Curitiba, Brazil. Journal of Transport Geography. 2025;123:104136. doi: 10.1016/j.jtrangeo.2025.104136
Declarations
Funding
No financing
Conflict of interest
None
Authorship contributions
Drafting – original draft: Libardo Ramón Polanía, Carlos Alberto Gómez Cano, Juan Ernesto Pérez-Pérez.
Writing–review and editing: Libardo Ramón Polanía, Carlos Alberto Gómez Cano, Juan Ernesto Pérez-Pérez.