

Abstract
Sexual harassment in public transport is a pervasive form of gender-based violence that constrains women's mobility and safety worldwide. Twenty-four studies met the eligibility criteria. Reported prevalence of sexual harassment in public transport ranged from 50.8% in Ethiopia to 92% in Kathmandu, Nepal. Harassment consistently increased route alteration and travel avoidance, and perceived insecurity reduced women's daily mobility. Evaluations of women-only facilities, reporting campaigns and design measures showed variable and often unverified effectiveness. Sexual harassment in public transport is widespread, restricts women's mobility and is only partially addressed by current interventions. Standardised prevalence measures and rigorous evaluation of prevention strategies are needed.
Keywords
sexual harassment, women's safety, public transport, fear of crime, travel behaviour, gender-based violence
INTRODUCTION
Public transport is one of the urban settings in which women most often experience sexual harassment, a form of gender-based violence that spans staring, verbal abuse, unwanted touching and assault. The problem entered the global policy agenda after the gang rape and murder of a woman on a bus in Delhi in 2012, an event that forced transport authorities and researchers to treat safety in transit as a gendered condition of access rather than a neutral by-product of service quality. Between 2013 and 2015, the first empirical studies quantified the problem in Latin America, South Asia and Europe, and by 2017 international agencies had consolidated harassment in public spaces as a priority of the safe cities agenda.( 1,2)
From that point onward, the field moved from prevalence descriptions toward two harder questions: how harassment changes the way women travel, and whether interventions actually reduce it.( 3) Between 2018 and 2025 the empirical record expanded sharply, and the balance of studies shifted from single city prevalence surveys toward comparative and design oriented designs.
The scale reported by individual studies leaves little room for treating harassment as a marginal concern. Across the European Union, one in two women reported having experienced sexual harassment at least once since the age of 15, with a substantial share of episodes occurring in or around transport.( 2)
Comparable or higher figures appear in the global South, where harassment concentrates in buses, minibuses and informal paratransit.( 4,5)
Early surveys in the United States likewise showed that women's fear of victimisation in transportation settings was widespread and systematically higher than men's, a gap that planners had long ignored and that shaped the first generation of transit safety programmes.( 6) The evidence therefore indicates that harassment is a structural feature of women's experience of public transport, not the pathology of a few unsafe lines.( 7)
The consistency of these figures across independent surveys, from the European Union to the global South, indicates that the problem is not confined to any single region or level of development.( 4)
The consequences extend well beyond the incident itself. Women who fear harassment alter the time, mode and route of their trips, avoid travelling after dark and sometimes forgo travel altogether, which reduces access to employment, education and services.( 4,8)
The burden is not distributed equally: women with low incomes often remain captive users of the very modes where harassment is most frequent, while women with disabilities face additional invisible barriers that compound their exposure.( 9)
Transit safety is therefore inseparable from mobility justice, and the absence of safe transport operates as a daily tax on women's participation in urban life.( 5)
This framing has moved gender sensitive transport from the margins of planning to the centre of debates on equitable cities, and has made safety a criterion against which transport investment is judged.( 10)
The economic dimension is increasingly documented as well, because the foregone trips and constrained labour participation that follow from harassment carry measurable costs for women and for the cities that depend on their work.( 5)
Part of the difficulty in responding to the problem is measurement. Prevalence estimates depend on how harassment is defined, whether the recall window covers the past month or the whole life course, and whether the denominator is all women, students or public transport users, so figures that appear contradictory often reflect different instruments rather than different realities.( 2)
Studies also mix experienced victimisation with perceived fear, two constructs that are correlated but distinct, and underreporting means that official records capture only a fraction of incidents.( 3)
The absence of a shared definition has practical consequences: agencies cannot benchmark their systems against one another, and interventions cannot be judged against a common baseline. A synthesis therefore has to read prevalence, behaviour and interventions together, and has to state explicitly what each study measured, before it can say what the field actually knows.
Existing syntheses have addressed parts of this picture but not the whole. Reviews published through 2023 summarised transit crime and sexual violence at the level of cities and stations, or focused on single regions, single modes or single outcomes.( 3,11)
Methodological reviews examined fear of crime in transit but did not isolate sexual harassment from property crime or general insecurity.( 12)
None combined, within one PRISMA framework, the three questions that policy makers ask together: how common harassment is, how it shapes women's travel, and what works to prevent it. The rapid growth of open access studies between 2018 and 2025 made such a synthesis feasible for the first time, because the relevant empirical record is now large enough to support systematic comparison.
Our objective was to synthesise the evidence on sexual harassment against women in public transport, its consequences for women's travel behaviour and the effectiveness of interventions designed to prevent it. The review question, framed with the PECO scheme, was: among women who use public transport, what is the prevalence of sexual harassment, how does it affect their travel choices, and what is the effectiveness of interventions?
METHODS
This systematic review followed the PRISMA 2020 statement for reporting.( 13) Studies were eligible when they reported primary data on sexual harassment, sexual violence or women's safety in public transport and were published between 1 January 2013 and 01 June 2025. The population comprised women and girls who use public transport, including bus, bus rapid transit, rail, metro, auto rickshaw, ride hailing and para transit. The exposure of interest was the use of public transport and the experience or perception of sexual harassment.
Outcomes were the prevalence and forms of harassment, the effects of harassment on travel behaviour and the effectiveness of interventions; interventions could be physical, such as women only carriages or design changes, operational, such as staff presence or surveillance, or institutional, such as reporting systems, campaigns and legal reform. Eligible designs were cross sectional surveys, cohort studies, qualitative studies, mixed methods studies and intervention or policy evaluations.
Editorials, opinion pieces, conceptual proposals, secondary reviews and studies without an extractable sample were excluded. No language restriction was applied at the search stage, but full text screening was limited to reports available in open access and written in a language the reviewer could read, namely English, Spanish, Portuguese or Indonesian with an English abstract. Studies were considered irrespective of the sex of respondents, but only findings referring to women and girls were extracted, in keeping with the PECO question, and studies of mixed populations were retained when they reported results for women separately.
Four bibliographic databases were searched: Scopus, OpenAlex, Crossref and Semantic Scholar. Six core strings combined field codes with a publication year filter; the first was TITLE-ABS-KEY("sexual harassment" AND ("public transport" OR "public transit" OR transit)).
The remaining five varied the terms for women's safety, fear of crime, gender based violence and women only services: TITLE-ABS-KEY("sexual harassment" AND (transit OR bus OR metro OR train) AND women), TITLE-ABS-KEY(("women's safety" OR "women safety") AND (transit OR "public transport")), TITLE-ABS-KEY("fear of crime" AND (transit OR "public transport") AND (women OR gender)), TITLE-ABS-KEY(("gender-based violence" OR "sexual violence") AND ("public transport" OR transit)) and TITLE-ABS-KEY("women-only" AND (transit OR transport OR car)).
Extraction was recorded in a structured table keyed to each study, and the same fields were used for every design so that quantitative and qualitative findings could be placed side by side. Risk of bias was assessed with the JBI critical appraisal checklists for cross sectional and qualitative studies, which evaluate sampling, measurement, completeness of reporting and generalisability.( 14) Studies were rated low, moderate or high risk of bias. No study was rated low in the absence of supporting methodological information; convenience sampling, unvalidated instruments and missing non response information all raised the rating, while probabilistic sampling and objective outcome measures lowered it.
Findings were synthesised narratively by outcome domain and ordered chronologically within each domain, with publication years used as explicit temporal markers in line with the review question. The chronological ordering within each domain also makes visible the inflection points at which the literature changed emphasis, which is a secondary aim of this synthesis. Study level estimates are reported in the text only when their denominators and definitions were reported clearly enough to be meaningful, and qualitative findings are reported as themes rather than as counts. Where a study reported both prevalence and behavioural outcomes, both were extracted and reported under their respective domains.
RESULTS
Study selection
The searches returned 806 records, of which 240 were duplicates, leaving 566 records screened at title and abstract. The identified records were distributed across the four sources as follows: 256 from Scopus, 300 from OpenAlex, 150 from Crossref and 100 from Semantic Scholar. After screening, 160 reports were sought for retrieval and 125 could not be retrieved because no open access full text was available, so 35 reports were assessed for eligibility.
Eleven reports were excluded at full text: seven because of ineligible design, two because their bibliographic identifiers could not be verified, one because the full text was not usable and one because of language. In total, 24 studies were included in the review (Figure 1).
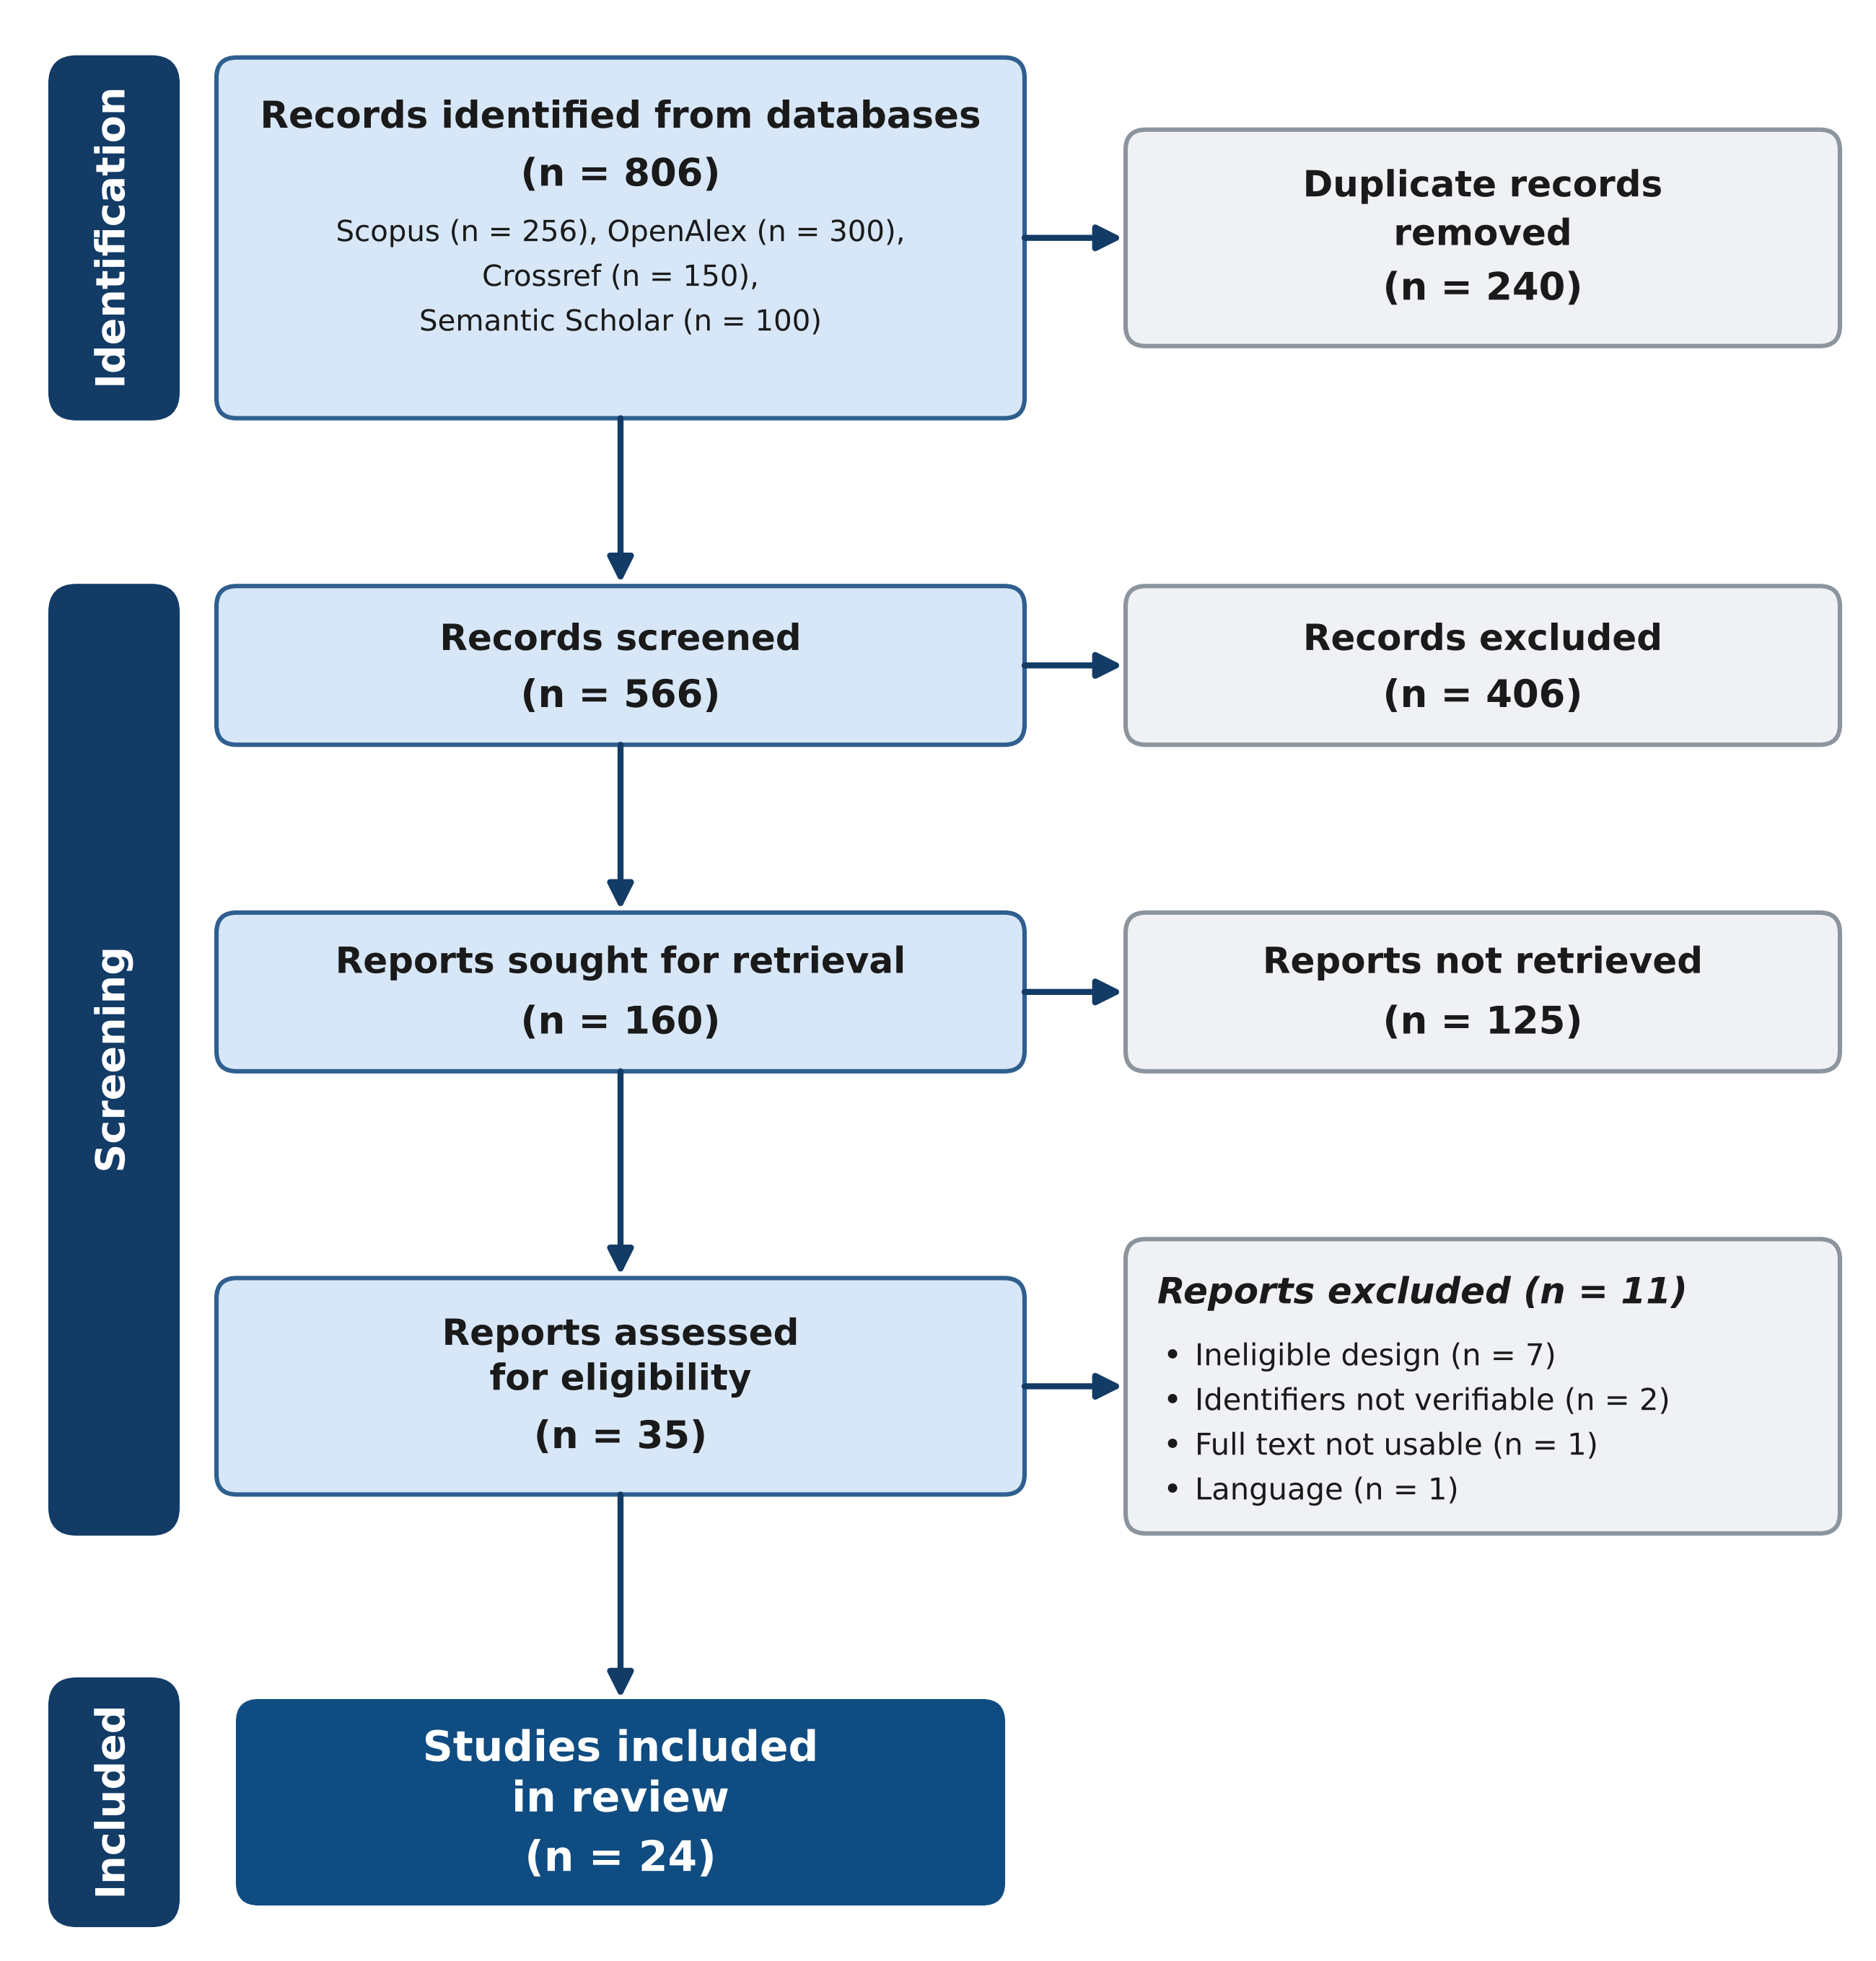
Figure 1. PRISMA 2020 flow diagram of study selection.
Characteristics of included studies
The included studies were published between 2018 and 2025, with a concentration in 2023 and 2025 (Figure 2).
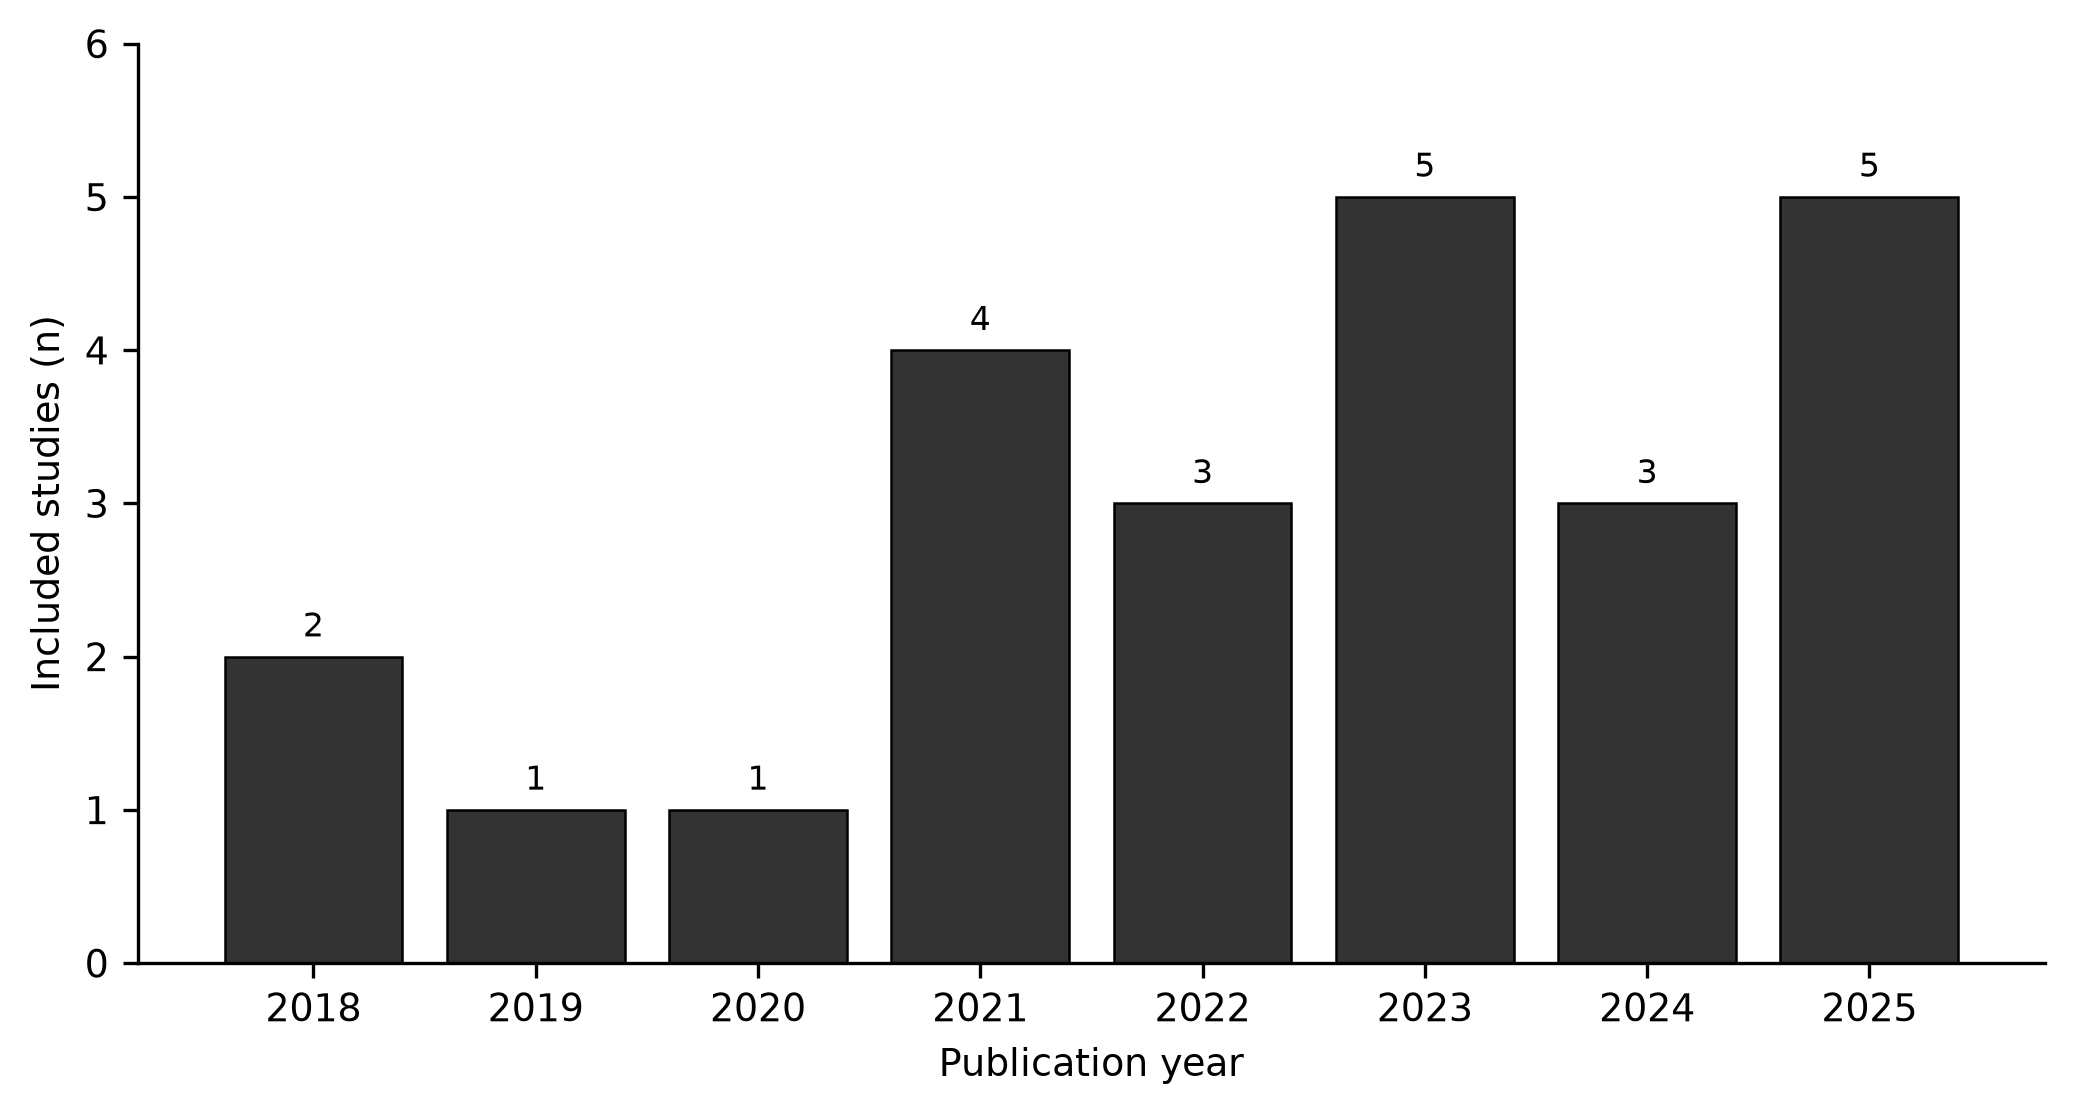
Figure 2. Included studies by publication year, 2018-2025.
They covered four continents, with the largest share from South Asia (Pakistan, Bangladesh, India and Nepal) and Southeast Asia (Indonesia), followed by Latin America, Europe and Africa (Table 1). Fifteen studies used cross sectional surveys, six used qualitative designs and three combined quantitative and qualitative methods. Sample sizes ranged from 10 interviewees in a study of commuter line users in Jabodetabek to 13,323 university students across 18 cities, and one study linked a national survey to mobile phone mobility records for 418,624 users in Santiago, Chile.( 15)
Study | Country | Design | Sample | Main finding |
|---|---|---|---|---|
Mishra and Lamichhane 2018(24) | Nepal | Cross sectional | 396 female students | Prevalence 79.6%; physical forms most common |
Sham et al. 2018(36) | Malaysia | Cross sectional | About 300 women | Fear higher at night and in younger women |
Orozco-Fontalvo et al. 2019(19) | Colombia | Cross sectional | 500 BRT users | More than 60% victimised in BRT |
Kebede et al. 2020(26) | Ethiopia | Cross sectional | 199 women and girls | 50.8% experienced violence |
Ceccato and Loukaitou-Sideris 2020(16) | 18 cities | Cross sectional | 13,323 students | Harassment common and underreported |
Kim 2021(37) | United Kingdom | Qualitative | 31 women | Design attributes shape fear |
King et al. 2021(34) | Bangladesh | Mixed methods | 200 women | Captive travellers restrict travel |
Karki et al. 2021(27) | Nepal | Cross sectional | 422 students | Prevalence 92%; physical 59% |
Tabassum and Suhail 2022(17) | Pakistan | Cross sectional | 105 women | Harassment frequent; passengers main offenders |
Sumbal 2022(21) | Pakistan | Cross sectional | 50 women | Harassment common; women avoid transit |
Yasir et al. 2022(29) | Bangladesh | Cross sectional | 452 users | Gender differences; smaller cities worse |
Kaygan et al. 2023(38) | Turkey | Qualitative | 32 women | Vehicle design mediates harassment |
Kabir and Islam 2023(33) | Bangladesh | Mixed methods | 255 respondents | Legal framework inadequate |
Athuman 2023(30) | Tanzania | Qualitative | 30 women | Unwanted contact and touching common |
Ismawati et al. 2023(25) | Indonesia | Cross sectional | 215 women | Insecurity feeds fear of crime |
Duri 2023(18) | South Africa | Qualitative | Ride hailing users | Drivers' misconduct and near kidnap |
Martinez and Romero 2024(35) | Spain, UK, France | Cross sectional | 417 users | Prior harassment increases route change |
Himel et al. 2024(31) | Bangladesh | Qualitative | 20 students | Harassment common; none reported it |
Govindaraj et al. 2024(28) | India | Cross sectional | 270 women | Harassment linked to poorer mental health |
Gomez and Becerra 2025(20) | Ecuador | Qualitative | Policy documents and interviews | Policies exist but continuity weak |
Stephanie et al. 2025(22) | Indonesia | Cross sectional | 100 women | Women only facilities not yet effective |
Contreras et al. 2025(15) | Chile | Cross sectional | 418,624 users | Insecurity lowers mobility, more in women |
Fatima et al. 2025(32) | Pakistan | Cross sectional | 384 users | Harassment frequent in para transit |
Gupta et al. 2025(23) | India | Mixed methods | Survey and interviews | Fear of harassment top safety concern |
Note: BRT = bus rapid transit; KRL = commuter line electric rail; N = sample size.
The dominant population was female students and young working women, who make the highest number of daily trips and are the group most exposed to harassment; working women and housewives were also represented in several South Asian samples.( 16,17)
Bus based and informal modes were overrepresented relative to rail, which reflects both the geography of the literature and the concentration of harassment in high occupancy road transport, while ride hailing appeared as a distinct exposure in one South African study.( 18)
The designs also reflect the maturation of the field: the earliest included studies were single site prevalence surveys, the middle period added comparative and qualitative designs, and the most recent studies combined survey data with objective mobility or policy records.( 15,19,20)
Risk of bias
Risk of bias was moderate in most studies and low in only one (Table 2). The most common threats were convenience or purposive sampling, self reported outcomes without validated instruments and incomplete reporting of non response and analysis. Studies rated high risk were small convenience surveys or interview studies whose findings, although consistent with the rest of the evidence, should be interpreted with caution.( 17,21,22)
Study | Checklist | Overall |
|---|---|---|
Orozco-Fontalvo et al. 2019(19) | Cross sectional | Moderate |
Kim 2021(37) | Qualitative | Moderate |
Martinez and Romero 2024(35) | Cross sectional | Moderate |
Tabassum and Suhail 2022(17) | Cross sectional | High |
Sumbal 2022(21) | Cross sectional | High |
Kabir and Islam 2023(33) | Cross sectional | Moderate |
Mishra and Lamichhane 2018(24) | Cross sectional | Moderate |
Ceccato and Loukaitou-Sideris 2020(16) | Cross sectional | Moderate |
Athuman 2023(30) | Qualitative | Moderate |
Himel et al. 2024(31) | Qualitative | Moderate |
Kebede et al. 2020(26) | Cross sectional | Moderate |
Gomez and Becerra 2025(20) | Qualitative | Moderate |
Stephanie et al. 2025(22) | Cross sectional | High |
Contreras et al. 2025(15) | Cross sectional | Low |
Ismawati et al. 2023(25) | Cross sectional | Moderate |
King et al. 2021(34) | Cross sectional | Moderate |
Fatima et al. 2025(32) | Cross sectional | Moderate |
Yasir et al. 2022(29) | Cross sectional | Moderate |
Govindaraj et al. 2024(28) | Cross sectional | Moderate |
Sham et al. 2018(36) | Cross sectional | High |
Karki et al. 2021(27) | Cross sectional | Moderate |
Gupta et al. 2025(23) | Cross sectional | Moderate |
Duri 2023(18) | Qualitative | Moderate |
Kaygan et al. 2023(38) | Qualitative | Moderate |
The single low risk study combined a national probabilistic survey with objective mobility data, which reduced the dependence on self report.( 15)
The predominance of moderate ratings means that the direction of the findings is reliable even where the exact magnitude is uncertain, and no conclusion of this review rests on the high risk studies alone. Qualitative studies were rated for methodological clarity rather than sample size, and their contribution lies in the description of mechanisms rather than in prevalence estimates. No included study was downgraded solely for its design; the rating followed the information the study actually provided.
Settings and contexts of harassment
Harassment was documented across the entire journey rather than at a single point. Studies that decomposed the trip found risk concentrated at bus stops, in crowded vehicles and at night, with waiting areas described as more insecure than the vehicles themselves.(19,23) In Barranquilla, women reported feeling more insecure than men while waiting at bus stops, and perceived risk rose with the characteristics of the trip.( 19)
In Delhi, bus stops were perceived as safe by 48% of women, well below metro stations at 72%, and night travel and poorly lit last mile connections were recurring sources of fear.( 23)
Overcrowding was named as the main enabling condition by 69.2% of the Kathmandu participants, and it recurred in every setting from Kathmandu buses to Indonesian commuter trains.(24,25) The evidence therefore locates the risk in specific times and places of the journey, which is directly relevant to the design of interventions. No included study found that any mode or time of day was entirely free of risk for women.
Prevalence and forms of harassment, 2018-2025
The earliest included estimates set the floor of the prevalence range. Between 2018 and 2020, a survey in Ethiopia reported that 50.8% of women and girls had experienced at least one form of violence while using public transport,(26) and a cross sectional study of 396 female health science students in Kathmandu reported a prevalence of 79.6%, decomposed into physical harassment in 67.1% of respondents, verbal harassment in 61.2% and non verbal harassment in 34.6%.(24)
Overcrowding was cited as the main enabling condition by 69.2% of the Kathmandu participants.( 24) A Colombian study from the same period found that more than 60% of respondents had been victimised in the Barranquilla bus rapid transit system, and that perceived risk varied with the characteristics of the trip.( 19)
By 2021, the upper end of the range had shifted: a survey of 422 female students in Kathmandu placed prevalence at 92%, with physical forms reported by 59%.( 27)
From 2022 onward, the South Asian literature consolidated a pattern of near universal exposure. In northeast India, 82% of 800 young working women had been harassed at some time, and 58% of them perceived severe stress, with higher stress when the incident had occurred in the previous 30 days.( 28)
In Rawalpindi, 46% of women reported harassment sometimes and 36% most of the time, and fellow passengers were identified as offenders by 64% of respondents, ahead of bus helpers and drivers.( 17)
The Rawalpindi sample was composed of students, working women and housewives, which indicates that exposure spans occupational groups rather than concentrating in a single category.( 17)
A three city survey in Bangladesh found considerable gender differences in perceived mobility hindrances and reported that harassment was more likely in smaller cities than in the capital.( 29) Qualitative work in Dar es Salaam and Sylhet described the same repertoire of unwanted contact, touching, abusive words and gestures in bus rapid transit and auto rickshaws.( 30,31)
The most recent studies extended the evidence beyond single cities. A survey of 13,323 university students across 18 cities on six continents confirmed that sexual harassment in transit is common and highly underreported everywhere, although its prevalence varied by city, transport mode and gender group.( 16)
In Lahore, a significant majority of women using para transit reported frequent harassment, in a sample of 250 women that represented about two thirds of the respondents, together with 100 men and 34 motorists.( 32) In Delhi, fear of sexual harassment was the main safety concern for 82% of women, metro stations were perceived as the safest public setting by 72% of respondents and bus stops among the least safe by 48%.( 23)
In Dhaka, a socio legal study described an exorbitant prevalence of harassment among female respondents and found that the legal framework lagged behind the scale of the problem.( 33)
Prevalence also varied by mode and by the stage of the journey. Rail and metro were perceived as safer than road based services in the studies that compared them directly: in Delhi, metro stations were rated safe by 72% of women against 48% for bus stops.( 23)
Bus rapid transit and para transit concentrated the reports of unwanted contact, and ride hailing introduced a distinct set of risks linked to the behaviour of individual drivers rather than to crowding.( 18,32)
Across all studies, physical contact, verbal abuse and staring were the dominant forms. Fellow passengers were named as offenders by the largest share of respondents, ahead of drivers and conductors, and harassment was reported in buses, bus rapid transit and para transit alike.( 17,32)
The same forms and offender patterns recurred across the four continents represented in the sample, which indicates that the underlying conditions are common to high occupancy transport systems rather than specific to any single city.
Effects on women's travel choices, 2018-2025
The second consistent finding is that harassment reshapes how, when and whether women travel. Between 2018 and 2022, qualitative and mixed methods work in Bangladesh and Pakistan described women who avoided public transport, restricted the frequency of their trips and travelled with constant defensive vigilance.( 21,34)
Women in Bangladesh were captive travellers, forced by price and availability to keep using unsafe modes while reducing the number of trips they made, a pattern that converted harassment into foregone activity rather than mode shift.( 34)
In Pakistan, women reported changing their time of travel and seeking male accompaniment as protective routines, and the large majority of harassed women in the university sample reported that the experience caused mental stress.( 21)
The burden was unevenly distributed within the female population: younger women and students were the most exposed group in nearly every survey, and working women who commuted daily accumulated the highest number of incidents.( 16,27)
Women who travelled for work or education in Bangladesh reported high levels of anxiety and fear, and women with low incomes had the fewest alternatives when safety failed.( 34)
From 2023 onward, quantitative designs made the association between harassment and travel behaviour measurable. A comparative survey of 417 users in Madrid, London and Paris, distributed as 193 respondents in Madrid, 152 in London and 72 in Paris, showed that prior harassment increased the likelihood of altering the route for safety, an association that was stronger among women and strongest among younger women.( 35)
In 2025, the largest study in the sample linked perceived insecurity to objectively lower daily mobility, with a stronger effect among women than men in Santiago, using mobility records for 418,624 users of whom 51% were women.( 15)
Fear also varied with time of day and age: women commuters in Malaysia reported less safety at night, and Indonesian users of crowded services described insecurity as a direct driver of fear of crime.( 25,36)
Beyond mobility itself, harassment carried measurable mental health consequences, including anxiety, panic and stress.( 28) In ride hailing, women in Gauteng described inappropriate remarks, longer routes that raised fares and an attempted kidnapping.( 18)
Mental health consequences, 2018-2025
Harassment was consistently associated with measurable psychological harm. In Pakistan, 92% of the women surveyed in a university sample reported that harassment caused mental stress.( 21) In northeast India, 58% of harassed working women perceived severe stress, and stress was higher when the incident had occurred within the previous 30 days.( 28)
Qualitative accounts in Sylhet described panic and anxiety that affected academic and social life.( 31) A cross sectional study in Chennai associated verbal and physical harassment and stalking with poorer mental health among 270 female commuters.( 28) These outcomes were reported alongside the travel adaptations described above, and both were documented in the same studies rather than in separate literatures.
Reporting and coping, 2018-2025
The response of victims followed a narrow and largely informal repertoire. In Kathmandu, 44.6% of harassed students scolded the harasser, 29.1% kept silent and 17.3% alighted at the nearest stop, while formal complaints remained exceptional.( 24)
In Rawalpindi, 52% of women took some action, ranging from verbal retaliation to informing family members, and 89% considered the problem serious.( 17)
The Sylhet study found that none of the twenty participants reported the incident to university authorities or the police.( 31) The multi city survey confirmed that underreporting is a global constant rather than a regional exception, and that the gap between the frequency of harassment and the frequency of formal reporting remains wide in every setting measured.( 16)
The preference for informal responses was consistent across regions: victims scolded the harasser, moved away or told family members, while the proportion who notified police or transport staff remained small in every study that reported it.( 17,24,31) The coping strategies documented across studies were therefore individual and improvised, oriented to managing risk in the moment rather than to changing the system that produces it.
Effectiveness of interventions, 2018-2025
The evidence on interventions is thinner and less favourable than the evidence on prevalence. Between 2018 and 2023, survey and qualitative studies found that women only carriages and facilities were only partially effective, because availability did not match demand and mixed carriages remained uncomfortable under crowding; users of women only facilities in Indonesia reported feeling safe in the segregated space but judged the provision insufficient.( 22)
Policy evaluations told a similar story: in Quito, policies against sexual violence in public transport existed on paper, but their continuity and effectiveness weakened with each change of administration.( 20) Legal analysis in Dhaka found that the existing legal framework was judged inadequate and that victims were unwilling or unable to seek legal redress.( 33)
Design oriented studies from 2021 onward identified concrete levers. Service design attributes such as visibility, staff presence and seating layout shaped female passengers' fear of crime on the London Underground, and vehicle design in Ankara mediated the gendered interactions that produce harassment.(37,38) Reporting channels emerged as a precondition for any credible prevention strategy, because underreporting was universal in every study that measured it.( 16)
By 2025, no included study had demonstrated a large, sustained reduction in harassment attributable to a single intervention, none of the included intervention studies used a controlled before and after design, and the field had not yet produced the evaluations that such claims would require.
DISCUSSION
Returning to the review question, the evidence supports three conclusions. Harassment in public transport is widespread, with a prevalence at or above one half of women in nearly every setting and close to universal in several South Asian samples. Its effect on travel behaviour is consistent and structural, operating through route alteration, avoidance and reduced mobility rather than through isolated incidents. The effectiveness of interventions remains uncertain, because most evaluations are descriptive, small and short term. Together these findings reframe transit safety as a barrier to mobility rather than a concern limited to crime prevention.( 4)
Read as a whole, the certainty of the evidence is moderate for the prevalence of harassment and for the direction of its behavioural effects, and low for the effectiveness of interventions. The prevalence and behaviour conclusions rest on a large number of independent studies that point in the same direction despite different instruments, which is the pattern expected when the underlying phenomenon is real. The intervention conclusions rest on a much smaller set of descriptive evaluations, several of them at high risk of bias, and would change if controlled studies appeared.
The prevalence figures we found align with, and extend, earlier city studies. Estimates between 50.8% and 92% match the 60 to 90% range reported for Latin American capitals before 2017 and the near universal figures documented in Bangladesh.( 6,8)
They diverge from European population surveys, which place lifetime harassment around 50%, a gap explained by differences in definitions, recall windows and the modes surveyed rather than by any lower underlying risk.( 2)
The included studies also confirm that harassment concentrates in buses and informal modes and that fellow passengers are the most common offenders, a pattern consistent with the criminology of crowded, unsupervised spaces.( 11,39)
The finding that smaller cities can be as unsafe as capitals is a reminder that the problem is not confined to the largest systems.( 29)
One apparent discordance deserves mention: a minority of respondents in the included studies reported feeling safe on the systems surveyed, and women only spaces were experienced as safe even when their provision was judged insufficient. Safety perceptions and victimisation can therefore diverge, and both must be measured rather than assumed to move together.( 22,23)
The effects on travel choices are the finding with the clearest practical implication. The association between prior harassment and route alteration documented in Madrid, London and Paris reproduces the avoidance behaviours reported in earlier qualitative work in Mexico City and in the São Paulo metro, where women adapt their journeys to protect themselves.( 8,35)
The Santiago result adds an objective dimension: perceived insecurity reduces measured mobility, and the effect is larger for women, which confirms with behavioural data what surveys had long suggested.( 15) This converges with the shadow of sexual assault hypothesis, in which fear of sexual victimisation drives women's avoidance even when reported victimisation is low.( 12)
The consistency of the direction across qualitative, survey and mobile data designs is itself informative, because it reduces the risk that the association is an artefact of any single method.( 15)
Where our synthesis departs from some transport studies is the emphasis on captivity: low income women often cannot switch modes and instead restrict trips, which converts harassment into foregone activity rather than into a different journey.( 34,40)
Work in Metro Manila frames the same finding as a deficit in psychological empowerment, because women who perceive high transit risk report lower confidence in their own mobility, which compounds the objective constraints.( 40)
The intervention evidence is weaker than the problem it addresses. Women only carriages, the most visible measure, are only partially effective because supply does not meet demand and mixed spaces remain threatening, a conclusion consistent with the Indonesian experience reported in the literature.( 22)
The one qualification is that users of segregated spaces reported feeling safe inside them, so the measure is incomplete rather than useless.( 22)
Reporting campaigns and incident data systems are widely recommended but were not evaluated with controlled designs in any included study, so their contribution rests on plausibility rather than demonstration.( 41)
Policy analyses add a governance explanation: even well designed programmes lose continuity across administrations, which suggests that sustainability, not the initial design, is the binding constraint.( 20)
The most plausible path forward combines environmental design, staff presence and reporting channels, an approach consistent with reviews of transit crime prevention.( 3,37)
A dissenting view in the transport literature treats harassment primarily as a matter of enforcement and penalties rather than of design and service. The evidence in this review does not support that view as the main response, because enforcement depends on reporting and reporting is the weakest link in the chain documented here.
The studies that measured reporting found that few victims reach a formal complaint, which suggests that deterrence alone cannot close the gap.( 16,39)
Several sources of heterogeneity limit direct comparison. Definitions of harassment ranged from verbal abuse alone to any sexualised contact, recall windows from the past month to the lifetime, and denominators from students to all women, which produced the wide prevalence band.
Sampling was rarely probabilistic, and the geographic centre of gravity in South and Southeast Asia reflects both the severity of the problem there and the concentration of open access studies from that region. The chronological pattern, with all included studies published between 2018 and 2025, is an artefact of retrieval rather than of the underlying literature, because several seminal studies from 2013 to 2017 were paywalled. Perceived insecurity also has triggers beyond harassment, such as crowding and poor visibility, which means that safety interventions must target the environment rather than the incident alone.( 42)
The geographic distribution of the evidence also defines the research agenda. Africa, the Middle East and Central Asia are underrepresented relative to South and Southeast Asia and Latin America, and the studies from these regions that do exist tend to be small and cross sectional.
This skew matters for policy, because the balance of modes, the degree of formalisation and the legal context differ across regions, and interventions that work in one setting may not transfer to another. The absence of longitudinal and quasi experimental designs is a second gap: the literature describes the problem well but has rarely measured change over time. Both gaps follow from the same source, which is that harassment in transit has been studied with the tools of descriptive social science rather than with the tools of evaluation.
Transport agencies that measure harassment with standardised items and evaluate each intervention with a before and after design would generate the evidence that this review shows is still missing.( 5,10)
Agencies can begin with the conditions documented repeatedly in the included studies, namely lighting, staffing and crowding, and can build the measurement systems that will let them learn from their own interventions.(37) For research, the priority is a minimum shared definition of harassment, a common recall window and a standard set of travel behaviour outcomes, which would turn the current collection of local estimates into a comparable global evidence base and allow future reviews to pool results quantitatively rather than narratively.
CONCLUSIONS
The prevalence of sexual harassment against women in public transport is high across settings and reaches near universal levels in several South Asian cities, with physical contact, verbal abuse and staring as the dominant forms, and with risk concentrated at stops, in crowded vehicles and at night. Harassment consistently increases route alteration, travel avoidance and reduced daily mobility, and its burden falls hardest on women who lack alternative modes. Interventions such as women only facilities and reporting campaigns show partial and mostly unverified effectiveness, and policy continuity remains a recurring weakness.
Transit safety should therefore be treated as a condition of women's access to the city rather than as a secondary aspect of service quality. Standardising how harassment is measured and evaluating prevention strategies with comparative designs are the two steps most likely to turn a well documented problem into an evidence based response. Until those steps are taken, the persistent gap between the scale of the problem and the strength of the response will continue to fall on the women who depend on public transport every day. The alternative, treating safety as a by-product of service design rather than a design objective in its own right, is what the last decade of evidence has shown to be insufficient.
References
- 1 UN Women. Safe cities and safe public spaces: global results report [Internet]. 2017. Available from: https://www.unwomen.org/en/digital-library/publications/2017/10/safe-cities-and-safe-public-spaces-global-results-report
- 2 European Union Agency for Fundamental Rights. Violence against women: an EU-wide survey. Main results report [Internet]. 2014. Available from: https://fra.europa.eu/en/publication/2014/violence-against-women-eu-wide-survey-main-results-report
- 3 Levin L. Transit crime and sexual violence in cities: international evidence and prevention. Secur J. 2023;36(3):589-591. doi: 10.1057/s41284-022-00345-2
- 4 Lubitow A, Abelson MJ, Carpenter E. Transforming mobility justice: Gendered harassment and violence on transit. Journal of Transport Geography. 2020;82:102601. doi: 10.1016/j.jtrangeo.2019.102601
- 5 Sweet EL. Addressing violence against women in cities. Nat Cities. 2024;1(6):394-395. doi: 10.1038/s44284-024-00078-w
- 6 Loukaitou-Sideris A, Fink C. Addressing Women's Fear of Victimization in Transportation Settings. Urban Affairs Review. 2009;44(4):554-587. doi: 10.1177/1078087408322874
- 7 Spicer V, Song J. The impact of transit growth on the perception of crime. Journal of Environmental Psychology. 2017;54:151-159. doi: 10.1016/j.jenvp.2017.09.002
- 8 Moreira GC, Ceccato VA. Gendered mobility and violence in the São Paulo metro, Brazil. Urban Studies. 2021;58(1):203-222. doi: 10.1177/0042098019885552
- 9 Iudici A, Bertoli L, Faccio E. The ‘invisible’ needs of women with disabilities in transportation systems. Crime Prev Community Saf. 2017;19(3-4):264-275. doi: 10.1057/s41300-017-0031-6
- 10 Pervez A, Marazi NF, Majumdar BB, Ruizhi M, Lee J, Sahu PK. Investigating Indian Commuters’ Perceived Crime Risk on Autonomous Public Buses and Ride-Pooling Services. Transportation Research Record: Journal of the Transportation Research Board. 2025;2679(1):1159-1172. doi: 10.1177/03611981241257514
- 11 Strandbygaard SK, Jensen LMB, Grönlund B, Nielsen OA, Jones AKS, Flower M. Understanding passengers’ fear of crime at train stations through neighbourhood types: a typological study of the Copenhagen metropolitan area. Journal of Urbanism: International Research on Placemaking and Urban Sustainability. 2022;15(1):17-38. doi: 10.1080/17549175.2020.1828145
- 12 Yavuz N, Welch EW. Addressing Fear of Crime in Public Space: Gender Differences in Reaction to Safety Measures in Train Transit. Urban Studies. 2010;47(12):2491-2515. doi: 10.1177/0042098009359033
- 13 Page MJ, McKenzie JE, Bossuyt PM, Boutron I, Hoffmann TC, Mulrow CD, et al. The PRISMA 2020 statement: an updated guideline for reporting systematic reviews. BMJ. 2021:n71. doi: 10.1136/bmj.n71
- 14 JBI. JBI critical appraisal tools [Internet]. 2024. Available from: https://jbi.global/critical-appraisal-tools
- 15 Contreras H, Candia C, Rodriguez-Sickert C, Ferres L, Troncoso R. Feelings of insecurity as a gender-specific constraint on urban mobility. EPJ Data Sci. 2025;14(1):71. doi: 10.1140/epjds/s13688-025-00589-z
- 16 Ceccato V, Loukaitou-Sideris A. Sexual Harassment in Transit Environments among College Students in the #MeToo Era: Reporting Evidence from Six Continents. Am J Crim Just. 2021;46(1):107-129. doi: 10.1007/s12103-020-09583-9
- 17 Tabassum S, Suhail K. Sexual harassment on public transport: a survey study of Rawalpindi, Pakistan. J Humanit Soc Manag Sci. 2022;3(1):258-266. doi: 10.47264/idea.jhsms/3.1.18
- 18 DURI B. SAFETY AND SECURITY OF WOMEN ON TRANSPORT: A CASE OF RIDE-HAILING SERVICES IN GAUTENG, SOUTH AFRICA. SJSUTST. 2023;121:77-87. doi: 10.20858/sjsutst.2023.121.6
- 19 Orozco-Fontalvo M, Soto J, Arévalo A, Oviedo-Trespalacios O. Women's perceived risk of sexual harassment in a Bus Rapid Transit (BRT) system: The case of Barranquilla, Colombia. Journal of Transport & Health. 2019;14:100598. doi: 10.1016/j.jth.2019.100598
- 20 Flores G, Becerra Peña AC. ¿Protegidas en Movimiento? Un análisis crítico de las políticas contra el acoso sexual en el Distrito Metropolitano de Quito. JFGWS. 2025;(18):1-26. doi: 10.15366/jfgws2025.18.001
- 21 Sumbal S. Harassment of Women in University and Public Transport. ESJ. 2022;18(10):39. doi: 10.19044/esj.2022.v18n10p39
- 22 Stephanie K, Kurniawan P, Sarwono L. ANALISIS KENYAMANAN DAN EFEKTIVITAS FASILITAS KHUSUS PEREMPUAN PADA ANGKUTAN PUBLIK. JTrans. 2025;24(2):101-112. doi: 10.26593/jtrans.v24i2.8480.101-112
- 23 Gupta AM, Ashtt P()R, Monga P()A. Perceived Safety of Women in Public Spaces: Analyzing Challenges and Policy Interventions in the NCT of Delhi. Int J Environ Sci. 2025:761-768. doi: 10.64252/t4zpe440
- 24 Mishra D, Lamichhane J. Experience of sexual harassment in public transport among female health science students: A cross sectional study of Kathmandu, Nepal. J Manmohan Memorial Inst Health Sci. 2018;4(1):20-32. doi: 10.3126/jmmihs.v4i1.21134
- 25 Ismawati I, Saut H. Hutahaean E, Fahrudin A. Feeling Unsafe Among Female Users of Crowded Public Transportation. KESANS. 2023;3(1):38-46. doi: 10.54543/kesans.v3i1.236
- 26 Kebede ET. Women and Girls Safety and Security in Public Transport. RHSS. 2020. doi: 10.7176/rhss/10-9-06
- 27 Karki U, Maharjan A, Nepal S, Tandukar R. Sexual Harassment among College Students using Public Transportation in Kathmandu Metropolitan City. One Health J Nep. 2021;1(01):57-60. doi: 10.3126/ohjn.v1i01.69031
- 28 Govindaraj S, VM AE, P S, R U, Sekhar MA, Priscilla SE, et al. Public Transport or a Landmine: Insecurities, Harassment and its Effect on Mental Health in Women Using Public Transport System in Chennai District, Tamil Nadu. J Epidemiol Public Healt. 2024;9(4):502-514. doi: 10.26911/jepublichealth.2024.09.04.10
- 29 Yasir S, Ahmad T, Enam A. An analysis of the harassments and challenges faced by the public transport users in a developing country of South Asia. Front Built Environ. 2022;8:1049121. doi: 10.3389/fbuil.2022.1049121
- 30 Athumani A. Exploration of sexual harassment practices among women using bus rapid transport service in Dar Es Salaam Tanzania. IJRBS. 2023;12(4):374-382. doi: 10.20525/ijrbs.v12i4.2623
- 31 Himel MR, Ahmed M, Jannat R. Riding in Fear: Female Students’ Lived Experiences of Sexual Harassment in CNG Auto Rickshaws in Sylhet City. MJSA. 2024;18(2024):223-248. doi: 10.22452/mjsa.vol18no2024.10
- 32 Fatima M, Nasir M, Iqbal MA. Gendered Mobility Constraints in Semi-Formal Urban Transport Systems: An Empirical Study of Para-Transit in Lahore. JAABE. 2025;8(2):61-78. doi: 10.32350/jaabe.82.03
- 33 Kabir H, Islam S. Sexual Harassment in Public Transport in Dhaka City: A Socio-legal Assessment. AJSSLS. 2023:31-42. doi: 10.34104/ajssls.023.031042
- 34 King J, King M, Edwards N, Carroll JA, Watling H, Anam M, et al. Exploring Women’s Experience of Gender-Based Violence and Other Threats to Safety on Public Transport in Bangladesh. Int J for Crime, Justice & Social Democracy. 2021;10(4):158-173. doi: 10.5204/ijcjsd.2086
- 35 Paz Martínez M, Jiménez Romero M. Sexual harassment on public transport and its impact on women. Investig fem. 2024;15(2):287-299. doi: 10.5209/infe.98223
- 36 Sham R, Khalifah Soltani SH, Sham M, Mohamed S. Travel Pattern and Fear of Crime among Women Commuters. jABs. 2018;3(7):131-139. doi: 10.21834/jabs.v3i7.266
- 37 Kim H. Service design for public transportation to address the issue of females’ fear of crime. Transportation. 2021;48(1):167-192. doi: 10.1007/s11116-019-10043-5
- 38 Kaygan P, Kaygan H, Özgür Keysan A. Gendered Interactions Mediated by Design: Sexual Harassment on Public Transport. Design and Culture. 2023;15(3):345-366. doi: 10.1080/17547075.2022.2141159
- 39 Ceccato V, Paz Y. Crime in São Paulo’s metro system: sexual crimes against women. Crime Prev Community Saf. 2017;19(3-4):211-226. doi: 10.1057/s41300-017-0027-2
- 40 Jabar MA, Yabut HJ, Biana HT, Domingo R. Psychological empowerment among women commuters in Metro Manila, Philippines: perceived transit risks, attitudes, and self-protective strategies. J Transp Secur. 2024;17(1):17. doi: 10.1007/s12198-024-00288-2
- 41 Torrao G, Htait A, Wong SHS. Perceptions of Women’s Safety in Transient Environments and the Potential Role of AI in Enhancing Safety: An Inclusive Mobility Study in India. Sustainability. 2024;16(19):8631. doi: 10.3390/su16198631
- 42 Stjernborg V. Triggers for feelings of insecurity and perceptions of safety in relation to public transport; the experiences of young and active travellers. Applied Mobilities. 2025;10(3):269-289. doi: 10.1080/23800127.2024.2318095
Declarations
Funding
No financing
Conflict of interest
None
Authorship contributions
Drafting – original draft: Teresa Irina Salazar Echeagaray, Pedro Chanel Sosa-Abreu, Verenice Sánchez Castillo.
Writing–review and editing: Teresa Irina Salazar Echeagaray, Pedro Chanel Sosa-Abreu, Verenice Sánchez Castillo.