

Abstract
Introduction: Automated shuttles are being trialled in public transport pilots worldwide, and their permanence depends on public acceptance. This review synthesizes the determinants of user acceptance measured in real-world pilots. Methods: A systematic review was conducted following PRISMA 2020. Results: Of 754 records identified, 618 were screened, 16 full texts were assessed and 10 studies with 2,961 participants were included, eight conducted in Europe, one in North America and one in Asia. Acceptance and intention to use were generally high and remained high after a ride. Determinants separated into user-related factors, led by trust, satisfaction and technology readiness, and system-related factors, led by perceived safety, comfort and speed. Seven studies had moderate risk of bias and three high. Conclusions: Direct exposure sustains acceptance, and perceived safety, comfort and service effectiveness are the dominant system-related constraints. The evidence is limited by small, self-selected samples and by the absence of low-risk-of-bias studies.
Keywords
automated shuttle, autonomous vehicle, technology acceptance, public transport, user acceptance, systematic review
INTRODUCTION
Automated shuttles are small, low-speed vehicles that operate at Society of Automotive Engineers (SAE) Level 4 without a driver on board, and since the middle of the 2010s public transport operators have deployed them in pilots across Europe, Asia and North America. These services typically cover first- and last-mile links, city centres, campuses and rural corridors at speeds below 25 km/h, with a safety steward or a remote operator supervising the vehicle.( 1,2)
Whether such pilots mature into permanent services depends less on the performance of the vehicle than on public acceptance.( 3) Two populations must accept the technology for a pilot to succeed: people who have ridden a shuttle and formed an opinion from direct experience, and people who would consider using one without having ridden it.
These pilots matter because they reproduce the conditions under which acceptance is actually formed. The shuttles travel slowly, stop frequently and carry a steward who can intervene, and each of these features shapes the attitudes that passengers report.
Reviews of the early deployments treat the pilot phase as a window in which public opinion is still plastic,( 1) and the experience accumulated in that window determines whether operators and authorities commit to permanent services. Real-world pilots, rather than hypothetical scenarios, are therefore the appropriate evidence base for judging whether the public will accept these vehicles.
Acceptance research on these vehicles rests on the technology acceptance tradition. The Technology Acceptance Model (TAM) explains intention to use a technology through perceived usefulness and perceived ease of use,(4) the Unified Theory of Acceptance and Use of Technology (UTAUT) adds performance expectancy, effort expectancy, social influence and facilitating conditions,(5) and its extension UTAUT2 incorporates hedonic motivation, price value and habit.(6)
The Theory of Planned Behavior contributes attitude, subjective norm and perceived behavioral control.( 7) For automated shuttles specifically, the Acceptance of Automated Road Transport Systems model adapted UTAUT to public transport vehicles,( 2) and the included studies of this review use these constructs, together with trust, perceived safety and comfort, as their outcome measures.
Trust, perceived safety and comfort sit outside the original TAM and UTAUT specifications but dominate the shuttle literature, which is why the included studies almost all add them to the inherited scales. This review therefore treats the classical models as a vocabulary for describing determinants rather than as the hypothesis being tested.
The acceptance of automated vehicles has been measured mainly through stated-preference and questionnaire studies. Large cross-national surveys have documented moderate willingness to use driverless vehicles and persistent concerns about safety, liability and the absence of a human driver.( 8,9)
Reviews of this evidence show that hypothetical choice experiments predominate,( 10) which limits what they can say about the experience of a real ride. Field pilots have generated a parallel literature of surveys and interviews conducted before and after exposure to an actual shuttle, but this literature has not been consolidated. The pilot studies differ from the questionnaire studies in one decisive respect: their respondents have ridden the vehicle. A ride supplies the sensory and safety information that a scenario cannot, and that difference is the reason the two literatures ask the same questions but reach different magnitudes.
Prior reviews treat automated vehicles as one undifferentiated category or rely on scenarios that respondents have never experienced, and none synthesizes acceptance measured in real public transport shuttle pilots. Individual pilot studies also report discordant results: some find that a single ride increases acceptance, whereas others document persistent discomfort and distrust.
The contrast between users with direct shuttle experience and users without it, and between determinants that belong to the user and determinants that belong to the vehicle and its service, remains unresolved. Europe dominates the pilot record because European programmes such as CityMobil2 and SHOW funded most early deployments, whereas North American and Asian evidence is thinner; the determinants identified here are therefore calibrated on dense, walkable European settings and may not transfer to car-dependent contexts.
The objective of this review was to synthesize the empirical evidence on the determinants of user acceptance and intention to use automated shuttles in real-world public transport pilots published between 2013 and 2025, comparing experienced and inexperienced users and user-related versus system-related determinants.
METHODS
This systematic review followed the Preferred Reporting Items for Systematic Reviews and Meta-Analyses (PRISMA) 2020 statement.( 11)
Studies were eligible if they reported primary empirical data on the acceptance, intention to use, willingness to use, satisfaction, trust, perceived safety, comfort or attitudes of users or passengers toward an automated, autonomous or driverless shuttle, minibus or bus, collected in a real-world deployment, pilot, field trial, demonstration, test ride or living lab. Wizard-of-Oz rides on public roads with a hidden safety driver were eligible because participants experienced a real vehicle in real traffic.
The population comprised shuttle riders and the general public with direct exposure to a pilot, including older adults, people with disabilities and tourists. Studies of hypothetical services with no actual ride, stated-preference experiments without exposure, driving simulator and virtual reality studies, and studies of pedestrians, cyclists or other road users who did not ride the shuttle were excluded. Reviews, editorials, expert studies and purely technical or operational papers without an acceptance outcome were also excluded.
The outcome constructs were interpreted against the technology acceptance tradition, so that perceived usefulness and ease of use,( 4) performance and effort expectancy,( 5) and trust, perceived safety and comfort were all treated as acceptance measures.
Scopus, OpenAlex and Crossref were searched. Searches combined terms for the vehicle, the setting and the outcome. In Scopus, field codes and Boolean operators were used, and the core query was TITLE-ABS-KEY("automated shuttle" AND (acceptance OR "intention to use" OR satisfaction OR trust)). Four additional Scopus queries varied the vehicle term (autonomous shuttle, autonomous minibus, automated minibus, self-driving shuttle, autonomous bus, automated vehicle) and the outcome term (acceptance, attitude, intention, passenger).
Two equivalent free-text queries were run in OpenAlex and two in Crossref. The four additional Scopus queries were TITLE-ABS-KEY("autonomous shuttle" AND (acceptance OR "intention to use" OR satisfaction OR trust)), TITLE-ABS-KEY("autonomous minibus" OR "automated minibus" OR "self-driving shuttle" AND (acceptance OR user)), TITLE-ABS-KEY("autonomous bus" AND (acceptance OR "public transport" OR passengers)) and TITLE-ABS-KEY("automated vehicle" AND "public transport" AND (acceptance OR attitude OR intention)). No language filter was applied at the search stage, and every query was restricted to records published between 2013 and 2025.
RESULTS
Study selection
The searches identified 754 records, and after the removal of 136 duplicates, 618 records were screened by title and abstract (Figure 1). Screening excluded 489 records and left 129 reports that were sought for retrieval. Full texts could not be retrieved for 113 reports because no legitimate open-access version was available, so 16 reports were assessed for eligibility. Six reports were excluded at this stage.
The three exclusions for lack of a real-world pilot were surveys that asked about hypothetical services without an actual ride. Ten studies met the inclusion criteria. Scopus contributed 354 of the identified records, OpenAlex 200 and Crossref 200; a record retrieved by two sources was counted once.
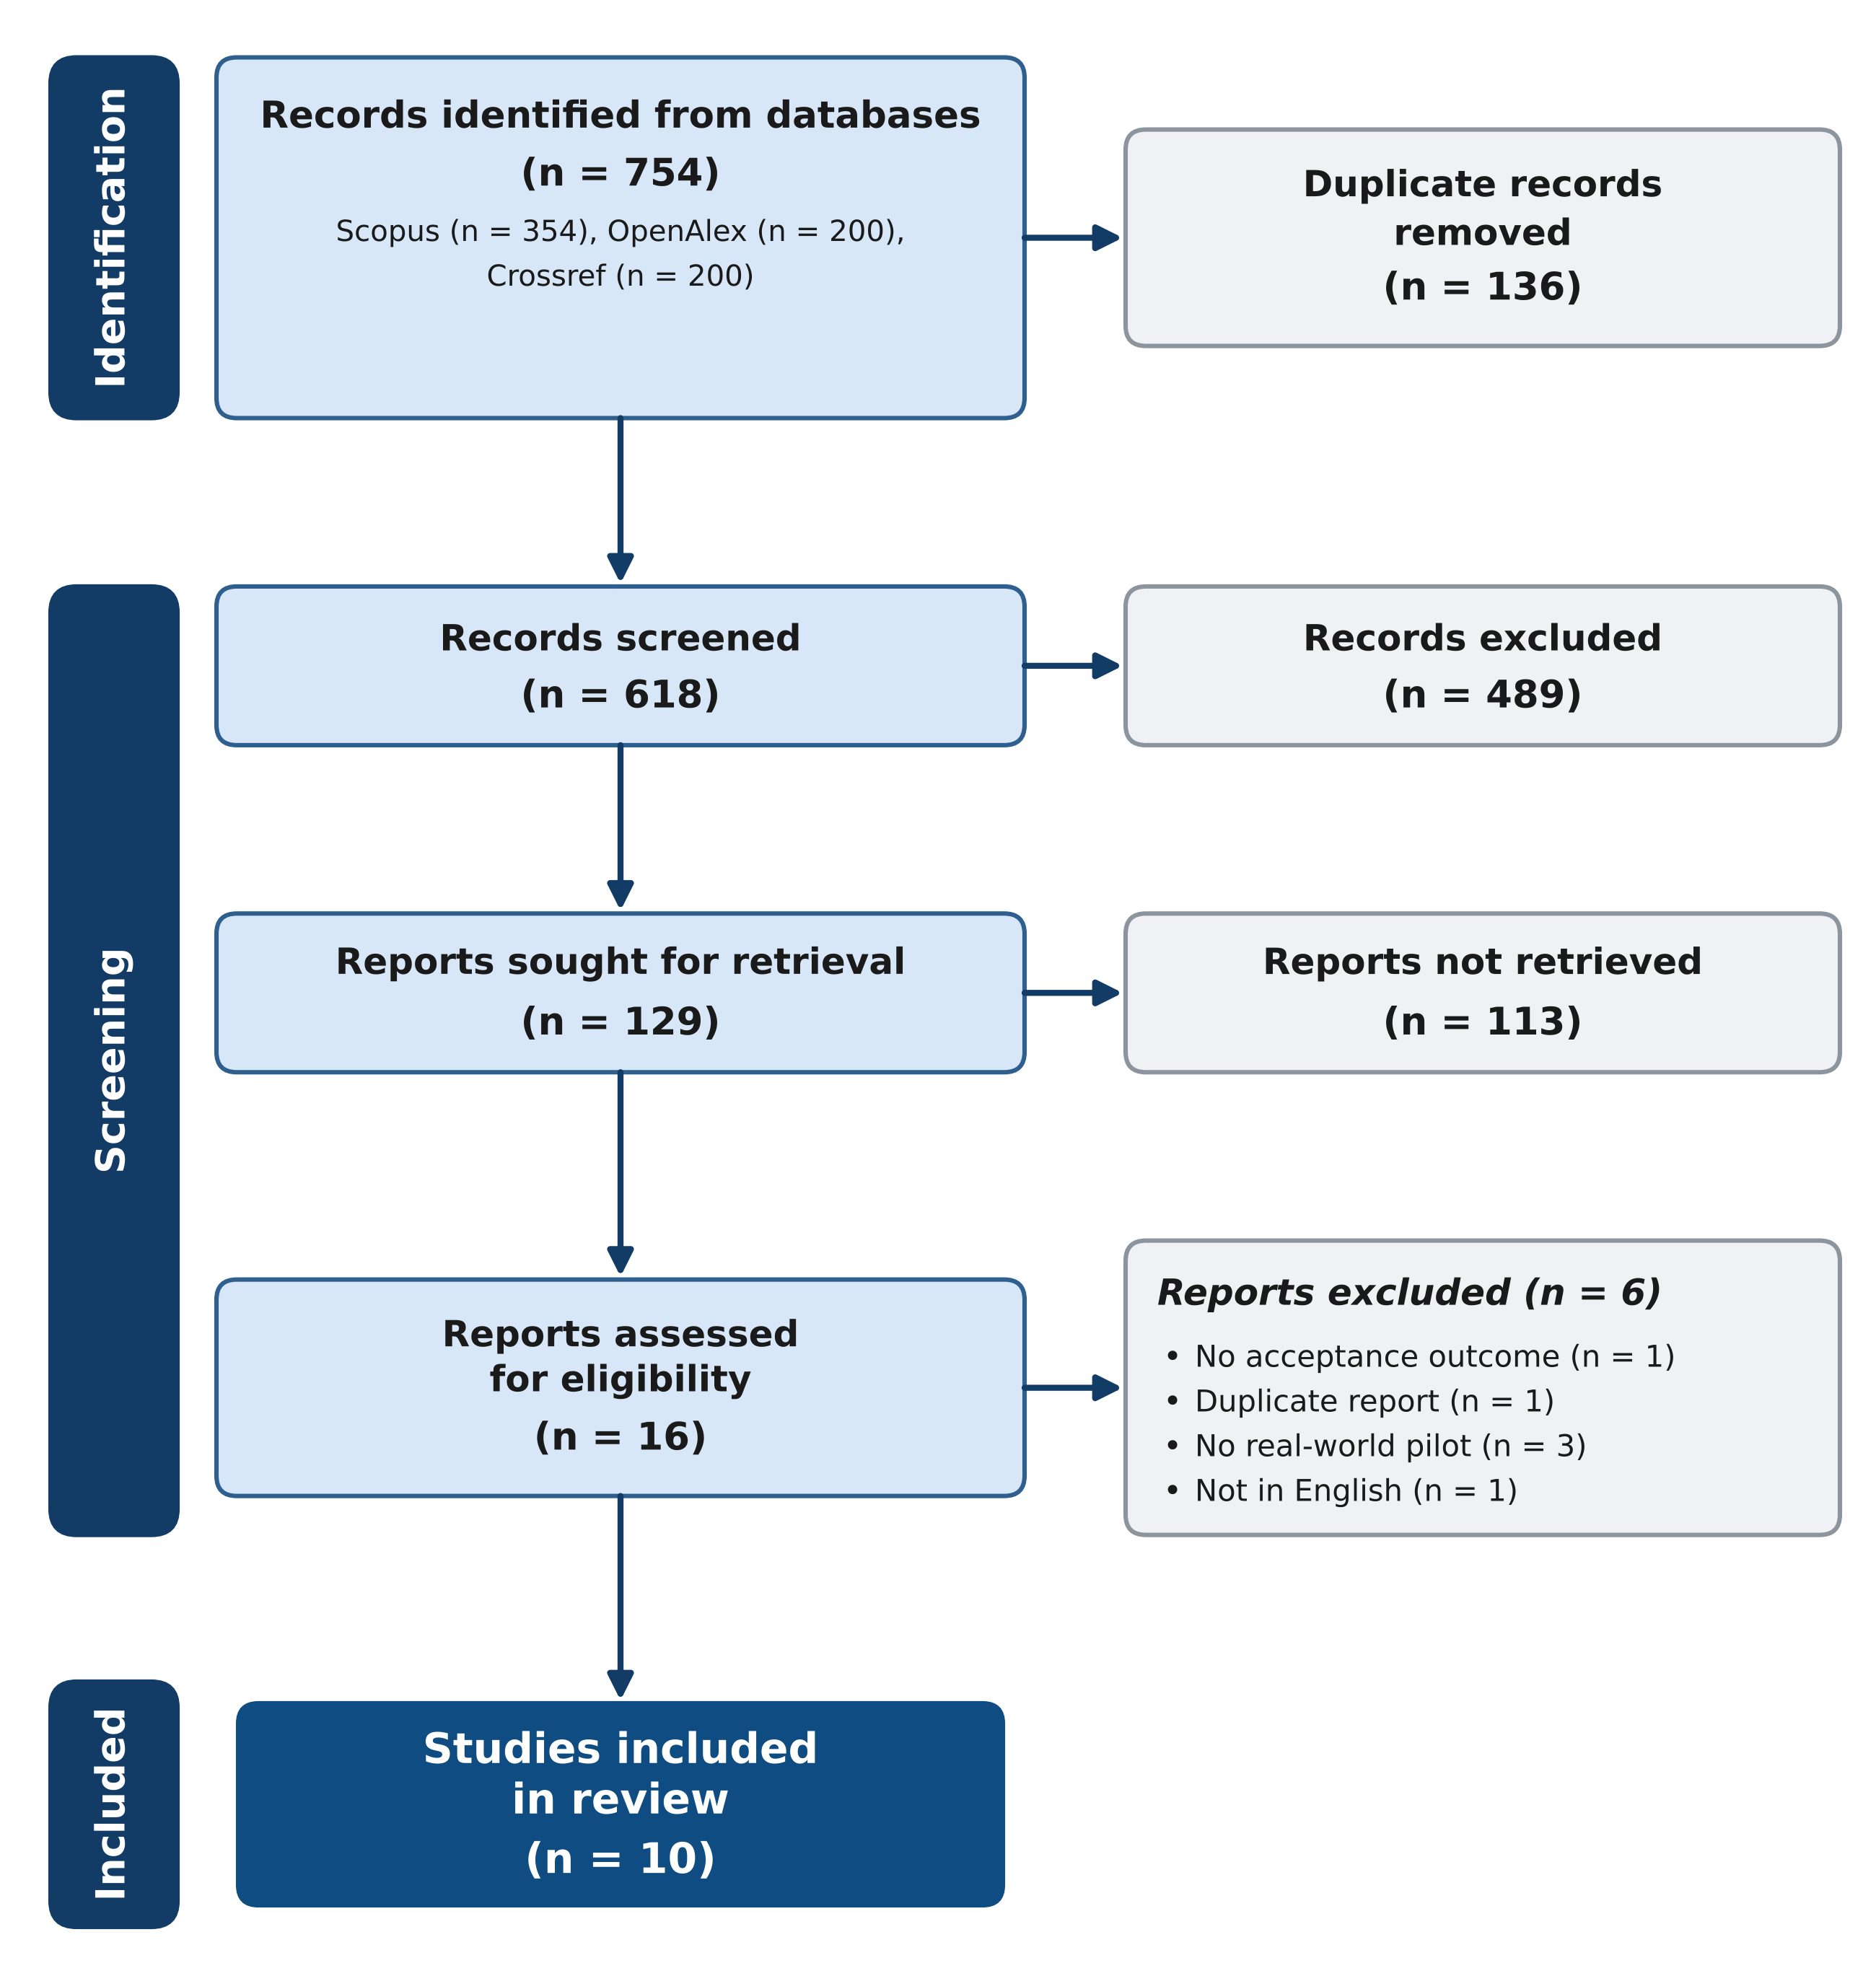
Figure 1. PRISMA 2020 flow diagram of study selection.
Characteristics of included studies
The ten included studies were published between 2018 and 2025 and together enrolled 2,961 participants (2,961) (Table 1). Eight studies were conducted in Europe (8), one in North America (1) and one in Asia (1).
Germany contributed three studies, set in Berlin,( 12) Braunschweig( 13) and Karlsruhe;(14) the remaining European evidence covered pilots in Austria,( 15) Estonia( 16) and Sweden,( 17) together with two multi-country comparisons.( 18,19)
The single North American study tested older drivers in Florida,( 20) and the single Asian study surveyed four pilot cities in China.( 21)
The designs were predominantly cross-sectional. Eight studies administered a questionnaire at a single point after exposure (8), and two studies repeated the measure before and after the ride (2).
The pre-post studies were the Wizard-of-Oz experiment in Braunschweig, which surveyed 35 participants at three time points,( 13) and the demonstration with older drivers in Florida, which followed 104 participants through a ride in a bus depot.( 20) Sample sizes ranged from 35(13) to 837,( 18) and five studies enrolled fewer than 300 participants.
The vehicles were mostly first-generation automated shuttles. The EasyMile EZ10 or its upgraded EZ10 Gen2 appeared in five studies, in Berlin,( 12) Florida,( 20) Karlsruhe,( 14) Kista( 17) and the Baltic comparison.( 18) Navya shuttles served the Austrian trial,( 15) the Baltic comparison( 18) and the multi-site correlation study,( 19) which also included robo-taxis in Graz and autonomous buses in a Madrid depot.
The remaining studies used a locally built Estonian shuttle,( 16) Chinese autonomous buses( 21) and a Wizard-of-Oz vehicle whose automation was simulated.( 13) A safety steward or operator was present on board in every pilot, and in the Austrian trial some passengers reported feeling safe only because that operator was there.( 15)
The samples were convenience or self-selected in every study. The Berlin survey drew 227 men and 135 women with a mean age of 35.5 years,( 12) the Florida demonstration enrolled community-dwelling drivers aged 65 to 91 years,( 20) and the Baltic comparison reached passengers across four countries without a quota for representativeness.( 18)
The Chinese study surveyed commuters near autonomous bus stops in four cities,( 21) and the Swedish panel targeted people living, working or studying near the Kista service.( 17) Pilot years ranged from 2016 and 2017 in Austria( 15) to 2022 and 2023 in the SHOW project.( 19)
All ten pilots ran at low speed and in constrained environments. The Austrian shuttle operated on a 1.4-km public road,( 15) the Berlin shuttle circled an office campus,( 12) and the Kista service was free for first- and last-mile trips.( 17)
The Baltic minibuses ran on open roads in mixed traffic with up to eight seats and a safety driver,( 18) whereas the Karlsruhe shuttle was an on-demand service whose users complained about a complex booking app.( 14)
None of the pilots removed the steward, and none operated at the speed of conventional buses, so the acceptance measured here refers to a supervised, low-speed service. None of the services operated as a scheduled, driverless replacement for a conventional bus route, and most ran free of charge or at a heavily subsidised fare. Publication activity peaked in 2021 and 2024 (Figure 2).
Study | Country | Design | Sample (n) | Vehicle and pilot | Main finding |
|---|---|---|---|---|---|
Rybizki et al. (2022) | Germany | Pre-post WoZ field | 35 | WoZ shuttle, real traffic | Intention high before and after the ride |
Classen et al. (2021) | United States | Pre-post demonstration | 104 | EZ10, bus depot | Technology readiness and barriers predicted intention |
Nordhoff et al. (2018) | Germany | Cross-sectional survey | 384 | EZ10, Berlin campus | Positive attitudes; speed and luggage space rated low |
Kalda et al. (2021) | Estonia | Cross-sectional survey | 51 | iseAuto shuttle, Tallinn | High experience and safety scores |
Barthelmes et al. (2024) | Germany | Cross-sectional survey | 202 | EVA Shuttle, Karlsruhe | 68.3% intended to use; users above non-users |
Rehrl et al. (2018) | Austria | Post-ride survey | 294 | Navya Arma, Koppl | 92% enjoyed the ride; 59% would not replace a car |
Dong et al. (2024) | China | Cross-sectional survey | 400 | Autonomous buses, four cities | Trust and satisfaction were the strongest predictors |
Papadopoulos et al. (2025) | Austria, Sweden, Spain | Correlational | 70 | SHOW pilots | Smooth driving correlated with comfort and safety |
Chee et al. (2020) | Sweden | Panel survey | 584 | EZ10, Kista | 44% unwilling to pay extra; safety and comfort drove WTP |
Bellone et al. (2021) | Poland, Finland, Norway, Estonia | Cross-sectional survey | 837 | Navya and EasyMile minibuses | Positive safety and experience; men scored lower |
Note: WoZ = Wizard-of-Oz; n = sample size; EZ10 = EasyMile EZ10.
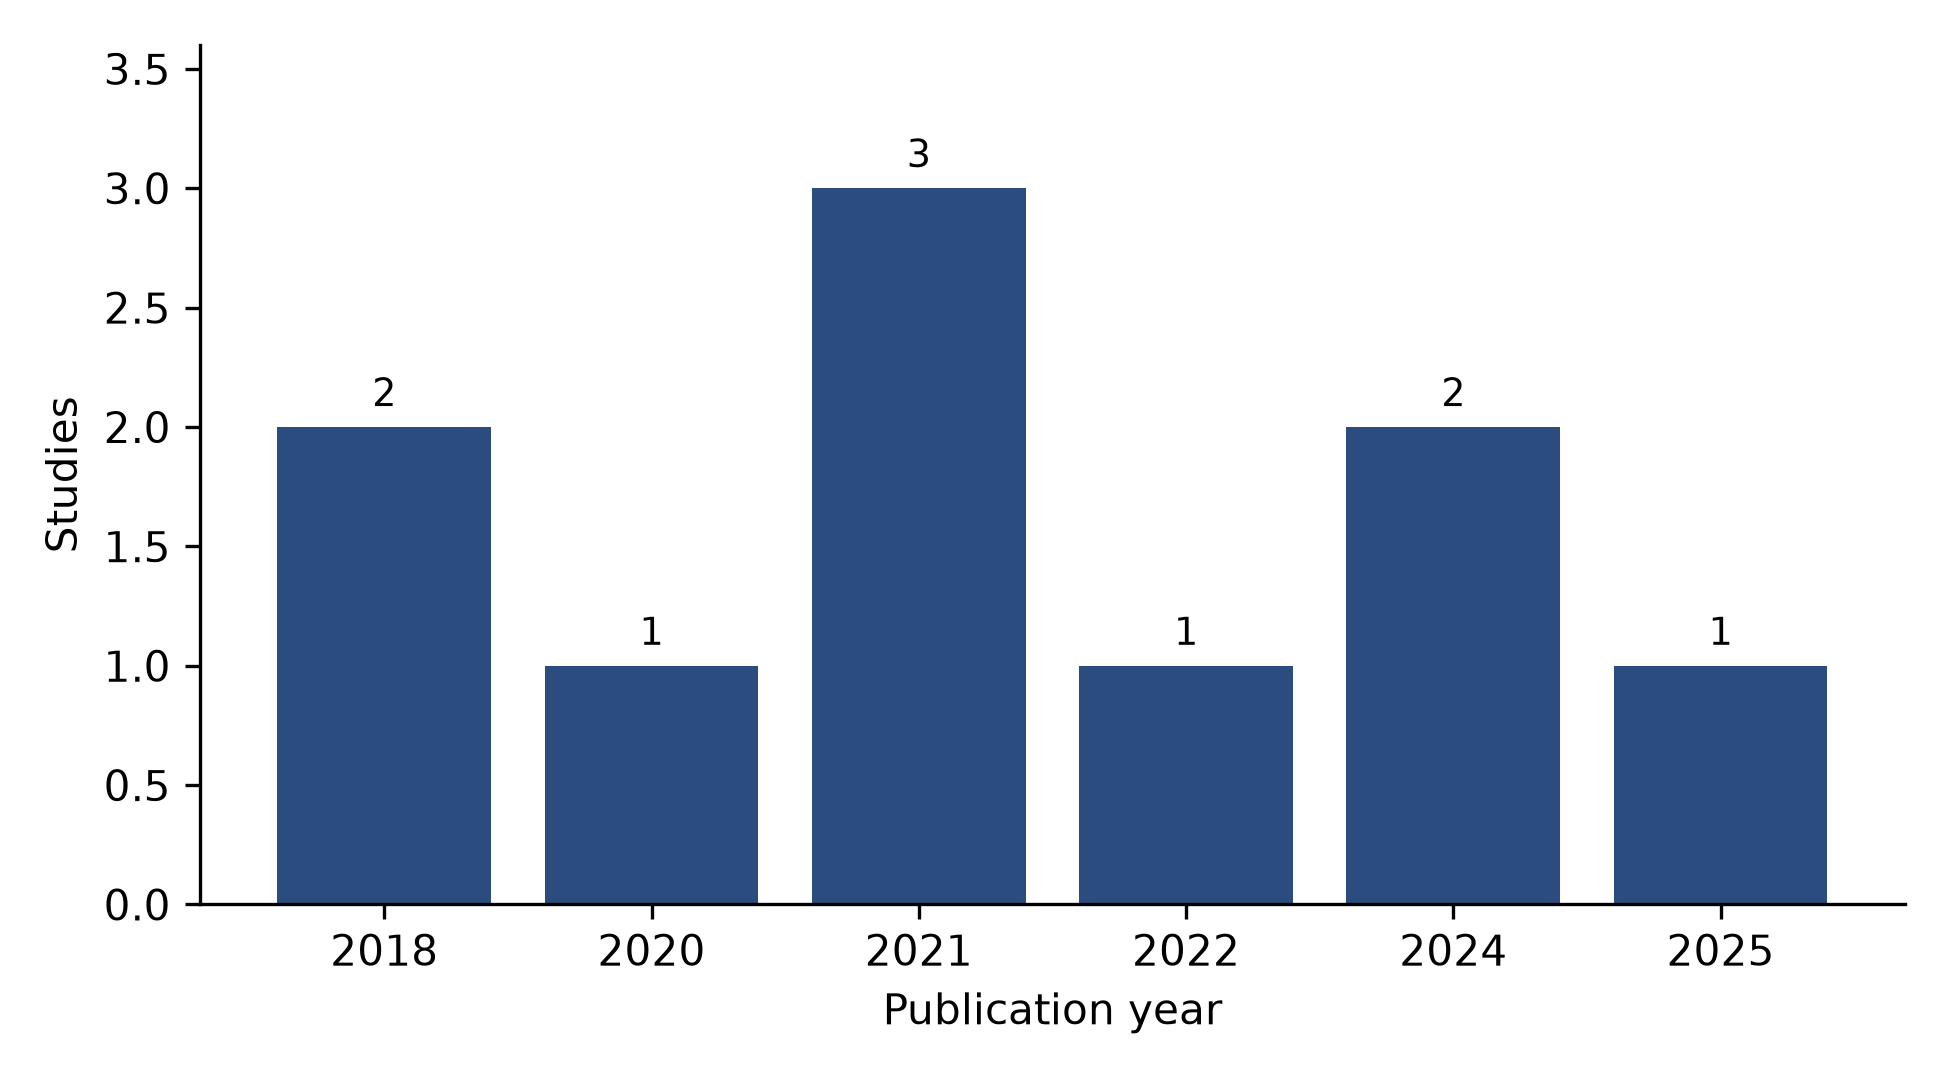
Figure 2. Number of included studies by publication year.
Risk of bias
No study was rated at low risk of bias: seven were rated moderate (7) and three high (3) (Table 2). The most frequent threats were self-selected or convenience samples, samples below 100 participants, and the absence of reported response rates. The three high-risk studies were the two smallest surveys and the correlation analysis, whose estimates were not statistically significant.
The moderate ratings reflected specific weaknesses rather than a common failure. Nordhoff et al.( 12) reached 384 of about 1,600 transported passengers, and Bellone et al.( 18) reached 837 of more than 15,000 passengers, so both samples skew toward people already interested in the technology.
Barthelmes et al.( 14) obtained a mailing response rate of 11.8% with young residents underrepresented, and Rehrl et al.( 15) surveyed a convenience sample of 294 of 874 passengers immediately after the ride. Kalda et al.( 16) surveyed 51 of 514 passengers with minimal methodological detail, and Papadopoulos et al.( 19) combined per-site passenger samples of 12 to 45 participants whose correlations did not reach statistical significance.
Instrument quality also varied. Four studies used validated scales, including UTAUT2 in the Wizard-of-Oz experiment,( 13) an extended UTAUT in the Chinese survey,( 21) and factor-analysed items in the Berlin and Kista questionnaires.( 12,17)
Others used ad hoc questionnaires with little reported psychometric detail, which weakens the comparability of the ratings.( 15,16) Blinding was absent everywhere, but for self-reported attitudes it is a minor rather than a decisive threat. None of the ratings reflects an intention to exclude, and the high-risk studies are retained because they are the only evidence for their specific contexts.
Study | Rating | Main concern |
|---|---|---|
Rybizki et al. (2022) | High | Small sample, Wizard-of-Oz setting |
Classen et al. (2021) | Moderate | Self-selected sample |
Nordhoff et al. (2018) | Moderate | Self-selected early adopters |
Kalda et al. (2021) | High | Small sample, minimal detail |
Barthelmes et al. (2024) | Moderate | Low response rate |
Rehrl et al. (2018) | Moderate | Convenience sample |
Dong et al. (2024) | Moderate | Non-probability sampling |
Papadopoulos et al. (2025) | High | Very small samples, nonsignificant |
Chee et al. (2020) | Moderate | Skewed sample |
Bellone et al. (2021) | Moderate | Voluntary sampling |
Users with direct shuttle experience versus users without it
All ten studies measured acceptance after a real ride, but only two studies directly compared riders with non-riders, and the direction of the difference was consistent.
Barthelmes et al.( 14) reported that, among residents who had used the EVA Shuttle, 74.4% intended to use automated minibuses, compared with 66.9% among residents who had not used it, a gap of 7.5 percentage points. Chee et al.( 17) found that automated bus ride experience predicted willingness to pay, together with perceived safety and ride comfort, in a sample in which 46.7% had taken at least one ride.
The pre-post studies point in the same direction. Rybizki et al.( 13) observed that behavioral intention was high before a first Wizard-of-Oz ride and remained high afterward, with performance expectancy as the only significant predictor before exposure. Classen et al.( 20) found that intention to use after a ride depended on technology readiness (beta = 0.247) and on barriers to acceptance (beta = -0.504), whereas age, cognition and driving habits did not predict intention.
The trajectory within the pre-post studies was stable rather than transformational. Rybizki et al.( 13) measured intention at three points, before the first ride, after the first ride and after a second ride with two staged incidents, and intention remained high at all three points, with performance expectancy the only predictor that was significant before exposure. Classen et al.( 20) reported that driving difficulty predicted intention in the regression model (p = 0.019), whereas the structural model attributed intention to technology readiness and to perceived barriers. Intention did not change materially across the measurement points.
Post-ride evaluations were positive even when they stopped short of full endorsement. Rehrl et al.( 15) recorded that more than 92% of passengers enjoyed the ride, although 59% rejected the idea that a self-driving shuttle could replace their car. Nordhoff et al.( 12) reported that older respondents expressed a higher intention to use the shuttle, yet rated the shuttle less effective than their existing travel.
The Tallinn survey showed the same ceiling, with 94.1% willing to ride during daytime compared with 59.9% at night.( 16)
Car replacement received the lowest endorsement. In the Austrian pilot, 40% of passengers could imagine a self-driving shuttle replacing their first or second car, whereas 59% could not.( 15) The Berlin respondents rated the shuttle less effective than their existing travel,( 12) and the Karlsruhe non-users named low speed and availability rather than fear as their reasons for not using the service.( 14) Acceptance as a feeder therefore coexists with a refusal to substitute the shuttle for the private car.
User-related versus system-related determinants
The determinants reported by the ten studies separated into those that reside in the user and those that reside in the vehicle and its service (Table 3). Trust and satisfaction were the strongest user-related predictors. Dong et al.( 21) estimated that satisfaction (beta = 0.202) and trust (beta = 0.165) predicted intention to use autonomous buses more strongly than performance expectancy (0.127), effort expectancy (0.117) or social influence (0.105), and that perceived risk weakened every one of these effects.
Technology readiness and prior familiarity operated in the same direction in older drivers( 20) and in Swedish commuters.( 17)
Preparedness also operated as a moderator rather than a direct cause. Older drivers with higher technology readiness expressed stronger intention to use, and the same construct shaped acceptance of the shuttle as a complement to, rather than a replacement for, the private car.( 20) In Karlsruhe, the highest intention to use was reported by mobility-impaired residents (91%) and by car-free households (78%).( 14) T
he Chinese model showed a related pattern, because perceived risk reduced the effect of every favourable predictor on intention.( 21)
Age and gender effects were smaller and less consistent. Bellone et al.( 18) found that men reported lower safety scores than women across the four Baltic cities, whereas Nordhoff et al.( 12) found older respondents more willing to use the shuttle. Neither age nor gender approached the size of the trust and readiness effects reported in the structural models.( 20,21)
System-related determinants centred on perceived safety, comfort, speed and service effectiveness. Perceived safety was high in the Austrian pilot, in which some passengers felt safe only because an operator was on board,(15) and in the Baltic comparison, in which mean safety scores ranged from 5.62 in Kongsberg to 6.60 in Gdansk on a seven-point scale.(18)
omfort followed the same pattern, with overall experience scores between 4.35 and 4.85 on a five-point scale across the four Baltic cities.( 18)
Speed and effectiveness were recurring weaknesses. Respondents in Berlin were less satisfied with shuttle speed and luggage space,( 12) and residents in Karlsruhe named low speed, a complex booking app and limited availability as barriers to use.( 14)
Objective vehicle data converged with these reports, because smoother speed profiles and fewer hard-braking events correlated with higher perceived comfort (rho = -0.93 and -0.99) and perceived safety (rho = -0.81 and -0.92).( 19) Willingness to pay in Kista rose with perceived safety and ride comfort, although almost half of respondents would pay nothing extra.( 17)
Context shaped the same determinants. Daytime willingness was higher than night-time willingness in Tallinn,( 16) and willingness to use without an operator varied across the Baltic cities, which suggests that perceived security, as distinct from traffic safety, responds to the surroundings of each route.( 18)
Comfort and safety also moved together: the multi-site comparison found that the site with the smoothest driving profile recorded the highest perceived comfort, and the site with the most hard-braking events recorded the lowest perceived safety.( 19)
System-related determinants appeared in more studies than user-related determinants across the ten studies. Perceived safety and comfort were reported in eight studies and speed and effectiveness in six, whereas trust and satisfaction appeared in three and technology readiness in two.
Frequency is not weight, but the asymmetry matches the structural models, in which the service features explained more variance in intention than the demographic variables did.( 20,21)
The same asymmetry appears in the willingness-to-pay evidence, where the service attributes, not the respondent profile, carried the pricing decision.( 17)
Domain | Determinant | Direction | Supporting studies |
|---|---|---|---|
User-related | Trust and satisfaction | Positive | Dong et al. (2024) |
User-related | Technology readiness | Positive | Classen et al. (2021) |
User-related | Prior ride experience and familiarity | Positive | Chee et al. (2020); Barthelmes et al. (2024) |
User-related | Older age | Mixed | Nordhoff et al. (2018) |
User-related | Gender | Mixed | Bellone et al. (2021) |
System-related | Perceived safety | Positive | Rehrl et al. (2018); Bellone et al. (2021) |
System-related | Comfort and smooth driving | Positive | Papadopoulos et al. (2025); Chee et al. (2020) |
System-related | Speed and effectiveness | Barrier | Nordhoff et al. (2018); Barthelmes et al. (2024) |
System-related | Night operation | Barrier | Kalda et al. (2021) |
DISCUSSION
The expectation that the public would resist automated shuttles was not confirmed by the included evidence. Ten studies with 2,961 participants reported acceptance and intention to use that were favourable before a ride and remained favourable afterward. The favourable average conceals two consistent contrasts, however: users with direct experience were more willing than users without it, and system-related determinants, particularly perceived safety and speed, bounded how far that acceptance extended.
The contrast between experienced and inexperienced users explains why the included studies differ from the wider stated-preference literature. Surveys that ask respondents to judge a hypothetical vehicle report moderate or cautious willingness to use,( 8,9) and emotions such as amusement rather than informed judgment shape that hypothetical intention.( 22)
Reviews of that literature describe acceptance as fragile.( 3,10) Compared with those surveys, the pilot studies reviewed here recorded stronger intention to use after exposure, a pattern that Barthelmes et al.( 14) captured directly by showing that users were 7.5 percentage points more willing than non-users.
A field experiment in China reports the same experience effect for shared autonomous vehicles,( 23) and temporal studies of automated buses find that acceptance and recommendation rise as exposure accumulates.( 24) The mechanism is plausible: a supervised, low-speed ride replaces the uncertainty that dominates hypothetical judgments with a concrete, generally uneventful experience.
The psychological mechanism behind the experience effect is consistent with the theory of planned behaviour and its successors. Actual experience converts abstract expectations into concrete beliefs about ease of use and safety, which then feed intention through the same paths that the models specify.( 5,7)
The emotions that colour hypothetical judgments, such as amusement without direct knowledge, give way to evaluations grounded in a remembered ride.( 22) Because a supervised, low-speed ride is usually uneventful, the beliefs it produces are favourable, which explains both the high post-ride scores and their fragility once the service changes.
The user-related determinants converge with the general technology acceptance literature. Trust and satisfaction were the strongest predictors of intention in the Chinese pilot study,( 21) which matches studies in which trust and technology anxiety outweigh performance expectations in highly automated vehicles( 25) and in which trust moderates intention in a dual SEM and fuzzy-set analysis.( 26)
Perceived usefulness and ease of use remain central in survey samples,( 27) including the comparison of partially and fully automated vehicles( 28) and a priori acceptance of fully automated vehicles.( 29) The role of technology readiness in older drivers( 20) agrees with work on older adults, who show favourable attitudes but distinct barriers.( 30-32)
Gender differences were weak in the included evidence, whereas several survey studies report lower acceptance among women;(33) the difference may reflect the self-selected samples of pilot riders rather than a stable gender effect.
For older adults the pattern is particularly clear. The included demonstration found that technology readiness, not age itself, predicted intention,( 20) and the wider literature reaches the same conclusion for older drivers and for older adults in Malaysia, whose acceptance turns on trust and perceived risk rather than on chronological age.( 30-32)
This matters for service design, because it implies that training and reassurance, not demographic targeting, are the levers for older riders.
The system-related determinants are the finding with the clearest practical implication. Perceived safety, comfort, speed and service effectiveness recurred across almost every included study, from the Digibus trial in Austria( 15) to the Baltic comparison( 18) and the Berlin campus.( 12)
This aligns with earlier reviews that identify safety and comfort as the central conditions for shuttle deployment( 34) and with the synthesis of American shuttle pilots, which reports similar operational constraints.( 35)
The Brussels and Trikala pilots reported in the wider literature show the same high post-ride satisfaction together with reservations about speed and car replacement.( 36,37)
Smooth driving appears to translate directly into acceptance: objective speed and braking profiles correlated with perceived comfort and safety,( 19) and willingness to pay in Kista rose with perceived safety and comfort.( 17)
A further contrast runs through the included studies but is rarely quantified: the presence of the safety steward. In the Austrian trial some passengers reported feeling safe only because an operator was on board,( 15) and in the Baltic comparison the minibuses always carried a safety driver.( 18)
This finding qualifies the high safety scores and matches the stated-preference literature, in which the absence of a human operator is among the strongest sources of reluctance.( 9,29) Acceptance measured under supervision may therefore not transfer to a future service that removes the steward, and the conditional phrasing reported by passengers in Koppl should be read as a boundary on the favourable results.
A distinction that two studies make implicitly is worth making explicit: perceived traffic safety and perceived personal security are different constructs. The Baltic comparison measured both and found that they behaved differently across cities, with personal security responding to the surroundings of each route.( 18)
The Tallinn night-time drop in willingness to ride is a security effect rather than a traffic-safety effect.( 16) Interventions aimed at traffic safety, such as smoother driving,( 19) will therefore not automatically address the security concerns that suppress night-time and unaccompanied use.
Heterogeneity across contexts qualifies the synthesis. The included studies span three regions and nine countries, and the multi-country comparison found that mean safety scores varied from 5.62 to 6.60 across four cities, partly because of route design.( 18)
Cross-cultural work reports different weights for the same determinants in China and Europe,( 38) and city size moderates intention to adopt in China,( 39) while young adults in China respond to a different configuration of trust and social influence.( 40)
Policy measures and pricing also shift acceptance, which is consistent with the finding that almost half of the Kista respondents would pay nothing extra( 17) and with the moderating effect of policy on adoption intention.( 41) These contextual effects mean that a determinant identified in one pilot should not be generalized to another without the deployment conditions.
The geographic concentration of the evidence limits external validity. Eight of the ten studies were European, and the European pilots were mostly small, dense and walkable settings; the single North American study was a depot demonstration for older drivers, and the single Asian study was a four-city survey.
Whether the same determinants hold in suburban, car-dependent or low-income contexts is unknown, and the two multi-country studies show that even within Europe the weights of the determinants shift between cities.(18,19) Transferring these findings to other regions should therefore be done with the deployment context attached.
Measurement heterogeneity is a further source of divergence. The included studies used UTAUT2 scales,( 13) extensions of UTAUT with satisfaction and trust,( 21) principal components of shuttle attributes,( 12) and ad hoc experience questionnaires,( 15,18) which is why a meta-analysis was not possible.
The frameworks themselves predict overlapping constructs, and the shuttle adaptation of UTAUT( 2) shows that performance expectancy and facilitating conditions do not always behave as the generic model expects once a real vehicle replaces a hypothetical one.
The certainty of this evidence is low. The three high-risk studies, the absence of a single low-risk study and the small samples that dominate the field mean that the point estimates reported here, from the 7.5 percentage-point experience gap to the trust coefficients in the Chinese model, are imprecise and probably optimistic. The consistency of the direction of effects across countries and designs is the strongest feature of the evidence, whereas the magnitude of any single determinant should be treated with caution.
Read together, the two contrasts describe a single funnel. A person enters the pilot with a prior shaped by age, readiness and habit; the ride then acts on that prior mainly through safety, comfort and the perception that the service is effective; and the outcome is an intention that remains conditional on the same system features. Where the system features are weak, as in night operation or car replacement, the favourable prior does not convert into use. This funnel is the most parsimonious account of the ten studies and the clearest guide for operators and authorities.
The review has several strengths. It is the first synthesis restricted to acceptance measured in real shuttle pilots, and it separates determinants that belong to the user from those that belong to the system. The PRISMA flow and the extraction table make every count reproducible, and the risk-of-bias appraisal is attached to each study rather than stated in aggregate. The explicit reporting of the not-retrieved reports keeps the selection transparent. The two-contrast structure, which separates the person from the service, is a deliberate simplification that mirrors how operators actually design interventions.
All included studies employed quantitative designs and relied on non-probability convenience samples, limiting the generalizability of the findings. None was assessed as having a low risk of bias, raising concerns that the favourable attitudes reported may overestimate acceptance among the general population. Additionally, restricting eligibility to open-access full texts prevented the assessment of 113 potentially relevant reports, which may have excluded relevant evidence and introduced selection bias. Future reviews should seek institutional access to these publications to improve the comprehensiveness of the evidence base.
The practical implications follow from the two contrasts. Operators should treat the first ride as the main conversion instrument, because exposure raises intention to use, and should invest in the system-related determinants that bound acceptance: perceived safety, smooth and comfortable driving, and a service that is fast enough and available enough to compete with existing travel. Where those constraints are not met, as in the night-operation and car-replacement findings, acceptance remains conditional even among users who enjoyed the ride.
For public authorities, the implications extend beyond the pilot. The finding that almost half of the Kista respondents would pay nothing extra( 17) and that policy measures moderate adoption intention( 41) suggests that fare policy and regulation, not only vehicle performance, will decide whether automated shuttles move from demonstration to scheduled service.
The accessibility signal in Karlsruhe, where mobility-impaired residents reported the highest intention to use,( 14) argues for positioning shuttles as an inclusive service rather than a technology demonstration.
For researchers, the agenda is equally concrete. The ten studies agree on direction but not on instruments, so a common core questionnaire that adds trust, safety and comfort items to UTAUT2(6) would make the next generation of pilots comparable and, eventually, meta-analysable. Longitudinal designs that follow the same riders before and after exposure would replace the current reliance on cross-sectional snapshots, and studies that separate users from non-users would let the experience effect be estimated in every pilot rather than in the two that quantified it.( 14,17)
CONCLUSIONS
The review characterized ten studies of acceptance of automated shuttles in real-world pilots, published between 2018 and 2025 and conducted mostly in Europe. The determinants separated into user-related factors, led by trust, satisfaction and technology readiness, and system-related factors, led by perceived safety, comfort and speed. Users with direct shuttle experience were consistently more willing than users without it, and the pre-post studies showed that acceptance remained high after exposure. The evidence is limited by small self-selected samples and by the absence of low-risk-of-bias studies, so the favourable estimates should be read as the attitudes of early adopters rather than of the general public.
References
- 1 Fagnant DJ, Kockelman K. Preparing a nation for autonomous vehicles: opportunities, barriers and policy recommendations. Transportation Research Part A: Policy and Practice. 2015;77:167-181. doi: 10.1016/j.tra.2015.04.003
- 2 Madigan R, Louw T, Dziennus M, Graindorge T, Ortega E, Graindorge M, et al. Acceptance of Automated Road Transport Systems (ARTS): An Adaptation of the UTAUT Model. Transportation Research Procedia. 2016;14:2217-2226. doi: 10.1016/j.trpro.2016.05.237
- 3 Becker F, Axhausen KW. Literature review on surveys investigating the acceptance of automated vehicles. Transportation. 2017;44(6):1293-1306. doi: 10.1007/s11116-017-9808-9
- 4 Davis FD. Perceived Usefulness, Perceived Ease of Use, and User Acceptance of Information Technology. MIS Quarterly. 1989;13(3):319-340. doi: 10.2307/249008
- 5 Venkatesh V, Morris MG, Davis GB, Davis FD. User Acceptance of Information Technology: Toward A Unified View1. MIS Quarterly. 2003;27(3):425-478. doi: 10.2307/30036540
- 6 Venkatesh V, Thong JYL, Xu X. Consumer Acceptance and Use of Information Technology: Extending the Unified Theory of Acceptance and Use of Technology1. MIS Quarterly. 2012;36(1):157-178. doi: 10.2307/41410412
- 7 Ajzen I. The theory of planned behavior. Organizational Behavior and Human Decision Processes. 1991;50(2):179-211. doi: 10.1016/0749-5978(91)90020-t
- 8 Nordhoff S, de Winter J, Kyriakidis M, van Arem B, Happee R. Acceptance of Driverless Vehicles: Results from a Large Cross-National Questionnaire Study. Journal of Advanced Transportation. 2018;2018:1-22. doi: 10.1155/2018/5382192
- 9 Kyriakidis M, Happee R, de Winter JCF. Public opinion on automated driving: Results of an international questionnaire among 5000 respondents. Transportation Research Part F: Traffic Psychology and Behaviour. 2015;32:127-140. doi: 10.1016/j.trf.2015.04.014
- 10 Gkartzonikas C, Gkritza K. What have we learned? A review of stated preference and choice studies on autonomous vehicles. Transportation Research Part C: Emerging Technologies. 2019;98:323-337. doi: 10.1016/j.trc.2018.12.003
- 11 Page MJ, McKenzie JE, Bossuyt PM, Boutron I, Hoffmann TC, Mulrow CD, et al. The PRISMA 2020 statement: an updated guideline for reporting systematic reviews. BMJ. 2021:n71. doi: 10.1136/bmj.n71
- 12 Nordhoff S, de Winter J, Madigan R, Merat N, van Arem B, Happee R. User acceptance of automated shuttles in Berlin-Schöneberg: A questionnaire study. Transportation Research Part F: Traffic Psychology and Behaviour. 2018;58:843-854. doi: 10.1016/j.trf.2018.06.024
- 13 Rybizki A, Ihme K, Nguyen HP, Onnasch L, Bosch E. Acceptance of Automated Shuttles—Application and Extension of the UTAUT-2 Model to Wizard-of-Oz Automated Driving in Real-Life Traffic. Future Transportation. 2022;2(4):1010-1027. doi: 10.3390/futuretransp2040056
- 14 Barthelmes L, Wilkes G, Kagerbauer M, Vortisch P. Exploring the determinants of autonomous minibus adoption: empirical findings from a demand-based service in Germany. Eur Transp Res Rev. 2024;16(1):35. doi: 10.1186/s12544-024-00659-9
- 15 Rehrl K, Zankl C. Digibus©: results from the first self-driving shuttle trial on a public road in Austria. Eur Transp Res Rev. 2018;10(2):51. doi: 10.1186/s12544-018-0326-4
- 16 Kalda K, Sell R, Soe RM. Use case of Autonomous Vehicle shuttle and passenger acceptance analysis. PEAS. 2021;70(4):429-435. doi: 10.3176/proc.2021.4.09
- 17 Chee PNE, Susilo YO, Wong YD, Pernestål A. Which factors affect willingness-to-pay for automated vehicle services? Evidence from public road deployment in Stockholm, Sweden. Eur Transp Res Rev. 2020;12(1):20. doi: 10.1186/s12544-020-00404-y
- 18 Bellone M, Ismailogullari A, Kantala T, Mäkinen S, Soe RM, Kyyrö MÅ. A cross-country comparison of user experience of public autonomous transport. Eur Transp Res Rev. 2021;13(1):19. doi: 10.1186/s12544-021-00477-3
- 19 Papadopoulos A, Spanos G, Pont J, Lalas A, Votis K, Gkemou M, et al. Correlation of Shared Automated Vehicles Real Traffic Performance and Passengers’ Acceptance Data. In: Lecture Notes in Mobility. Springer Nature Switzerland; 2025. p. 177-195. doi: 10.1007/978-3-031-71793-2_11
- 20 Classen S, Mason JR, Hwangbo SW, Sisiopiku V. Predicting Autonomous Shuttle Acceptance in Older Drivers Based on Technology Readiness/Use/Barriers, Life Space, Driving Habits, and Cognition. Front Neurol. 2021;12:798762. doi: 10.3389/fneur.2021.798762
- 21 Dong H, Hashim H, Kamarulzaman NH. Factors Influencing Passengers to Use Autonomous Bus in China Cities. IJTDI. 2024;8(1):119-129. doi: 10.18280/ijtdi.080111
- 22 Zoellick JC, Kuhlmey A, Schenk L, Schindel D, Blüher S. Amused, accepted, and used? Attitudes and emotions towards automated vehicles, their relationships, and predictive value for usage intention. Transportation Research Part F: Traffic Psychology and Behaviour. 2019;65:68-78. doi: 10.1016/j.trf.2019.07.009
- 23 Yan F, Shi Z, Liu J. Do Sustainability Concerns Play a Key Role in Influencing Individuals’ Acceptance after Experiencing Shared Autonomous Vehicles? A Field Experiment in China. International Journal of Human–Computer Interaction. 2025;41(2):834-847. doi: 10.1080/10447318.2024.2305984
- 24 Guo J, Kang X, Susilo Y, Antoniou C, Pernestål A. Temporal patterns of user acceptance and recommendation of the automated buses. Travel Behaviour and Society. 2025;38:100909. doi: 10.1016/j.tbs.2024.100909
- 25 Man SS, Ding M, Li X, Chan AHS, Zhang T. Acceptance of Highly Automated Vehicles: The Role of Facilitating Condition, Technology Anxiety, Social Influence and Trust. International Journal of Human–Computer Interaction. 2025;41(6):3684-3695. doi: 10.1080/10447318.2024.2316389
- 26 Ani A, Xing F, Oroni CZ. Modeling behavioral intentions to adopt autonomous vehicles: A dual SEM–FsQCA approach to trust, technology acceptance, and the moderating role of social influence. Transportation Research Part F: Traffic Psychology and Behaviour. 2025;114:597-620. doi: 10.1016/j.trf.2025.06.021
- 27 Peng W, Robinson-Tay K. Assessing the characteristics and outcomes of perceived usefulness and ease of use for autonomous vehicle adoption. Transportation Research Part F: Traffic Psychology and Behaviour. 2025;111:391-408. doi: 10.1016/j.trf.2025.03.014
- 28 Zhu G, Chen Y, Zheng J. Partially autonomous vehicles (PAVs) vs. fully autonomous vehicles (FAVs): A comparative study with adoption models. Technology in Society. 2024;79:102698. doi: 10.1016/j.techsoc.2024.102698
- 29 Rejali S, Aghabayk K, Shiwakoti N. Assessing public a priori acceptance of fully automated vehicles using an extended technology acceptance model and importance-performance analysis. IATSS Research. 2024;48(4):537-549. doi: 10.1016/j.iatssr.2024.10.004
- 30 Classen S, Mason J, Hwangbo SW, Wersal J, Rogers J, Sisiopiku V. Older drivers’ experience with automated vehicle technology. Journal of Transport & Health. 2021;22:101107. doi: 10.1016/j.jth.2021.101107
- 31 Than Win A, Nelson JD, Ho C. Perceptions of autonomous vehicles among older adults and people with physical disability. Journal of Urban Mobility. 2025;8:100165. doi: 10.1016/j.urbmob.2025.100165
- 32 Ho JS, Tan BC, Lau TC, Khan N, Pang SM. Elderly Acceptance of Autonomous Vehicles in Malaysia: An Extended Technology Acceptance Model with Multidimensional Trust and Perceived Risk. JOIV : Int J Inform Visualization. 2025;9(2):624. doi: 10.62527/joiv.9.2.3363
- 33 Alonso Vacca E, Choi S, Ko J. Gender differences in the acceptance of autonomous vehicles: application of the extended technology acceptance model. International Journal of Urban Sciences. 2025:1-28. doi: 10.1080/12265934.2025.2570860
- 34 Iclodean C, Cordos N, Varga BO. Autonomous Shuttle Bus for Public Transportation: A Review. Energies. 2020;13(11):2917. doi: 10.3390/en13112917
- 35 Haque AM, Brakewood C. A synthesis and comparison of American automated shuttle pilot projects. Case Studies on Transport Policy. 2020;8(3):928-937. doi: 10.1016/j.cstp.2020.05.005
- 36 Feys M, Rombaut E, Vanhaverbeke L. Experience and Acceptance of Autonomous Shuttles in the Brussels Capital Region. Sustainability. 2020;12(20):8403. doi: 10.3390/su12208403
- 37 Niavis S, Gavanas N, Anastasiadou K, Arvanitidis P. Investigating Users’ Acceptance of Autonomous Buses by Examining Their Willingness to Use and Willingness to Pay: The Case of the City of Trikala, Greece. Urban Science. 2025;9(8):298. doi: 10.3390/urbansci9080298
- 38 Yang Y, Peng L, Wan D. A Comparative Study on the Acceptance of Autonomous Driving Technology by China and Europe: A Cross-Cultural Empirical Analysis Based on the Technology Acceptance Model. WEVJ. 2025;16(11):589. doi: 10.3390/wevj16110589
- 39 Tang T, Chen J, Guo Y, Sheng D, Li X, Anastasopoulos PC. Intention to adopt autonomous vehicles in China: a comparative study among residents in different-sized cities. Transportation Letters. 2025;17(5):910-929. doi: 10.1080/19427867.2024.2399422
- 40 Pan Z, Zheng H. Investigating autonomous vehicle acceptance among young adults in China. Transportation Research Part F: Traffic Psychology and Behaviour. 2025;115:103331. doi: 10.1016/j.trf.2025.103331
- 41 Tang T, Guo Y, Souders DJ, Li X, Yang M, Xu X, et al. Moderating effects of policy measures on intention to adopt autonomous vehicles: Evidence from China. Travel Behaviour and Society. 2025;38:100921. doi: 10.1016/j.tbs.2024.100921
Declarations
Funding
No financing
Conflict of interest
None
Authorship contributions
Drafting – original draft: Pedro Antonio Valdez Lizárraga, Yasniel Sánchez Suárez.
Writing–review and editing: Pedro Antonio Valdez Lizárraga, Yasniel Sánchez Suárez.