

Abstract
Introduction: Frequent public transport service is central to urban accessibility, yet the share of the population that can reach it on foot is rarely quantified with open data in Latin American capitals. Methods: Cross-sectional ecological study. Twenty Latin American capitals were screened against the open GTFS feeds of the Mobility Database catalog. For the capitals with a downloadable urban feed, the average weekday headway (07:00-20:00) was computed per stop and stops were classified as frequent at 15 minutes or less. The 800 m walking buffers of frequent stops were overlaid on the 2020 GHSL population grid within a 10 km disc around each city centre. Results: Five of the twenty capitals had an open urban GTFS feed. The population-weighted coverage was 90.4%, ranging from 99.8% in Santiago and 99.7% in Bogotá to 88.9% in Managua and 34.3% in La Paz. Stricter thresholds reduced coverage mainly in Managua (73.5%) and La Paz (18.7%). Conclusions: In capitals with consolidated frequent networks, coverage is near universal within 800 m, whereas coverage is markedly lower where the open feed describes only part of the network. The availability of open schedules restricts the sample of cities.
Keywords
public transport, GTFS, accessibility, service frequency, Latin America, population grid
INTRODUCTION
Frequent public transport is the backbone of daily accessibility in large Latin American cities, where a substantial share of trips is made by bus, metro and informal services rather than by private car. A stop is conventionally treated as frequent when a vehicle arrives at least every 15 minutes, and a resident is considered covered when that stop lies within a short walk of home, most often 400 to 800 metres.( 1)
The two thresholds, service frequency and walking distance, jointly define the population that can rely on public transport without consulting a timetable, and they are the operational core of policies that promise a frequent network for all residents.( 2) Walking distance is not a minor detail in this definition, because reported walking distances to stops concentrate within 500 to 800 m and decline steeply beyond that range.( 3,4)
The share of residents who live within reach of frequent service is a direct measure of whether the network reaches the people it is meant to serve, and it underlies the international monitoring of access to public transport as part of the sustainable development agenda.( 5)
Several of the region's capitals pioneered bus rapid transit and integrated fare systems during the 2000s, so the question of how much of the population these networks actually reach is of long-standing policy interest. Measuring this share requires combining the geometry of the network with a spatially explicit population layer, a task that open schedules and open population grids have now made reproducible.
The spread of the General Transit Feed Specification has turned this measurement into a routine computation, because schedules, stop locations and frequencies are published as open, machine-readable files in many cities.( 6,7)
Researchers have used these files to quantify job accessibility and its social distribution in São Paulo, Rio de Janeiro, Curitiba and Recife,( 8) to show how bus rapid transit changed access to opportunities for the poor in Lima,( 9) and to document the uneven geography of accessibility in Montevideo.( 10,11)
Slovic and colleagues linked accessibility restrictions to overlapping social inequalities in São Paulo,( 12) and Moreno-Monroy and colleagues connected public transport provision to school access in the same city.( 13) City-level GIS assessments in Mexico and Brazil show that the spatial reach of stops and frequent corridors varies widely within the region, even among cities that appear similar in size.( 14,15)
Capital cities are the natural unit for such a comparison because they concentrate both population and the institutional capacity to publish open schedules, and because their networks set the standard that secondary cities later follow. Informal and semiformal services, which carry a large share of trips in many of these cities, are usually absent from open schedules and therefore remain outside most coverage measures.( 16)
Methodological work has matured in parallel: network-based measures, the choice of accessibility indicator and GTFS-based gap metrics now allow coverage and equity to be compared across cities and over time.( 17-19)
Most of this regional literature measures travel times to destinations rather than the simpler supply-side question of whether a resident lives within walking distance of a frequent stop, and it concentrates on the largest and best-documented metropolitan areas.( 20)
The coverage of the population by frequent service, computed consistently across the capital cities of the region, has received less attention.( 21,22)
The objective of this study was to quantify the share of the population living within walking distance of a frequent public transport stop in Latin American capital cities, using only open, downloadable schedules and an open population grid. Three research questions guided the analysis. P1: which Latin American capital cities publish an open GTFS schedule feed that can be downloaded without login, and what network does each feed describe? P2: what share of the population in each capital lives within 800 m of a stop with weekday service at least every 15 minutes? P3: how much does that share change when the walking distance is shortened to 500 m, the frequency threshold is tightened to 10 minutes, or the study area is enlarged to a 15 km radius?
METHODS
The reporting follows the STROBE statement for observational studies. The design is cross-sectional and ecological: the unit of analysis is the capital city, and the outcome is a single coverage share computed for each city from two open data sources, without any individual-level data. Because the metric is computed over the complete grid and the complete stop set of each city, it is a census of the study area rather than an estimate from a sample.
City selection
City selection addressed P1. The twenty capital cities of the sovereign states of Latin America were screened against the GTFS schedule catalogue of the Mobility Database, an open registry maintained on GitHub.( 23) Latin America was taken to comprise the Spanish- and Portuguese-speaking countries of the Americas plus Haiti, and the capital was the seat of national government in each case.
Where a country has two capitals, the seat of government was used, so for Bolivia the studied city is La Paz, whose cable car network has an open feed, rather than the constitutional capital Sucre. A city was eligible when its capital had at least one GTFS feed whose download responded over HTTP without login and whose network described urban public transport within the capital rather than intercity or national services.
The download check was performed with an automated probe that retrieved the resource and recorded the HTTP status and content type, and feeds that failed or required authentication were treated as not downloadable. For each included city the feed vintage and the transport mode covered were extracted from the feed metadata and are reported in Table 1. The screening is deterministic and can be repeated against any future version of the catalogue, which is the point of using a public registry rather than an ad hoc list of feeds.
The catalogue lists several thousand GTFS schedule feeds worldwide, and the Latin American subset was extracted by country code so that a capital could not be missed under an unexpected feed name. Every download was recorded with its URL, retrieval date, byte size and hash, so that the provenance of each feed can be cited and audited, and the reasons for exclusion are preserved in the supplementary record rather than collapsed into a single count.
Stop frequency
Stop-level frequency was computed to answer P2. For every included feed the files stops, stop_times, trips and calendar or calendar_dates were read with the pandas library in Python.( 6)
A reference weekday was defined from the calendar: services marked as operating on Wednesday, or, in feeds without weekly flags, the services active on the Wednesday with the most active services within the feed period. Times written after midnight were normalised to the same day before the window was applied.
For each stop, the average combined headway between 07:00 and 20:00 was estimated as the length of that window divided by the number of scheduled departures. Schedule-based trips contributed one departure per scheduled time within the window, and frequency-based trips contributed their scheduled headway during the overlapping period, so that feeds built on frequencies.txt and feeds built on explicit stop_times were reduced to the same unit of departures per hour.
Frequency entries declared with exact times were treated as schedule-based trips, and a trip with several time-of-day headways contributed the sum of its partial contributions within the window, which preserves the effect of peak-only services. A stop was classified as frequent when its average headway was 15 minutes or less, and the stricter 10-minute threshold was retained for the sensitivity analysis, following the operational definition of a frequent network used in the literature.( 2)
The window from 07:00 to 20:00 was chosen because it spans the main daytime service period during which a frequent network is expected to operate, and weekend and night services were excluded so that the comparison reflects a typical working day. Where the same stop appeared in several feeds of one city, the minimum headway across feeds was retained, so that a station served by both a bus and a metro feed was not penalised by the sparser of the two. Stops with no weekday departures in the window were retained in the stop inventory but were never classified as frequent, which is the intended behaviour for stops served only at night or on weekends.
Population grid and study area
The study area and the population layer also served P2. Population was taken from the Global Human Settlement Layer population grid of the Joint Research Centre, GHS-POP for the year 2020 in its R2023A release, at 30 arc-seconds of resolution in geographic coordinates.( 24)
The 2020 epoch was chosen because it is the most recent year for which the global grid is complete and consistent across countries, which matters for a cross-national comparison. For each city a circular study area of 10 km radius was drawn around a documented central reference point taken from public gazetteers, and a 15 km radius was used in the sensitivity analysis. The circle was chosen as a standardised analytical zone that does not depend on administrative boundaries, which differ in shape and vintage across countries.
The layer stores population counts, not densities, and its cells measure about 0.93 km from east to west and 0.93 km from north to south at the latitudes of the studied cities. The grid was used as published, without resampling, so that the coverage shares correspond to the native resolution of the source rather than to an interpolated surface. The raster window covering each study area was read with windowed access, so that only the cells around each city were loaded, and the affine transform of the grid provided the corner coordinates of every cell. Cell polygons were then constructed from those corners, and each cell was assigned its population count, with nodata cells treated as zero. The combination of a fine population grid and pedestrian access zones around stops follows the practice of recent walking-accessibility studies.( 25,26)
Coverage metric
The coverage metric combined the two layers. The frequent stops of each city were projected to a local transverse Mercator zone, selected from the city longitude, so that buffers could be drawn in metres rather than in degrees, and each stop was buffered by 800 m, or by 500 m in the sensitivity analysis. These distances are consistent with the walking ranges that researchers consider acceptable for stop access.( 27,28)
The union of the buffers was then computed as a single polygon per city and threshold combination, which removes the double counting that would arise from overlapping buffers of adjacent stops. This union was intersected with each population cell of the study area, and the covered population was computed as the sum of cell populations weighted by the fraction of the cell area inside the union. Area weighting, rather than a simple centroid rule, was used so that a cell crossed by the boundary of a buffer contributes in proportion to the share of its area that actually falls inside the walkable zone.
Coverage was expressed as the covered population divided by the total population of the study area, multiplied by one hundred. A share of one hundred percent does not imply that every resident can reach all destinations, only that every resident can walk to at least one frequent stop, so the metric measures access to the network rather than access to opportunities. This computation is a full enumeration of the grid and of the stop set, so no sampling error or confidence interval applies; descriptive comparisons across cities are reported instead.( 29)
Sensitivity analyses
Sensitivity analyses answered P3. The coverage share was recomputed under the four combinations of walking distance and frequency threshold, and under the enlarged 15 km radius, as described above. This parallels the sensitivity checks that earlier GTFS-based assessments used to test the influence of threshold choices on accessibility rankings and on the detection of coverage gaps.( 18,30)
The choice of thresholds is transparent and reported, so that the reader can judge whether the primary definition of frequent service is permissive or strict. No additional exclusion criteria were applied in the sensitivity runs, so any change in the result can be attributed to the parameter being varied.
RESULTS
The analysis comprised five capitals, seven GTFS feeds and a combined study-area population of 11,710,484 people distributed over the 2020 population grid. The three questions are reported in turn, each subsection opening with the main figure and closing with a single-number summary.
Open schedules were available for five of twenty capitals
Regarding the first question, an open urban GTFS feed was downloadable for five of the twenty capital cities (Table 1).
Country | Capital | Feed in catalog | Feed mode | Downloadable | Status |
|---|---|---|---|---|---|
Argentina | Buenos Aires | yes | urban | yes | included |
Bolivia | La Paz | yes | cable car | yes | included |
Brazil | Brasilia | no | - | - | no feed in catalog |
Chile | Santiago | yes | urban | yes | included |
Colombia | Bogota | yes | urban | yes | included |
Costa Rica | San Jose | yes | rail | no | feed did not respond (404) |
Cuba | Havana | no | - | - | no feed in catalog |
Dominican Republic | Santo Domingo | no | - | - | no feed in catalog |
Ecuador | Quito | no | - | - | no feed in catalog |
El Salvador | San Salvador | no | - | - | no feed in catalog |
Guatemala | Guatemala City | no | - | - | no feed in catalog |
Haiti | Port-au-Prince | no | - | - | no feed in catalog |
Honduras | Tegucigalpa | yes | intercity | yes | intercity coaches/ferries, not urban |
Mexico | Mexico City | yes | urban | no | portal did not respond (timeout) |
Nicaragua | Managua | yes | urban | yes | included |
Panama | Panama City | no | - | - | no feed in catalog |
Paraguay | Asuncion | no | - | - | no feed in catalog |
Peru | Lima | no | - | - | no urban feed in catalog |
Uruguay | Montevideo | no | - | - | no feed in catalog |
Venezuela | Caracas | no | - | - | no feed in catalog |
Buenos Aires, Santiago, Bogotá and Managua provided urban bus or integrated bus and rail feeds, while La Paz provided a cable car feed only. Fifteen capitals were excluded: nine had no GTFS feed of the capital in the catalogue, Mexico City and San José had feeds that did not respond or resolve over HTTP, Tegucigalpa had only an intercity coach and ferry feed, and Brazil, Peru and Uruguay had feeds for other cities but not for the capital.
The five included cities were analysed with seven feeds in total, and their feed vintages corresponded to the most recent releases available at the time of extraction. The catalogue contained feeds for several other cities of the region, including São Paulo and Rio de Janeiro, but those cities are not capitals and therefore fell outside the sampling frame. The screening reflects a single extraction date, and the availability of a feed can change as agencies publish or remove schedules. The single figure that summarises this block is the five capitals that entered the analysis.
Frequent service covered most of the population in four capitals
With respect to the second question, frequent service covered most of the population in four capitals and about one third in La Paz (Table 2; Figure 1; Figure 2).
Capital | Population in study area | Stops (n) | Frequent stops (n) | Covered population | Coverage share (%) |
|---|---|---|---|---|---|
Argentina - Buenos Aires | 2364701 | 44550 | 30811 | 2344741 | 99.2 |
Chile - Santiago | 2334527 | 12877 | 11974 | 2329000 | 99.8 |
Colombia - Bogota | 4361920 | 8309 | 7717 | 4347231 | 99.7 |
Nicaragua - Managua | 1209169 | 2247 | 1406 | 1075391 | 88.9 |
Bolivia - La Paz | 1440168 | 76 | 50 | 494678 | 34.3 |
Note: Study area: 10 km disc around the city central reference point. Frequent stop: average weekday headway (07:00-20:00) of 15 minutes or less.
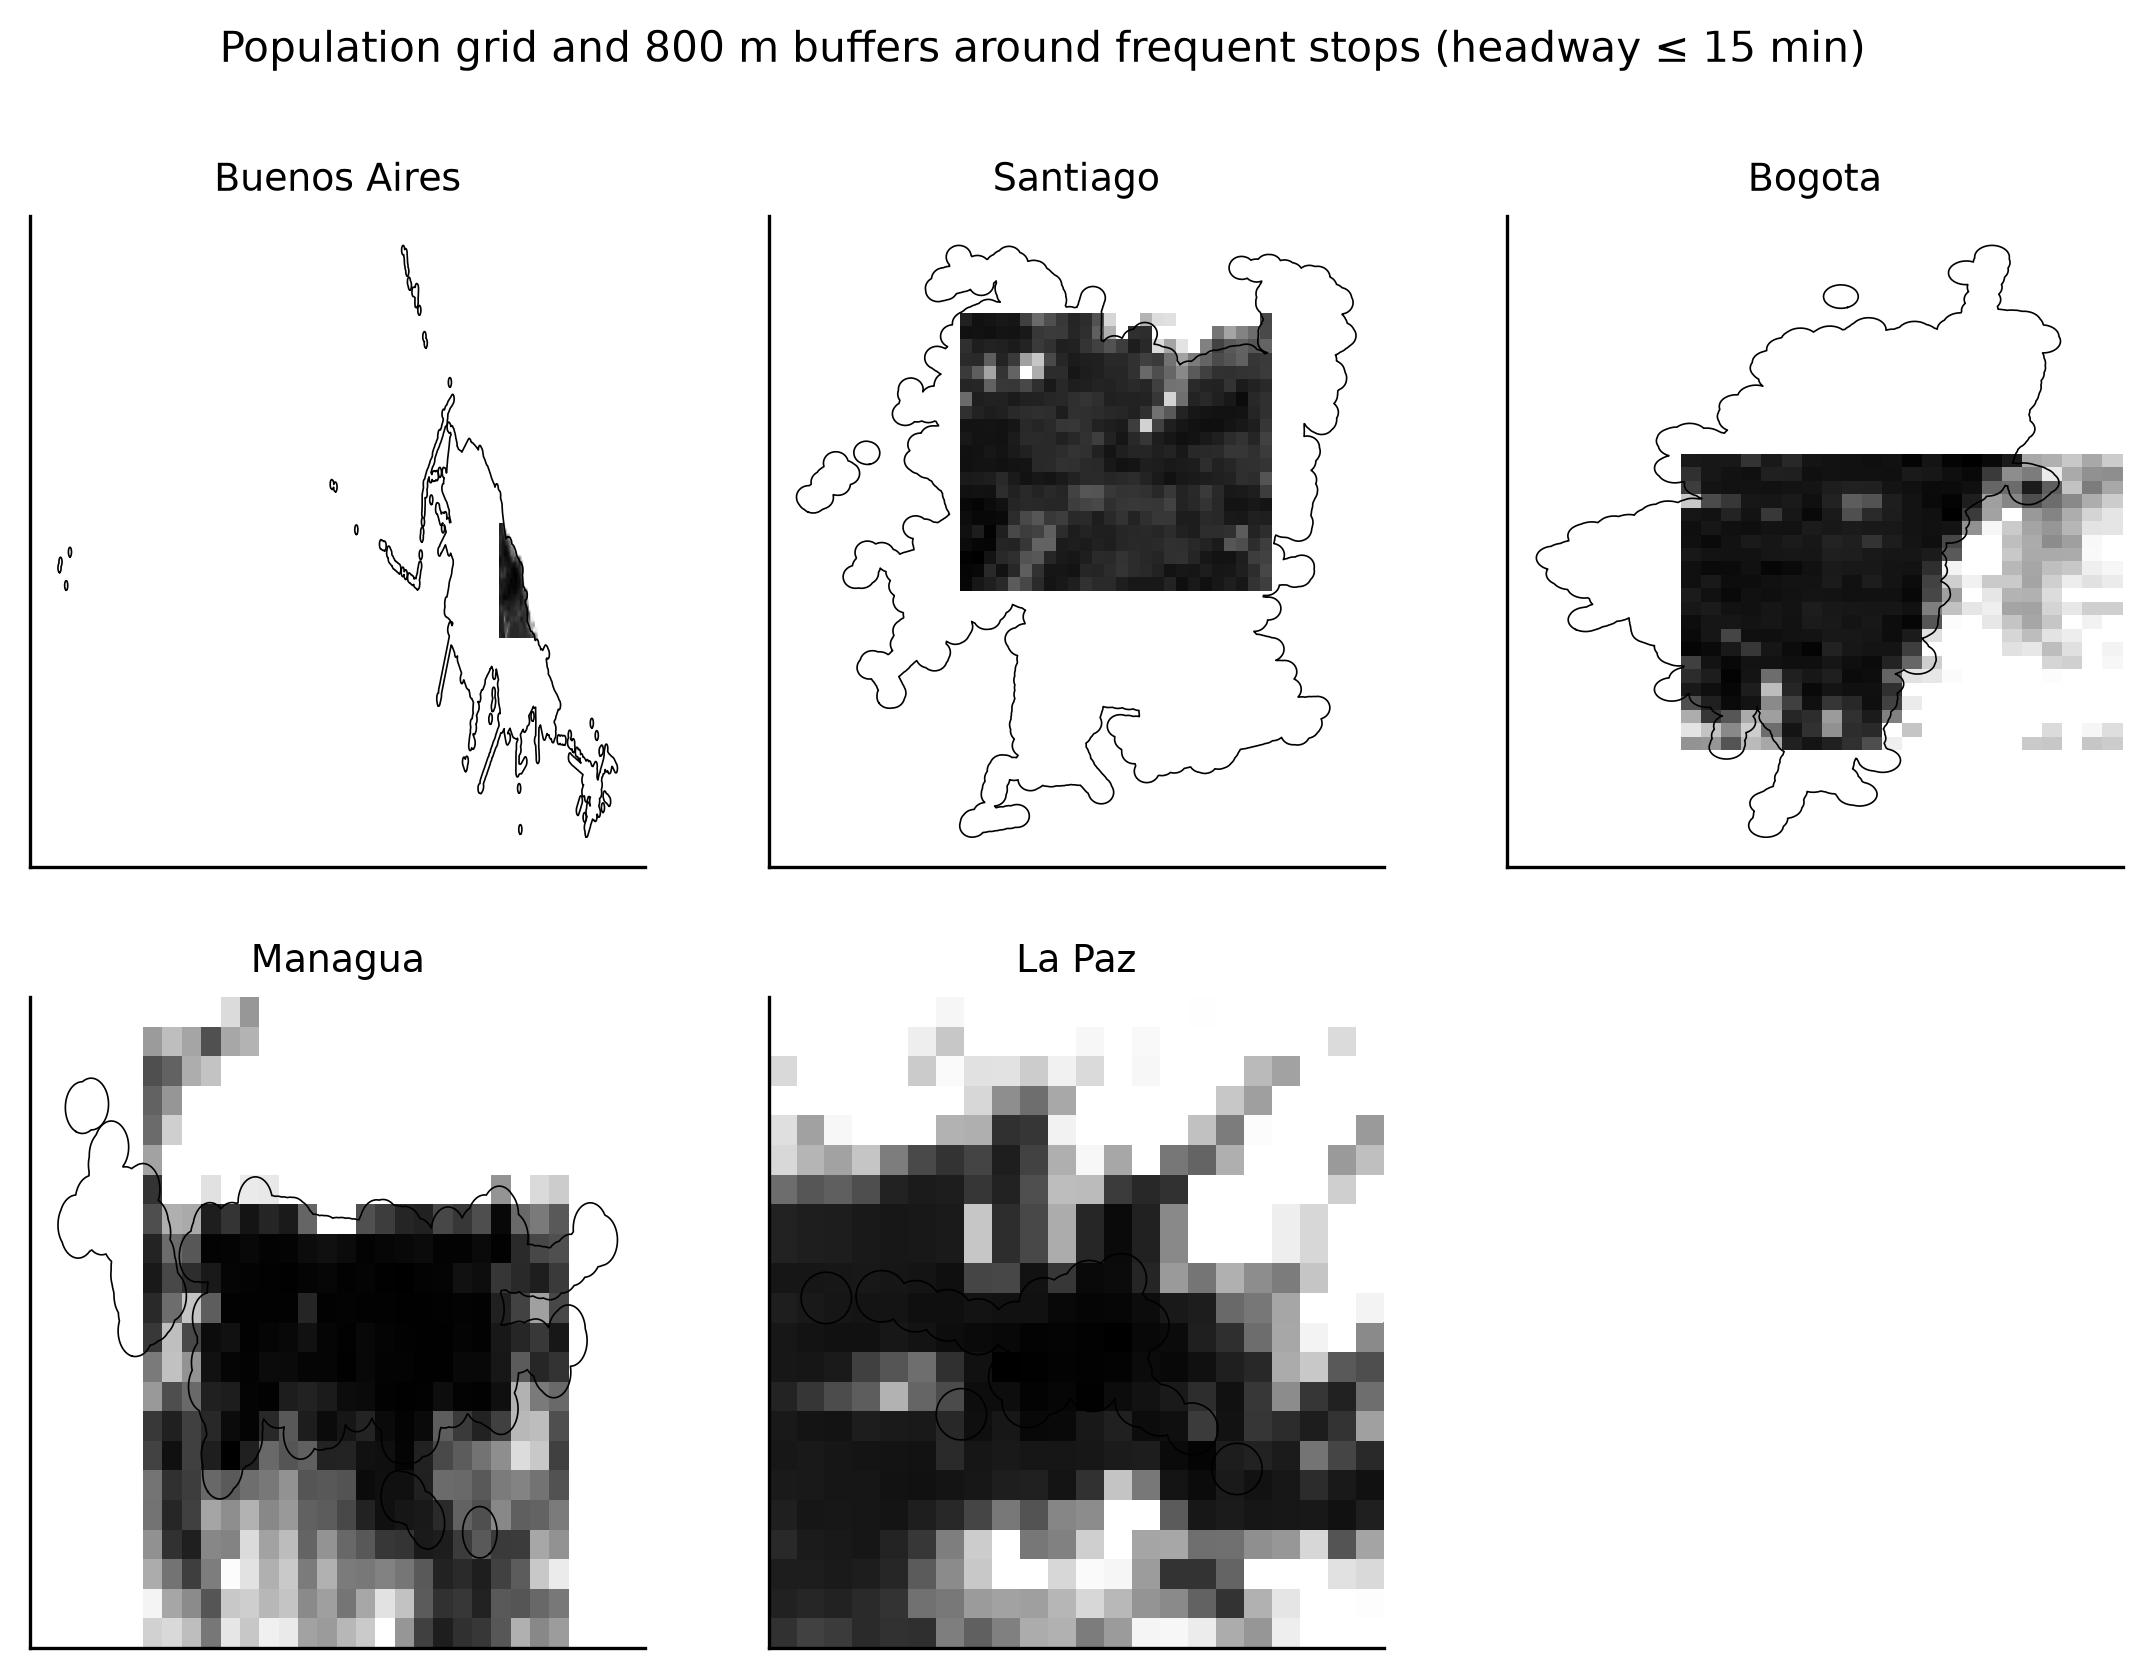
Figure 1. Population grid and 800 m buffers around frequent stops (headway of 15 minutes or less) in the five studied capitals.
Note: Greyscale cells show population; black outlines mark the walking buffers of frequent stops within the 10 km study area.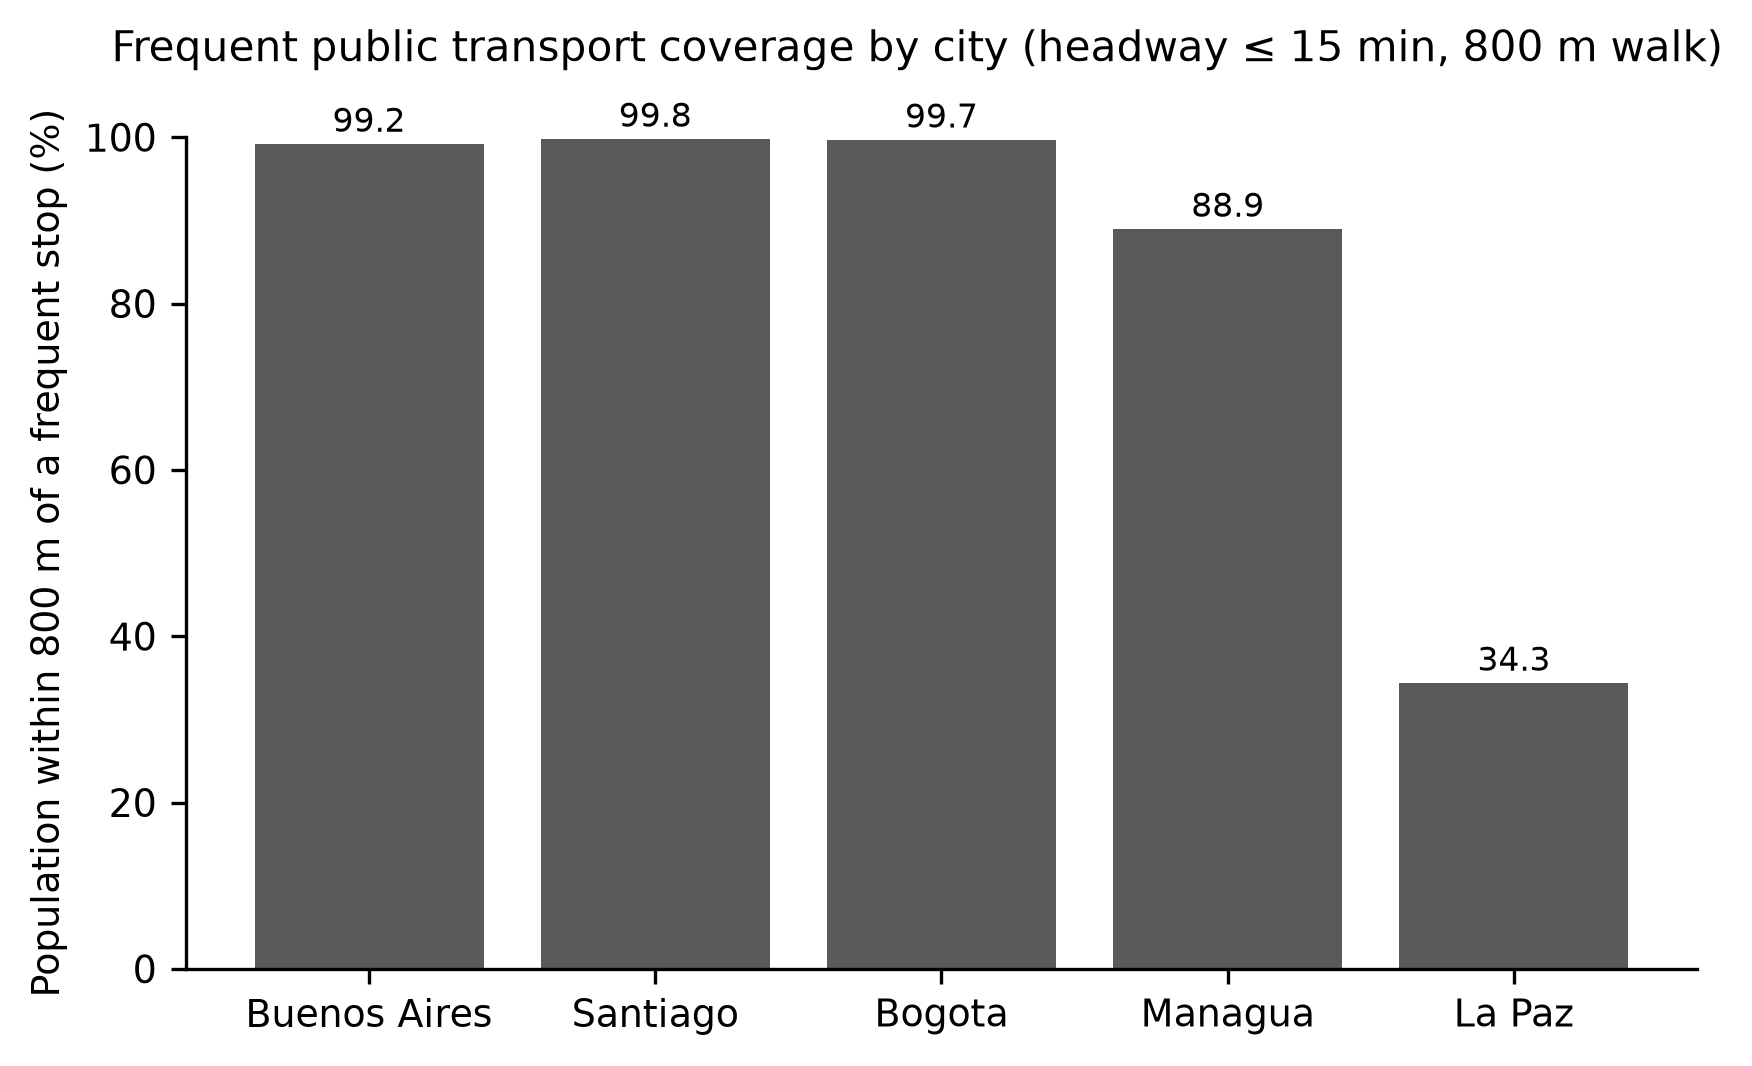
Figure 2. Share of the population within 800 m of a frequent stop by city.
The population-weighted coverage across the five cities was 90.4%. By city, the share was 99.8% in Santiago, 99.7% in Bogotá, 99.2% in Buenos Aires, 88.9% in Managua and 34.3% in La Paz.
The median city coverage was 99.2%, with a range from 34.3% to 99.8%. Buenos Aires combined three feeds (bus, metro and commuter rail), whereas La Paz contributed a single cable car feed, and this difference in network completeness is visible in the number of stops reported in the table. In the three high-coverage capitals the share stayed above 97 percent even under the strictest combination of thresholds, which indicates that the walking buffers of frequent stops overlap extensively in the densest areas. The number of frequent stops ranged from 50 in La Paz to 30,811 in Buenos Aires, and the study-area population ranged from 1,209,169 in Managua to 4,361,920 in Bogotá. The single figure that summarises this block is the population-weighted coverage of 90.4%.
Coverage was robust to stricter thresholds except in Managua and La Paz
As for the third question, the coverage estimates were robust to stricter thresholds in the three largest networks but not in Managua and La Paz (Table 3; Figure 3). Under the 500 m walk and the 10-minute headway, coverage fell to 73.5% in Managua and to 18.7% in La Paz, whereas Buenos Aires, Santiago and Bogotá remained between 97.7% and 97.9%.
Capital | 800 m, 15 min | 800 m, 10 min | 500 m, 15 min | 500 m, 10 min |
|---|---|---|---|---|
Argentina - Buenos Aires | 99.2 | 99.0 | 98.2 | 97.9 |
Chile - Santiago | 99.8 | 99.7 | 98.7 | 98.2 |
Colombia - Bogota | 99.7 | 99.6 | 98.1 | 97.7 |
Nicaragua - Managua | 88.9 | 82.0 | 80.8 | 73.5 |
Bolivia - La Paz | 34.3 | 34.3 | 18.7 | 18.7 |
Note: Columns combine walking distance (w, metres) and frequency threshold (f, minutes).
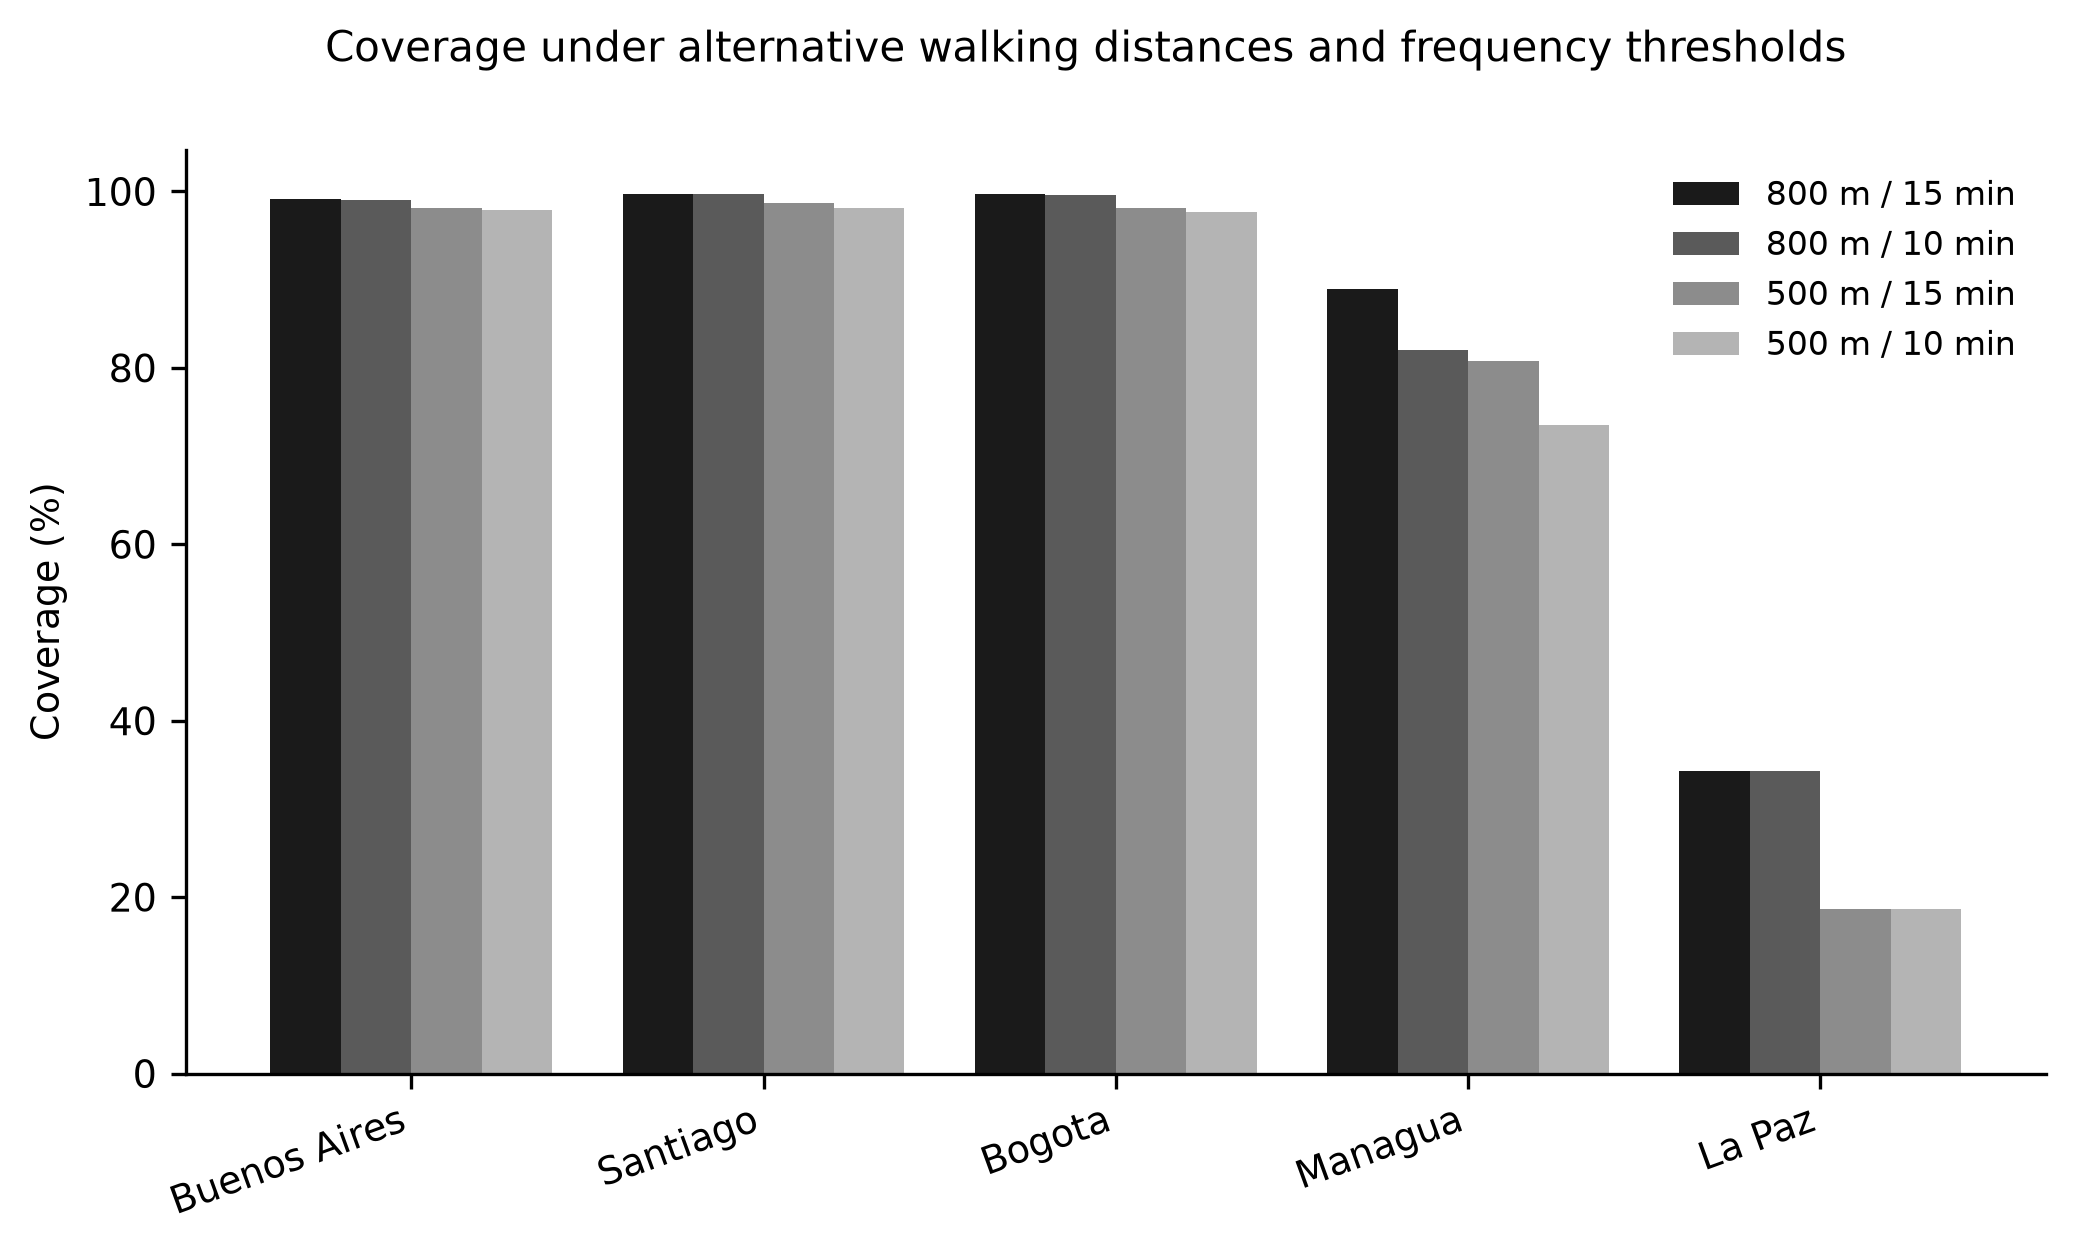
Figure 3. Coverage share under alternative walking distances and frequency thresholds by city.
Note: w = walking distance in metres; f = frequency threshold in minutes.The 10-minute threshold alone reduced Managua to 82.0% but left the other capitals nearly unchanged. The 500 m distance with the 15-minute headway produced an intermediate pattern, with Managua at 80.8% and La Paz at 18.7%. Enlarging the study area to a 15 km radius lowered coverage to 83.2% in Managua and to 25.4% in La Paz, while the three consolidated networks stayed above 98.3%. The summary figure of this block is the 18.7% reached by La Paz under the strictest combination.
DISCUSSION
The present study asked what share of the population of Latin American capital cities lives within walking distance of a frequent public transport stop. The answer has two parts: four of the five capitals that publish an open urban schedule reach near-universal coverage within 800 m of a stop with a 15-minute headway, while La Paz, where the open feed covers only the cable car network, reaches a markedly lower share.
Regarding P1, the finding that only five of twenty capitals offer a downloadable urban GTFS feed is itself informative about the region. Giesen and colleagues described public transport data as a research priority for Latin America and the Caribbean precisely because open schedules remain scarce.( 20)
Hidalgo and colleagues, mapping universal access experiences in the region, documented that the absence of standardised open data is one of the barriers to measuring and improving access.( 31) This pattern matches the wider literature on transport data availability, in which open and proprietary sources coexist unevenly and the Global South lags behind.( 7)
Conversely, the exclusion of Mexico City and San José reflects transient server failures rather than a structural absence of data, and these cities could enter future updates of the same protocol without any change in method. The detection of coverage gaps, which motivated several recent city studies, depends on the same schedules and is therefore impossible where no feed exists.( 22)
As an alternative to schedule files, Haamer and colleagues reconstructed accessibility from GPS vehicle traces, which could mitigate the data gap where feeds are absent.( 32)
The coverage values should be read as a snapshot of the networks as published at the extraction date, and the differing feed vintages mean that the comparison captures the current state of each network rather than a common calendar year. The asymmetry is consequential for equity monitoring, because the cities that are hardest to measure are often those where access is most contested, and the absence of a feed removes them from regional comparisons altogether.
Regarding P2, the near-universal coverage measured in Buenos Aires, Santiago and Bogotá is consistent with evidence that these cities operate dense, high-frequency networks. Boisjoly and colleagues reported that the Brazilian metropolises with formal networks concentrate most of their population within reach of frequent service when such service exists,( 8) and de Almeida Correia and colleagues found that Curitiba's accessibility is high but varies across modes and times of day.( 15)
Verbavatz and Barthelemy, using a global metric of access to mass rapid transit, showed that coverage close to saturation is attainable in cities that combine metros with frequent surface networks.( 33)
Oviedo and colleagues showed that a single bus rapid transit corridor in Lima improved access for the poor, which supports the interpretation that sustained trunk investment explains the high values in Bogotá and Santiago.( 9)
The lower value in Managua is closer to the levels reported by Falchetta and colleagues for paratransit-dominated African cities, where formal scheduled networks cover only part of the built-up area,( 34) and to the partial coverage that Mwesigwa and colleagues described for a bus rapid transit corridor in Dar es Salaam.( 35)
The La Paz result reflects a measurement limitation as much as a service one: the city's bus and minibus network is not published as an open schedule, so the coverage estimate captures only the cable car system, which serves a linear corridor rather than the whole urban area. Heinrichs and Bernet described the same mechanism for Medellín, where aerial cable cars improved access in informal hillside settlements but did not substitute a full urban network,( 36) and Stiller and colleagues showed that semiformal transport provides much of the residual accessibility in that city.( 16)
Comparable city-level GIS assessments in Mexico support the view that coverage varies with network completeness rather than with city size alone.( 14,37) It is worth stressing that coverage measures access to the network, not access to destinations, so a resident within walking distance of a frequent stop may still face long or inconvenient journeys once aboard.( 2)
Regarding P3, the robustness of the estimates under stricter thresholds distinguishes the cities. In Buenos Aires, Santiago and Bogotá the 10-minute and 500 m definitions barely changed coverage, which indicates that the frequent network is dense enough that most residents are served by several nearby frequent lines. Kim and Lee argued that frequency, rather than travel time, is what distinguishes usable service,( 2) and Wang and Loo showed that a highly transit-oriented city can still leave specific groups disadvantaged once fine-grained service frequency is considered.( 38)
The sensitivity of Managua and La Paz to the thresholds is consistent with networks in which frequency is concentrated on fewer corridors, the same pattern that a transit-gap framework revealed in other contexts.( 21,39)
The 15 km sensitivity confirms that this lower coverage is not an artefact of the 10 km boundary, because the frequent network itself does not extend into the wider periphery in those cities. The results also illustrate a practical point for indicator design: a single threshold applied uniformly will classify near-saturated networks as similar even when their service quality differs, so frequency-based coverage is best reported together with the underlying headway distribution.
The walking-distance dimension behaves as expected from the literature: van Soest and colleagues and Taylor and Somenahalli reported that the share of users declines steeply beyond roughly 500 to 800 m,( 3,4) which explains why the 500 m buffer, and not the frequency threshold, produced the largest drop in La Paz. Accessibility inequality measured at fine resolution also concentrates at such pedestrian thresholds, and the indicator is therefore sensitive to how coverage is defined.( 25,40,41)
The regional evidence on equity reinforces this interpretation. Hernandez showed that the social distribution of accessibility in Montevideo is uneven across income groups,( 10) and Slovic and colleagues linked accessibility shortfalls to overlapping inequalities in São Paulo.( 12)
Ribeiro and colleagues proposed accessibility as an indicator of social exclusion precisely because coverage gaps concentrate in the same neighbourhoods where other disadvantages accumulate.(41) Liu and colleagues, working with high-resolution transit data, showed that the same gaps affect people with mobility disabilities more sharply.( 40)
The coverage metric computed here is therefore a first screen rather than a substitute for distributional analysis within each city, and it identifies the cities where such analysis is most urgent.
Several methodological strengths support the internal validity of the findings. The input data are fully public, the computation is deterministic and reproducible, and the coverage metric is a complete enumeration of the population grid rather than an approximation. The use of a single population layer and a single frequency definition across cities removes two common sources of incomparability that earlier comparative work identified as consequential.( 17,18)
The sensitivity analyses make the role of each threshold explicit, which addresses the criticism that accessibility rankings change when the indicator is changed. These properties matter because coverage indicators for transport are increasingly used in monitoring and planning, and a metric whose assumptions are hidden cannot be audited. Because the study relies on schedule files and a population grid that are both released under open licences, the results can be recomputed and challenged by third parties, which is a precondition for trust in the indicator.
Several limitations point to concrete extensions. The sample is restricted to capitals with an open urban GTFS feed, so the results cannot be extrapolated to the fifteen excluded capitals, several of which are large, and the uneven data availability documented by Mahajan and colleagues suggests that this restriction will relax slowly unless open data are mandated.( 7)
The circular study area is a standardised analytical zone and not an administrative boundary, so it may include peripheral areas outside municipal limits or exclude parts of the metropolitan region. The population grid resolves about one kilometre, which is coarse relative to the 500 and 800 m buffers, although the area-weighted intersection mitigates this mismatch, and the choice between centroid and area weighting is itself a known source of variation in walking-access estimates.( 24,28)
The La Paz estimate covers only the cable car network and therefore understates the true coverage of that city. The population layer refers to 2020 while the schedules are recent, and the schedules describe planned rather than observed service, so actual reliability and crowding are not captured. Each of these limitations points to a concrete extension: integrating semiformal transport, using finer grids or building footprints, and validating scheduled headways against real-time vehicle positions.
These results also speak to comparability beyond the region. The coverage shares measured here sit within the range reported for formal networks in OECD cities( 33) and above the levels typical of paratransit-dominated African cities,( 34) which suggests that the frequent-network coverage metric behaves consistently across contexts when the same open-data pipeline is applied.
Because the pipeline uses only open schedules and an open population grid, it can be extended to any city that publishes a feed, and the main barrier to extension is the availability of schedules rather than the cost of computation. The extension would also allow within-region rankings to be updated as new feeds appear, which is a practical benefit for agencies and researchers alike.
The implications for policy are direct. Cities that already publish open schedules can be monitored continuously, and the five included capitals show that the population within reach of frequent service is now a computable indicator rather than an assumption, which aligns with the research priorities set for the region.( 20)
The comparison also exposes the asymmetric burden of data: residents of capitals without an open feed remain invisible to this kind of measurement, which is itself an argument for open data mandates. What remains open is whether the excluded capitals, once their schedules are published, will show coverage closer to the consolidated networks of Santiago and Bogotá or to the partial networks of Managua and La Paz, and whether the semiformal services that carry much of the region's demand can be brought into the same measurement frame.( 16,34)
CONCLUSIONS
Open urban GTFS schedules were identified and analysed for five of the twenty Latin American capital cities screened. Frequent service within 800 m covered the great majority of the combined population, with near-universal values in Santiago, Bogotá and Buenos Aires and lower values in Managua and La Paz. Coverage was robust to stricter thresholds in the consolidated networks but fell in Managua and La Paz, where the published network is smaller or only partial.
References
- 1 El-Geneidy A, Grimsrud M, Wasfi R, Tétreault P, Surprenant-Legault J. New evidence on walking distances to transit stops: identifying redundancies and gaps using variable service areas. Transportation. 2014;41(1):193-210. doi: 10.1007/s11116-013-9508-z
- 2 Kim J, Lee B. More than travel time: New accessibility index capturing the connectivity of transit services. Journal of Transport Geography. 2019;78:8-18. doi: 10.1016/j.jtrangeo.2019.05.008
- 3 van Soest D, Tight MR, Rogers CDF. Exploring the distances people walk to access public transport. Transport Reviews. 2020;40(2):160-182. doi: 10.1080/01441647.2019.1575491
- 4 Taylor MAP, Somenahalli S. Distributions of walking access to public transport in Melbourne, Australia – Evidence on acceptable and tolerable walking distances. International Journal of Sustainable Transportation. 2024;18(7):576-588. doi: 10.1080/15568318.2024.2385641
- 5 Dabagh S, Miristice LMB, Gentile G. Accessibility Via Public Transport Through Gravity Models Based on Open Data. Transport and Telecommunication Journal. 2024;25(4):359-369. doi: 10.2478/ttj-2024-0026
- 6 MobilityData / Google. GTFS Static Overview - General Transit Feed Specification [Internet]. 2025. Available from: https://gtfs.org/documentation/schedule/reference/
- 7 Mahajan V, Kuehnel N, Intzevidou A, Cantelmo G, Moeckel R, Antoniou C. Data to the people: a review of public and proprietary data for transport models. Transport Reviews. 2022;42(4):415-440. doi: 10.1080/01441647.2021.1977414
- 8 Boisjoly G, Serra B, Oliveira GT, El-Geneidy A. Accessibility measurements in São Paulo, Rio de Janeiro, Curitiba and Recife, Brazil. Journal of Transport Geography. 2020;82:102551. doi: 10.1016/j.jtrangeo.2019.102551
- 9 Oviedo D, Scholl L, Innao M, Pedraza L. Do Bus Rapid Transit Systems Improve Accessibility to Job Opportunities for the Poor? The Case of Lima, Peru. Sustainability. 2019;11(10):2795. doi: 10.3390/su11102795
- 10 Hernandez D. Uneven mobilities, uneven opportunities: Social distribution of public transport accessibility to jobs and education in Montevideo. Journal of Transport Geography. 2018;67:119-125. doi: 10.1016/j.jtrangeo.2017.08.017
- 11 Hernandez D, Hansz M, Massobrio R. Job accessibility through public transport and unemployment in Latin America: The case of Montevideo (Uruguay). Journal of Transport Geography. 2020;85:102742. doi: 10.1016/j.jtrangeo.2020.102742
- 12 Slovic AD, Tomasiello DB, Giannotti M, Andrade MDF, Nardocci AC. The long road to achieving equity: Job accessibility restrictions and overlapping inequalities in the city of São Paulo. Journal of Transport Geography. 2019;78:181-193. doi: 10.1016/j.jtrangeo.2019.06.003
- 13 Moreno-Monroy AI, Lovelace R, Ramos FR. Public transport and school location impacts on educational inequalities: Insights from São Paulo. Journal of Transport Geography. 2018;67:110-118. doi: 10.1016/j.jtrangeo.2017.08.012
- 14 Zazueta-Terrazas AG, Plata-Rocha W, Monjardín-Armenta SA, Íñiguez-Ayón YP, Rivas-Báez VM. Sustainable development goals (SDGs): spatial impact of public transport stops on the population of Culiacan, Sinaloa, Mexico. GeoJournal. 2025;90(6):304. doi: 10.1007/s10708-025-11547-7
- 15 de Almeida Correia P, Carpio-Pinedo J, Moya-Gómez B, Condeço-Mehorado A. Modal Accessibility Gap in Curitiba (Brazil). Dynamic Analysis Considering Time and Spatial Variations. Appl Spatial Analysis. 2025;18(1):34. doi: 10.1007/s12061-025-09639-5
- 16 Stiller D, Wurm M, Sapena M, Nieland S, Dech S, Taubenböck H. Does formal public transport serve the city well? The importance of semiformal transport for the accessibility in Medellín, Colombia. PLoS ONE. 2025;20(4):e0321691. doi: 10.1371/journal.pone.0321691
- 17 Luo D, Cats O, van Lint H, Currie G. Integrating network science and public transport accessibility analysis for comparative assessment. Journal of Transport Geography. 2019;80:102505. doi: 10.1016/j.jtrangeo.2019.102505
- 18 Klar B, Lee J, Long JA, Diab E. The impacts of accessibility measure choice on public transit project evaluation: A comparative study of cumulative, gravity-based, and hybrid approaches. Journal of Transport Geography. 2023;106:103508. doi: 10.1016/j.jtrangeo.2022.103508
- 19 Li Y, Fan W“. Modeling and Evaluating Public Transit Equity and Accessibility by Integrating General Transit Feed Specification Data: Case Study of the City of Charlotte. J Transp Eng, Part A: Systems. 2020;146(10):04020112. doi: 10.1061/jtepbs.0000426
- 20 Giesen R, Hidalgo D, Ramos R. Public transport: Status and research priorities for Latin America and the Caribbean. Latin American Transport Studies. 2025;3:100025. doi: 10.1016/j.latran.2025.100025
- 21 Yadav M, Mepparambath RM, Patil GR. An enhanced transit accessibility evaluation framework by integrating Public Transport Accessibility Levels (PTAL) and transit gap. Journal of Transport Geography. 2024;121:104013. doi: 10.1016/j.jtrangeo.2024.104013
- 22 Tiwari A. Detecting Transit Deserts Through a Blend of Machine Learning (ML) Approaches, Including Decision Trees (DTs), Logistic Regression (LR), and Random Forest (RF) in Lucknow. Future Transportation. 2025;5(2):70. doi: 10.3390/futuretransp5020070
- 23 MobilityData. Mobility Database catalogs [Internet]. 2025. Available from: https://github.com/MobilityData/mobility-database-catalogs
- 24 Schiavina M, Freire S, MacManus K, European Commission Joint Research Centre. GHS-POP R2023A - GHS population grid multitemporal (1975-2030) [Internet]. 2023. Available from: https://ghsl.jrc.ec.europa.eu/
- 25 Liu D, Kan Z, Wang J, Kwan MP, Song J, Wei J. Using spatially explicit high-granularity 3D geospatial data for quantifying public transport walking accessibility inequality and vulnerability in the x-minute city. Cities. 2025;166:106245. doi: 10.1016/j.cities.2025.106245
- 26 Hasan MM, Islam GMT, Matsumoto PSS, Novak M, Rahaman KR. Employing Geographic Information Systems in Analyzing Pedestrian Accessibility to Public Bus Stops in Halifax. J Urban Plann Dev. 2023;149(3):04023016. doi: 10.1061/jupddm.upeng-4268
- 27 Taplin JH, Sun Y. Optimizing bus stop locations for walking access: Stops-first design of a feeder route to enhance a residential plan. Environment and Planning B: Urban Analytics and City Science. 2020;47(7):1237-1259. doi: 10.1177/2399808318824108
- 28 Grisé E, Wasfi R, Ross NA, El-Geneidy A. Evaluating methods for measuring daily walking to public transport: Balancing accuracy and data availability. Journal of Transport & Health. 2019;15:100638. doi: 10.1016/j.jth.2019.100638
- 29 Naro G, Biraghi CA, Lenzi E. City Transport Analyzer: A Powerful Qgis Plugin For Public Transport Accessibility And Intermodality Analysis. Int Arch Photogramm Remote Sens Spatial Inf Sci. 2024;XLVIII-4/W12-2024(4/W12-2024):113-119. doi: 10.5194/isprs-archives-xlviii-4-w12-2024-113-2024
- 30 Goliszek S. Spatio‐Temporal Accessibility Modeling With Mobile Phone and GTFS Data: Insights for Urban Transport Planning in Helsinki. Transactions in GIS. 2025;29(8):e70163. doi: 10.1111/tgis.70163
- 31 Hidalgo D, Urbano C, Olivares C, Tinjacá N, Pérez JM, Pardo CF, et al. Mapping Universal Access Experiences for Public Transport in Latin America. Transportation Research Record: Journal of the Transportation Research Board. 2020;2674(12):79-90. doi: 10.1177/0361198120949536
- 32 Haamer M, Aasa A, Poom A. Assessing public transport accessibility using GPS data. Eur Transp Res Rev. 2025;17(1):36. doi: 10.1186/s12544-025-00733-w
- 33 Verbavatz V, Barthelemy M. Access to mass rapid transit in OECD urban areas. Sci Data. 2020;7(1):301. doi: 10.1038/s41597-020-00639-3
- 34 Falchetta G, Noussan M, Hammad AT. Comparing paratransit in seven major African cities: An accessibility and network analysis. Journal of Transport Geography. 2021;94:103131. doi: 10.1016/j.jtrangeo.2021.103131
- 35 Mwesigwa L, Yin Z, Farber S. Evaluating the level of access and equity of the bus rapid transit (BRT) system: The case of Dar-Es-Salaam, Tanzania. Journal of Transport Geography. 2024;119:103953. doi: 10.1016/j.jtrangeo.2024.103953
- 36 Heinrichs D, Bernet JS. Public Transport and Accessibility in Informal Settlements: Aerial Cable Cars in Medellín, Colombia. Transportation Research Procedia. 2014;4:55-67. doi: 10.1016/j.trpro.2014.11.005
- 37 Calderón-Ramírez J, Gutiérrez-Moreno M, Mungaray-Moctezuma A, Sánchez-Atondo A, García-Gómez L, Montoya-Alcaraz M, et al. Spatial Analysis of Public Transport and Urban Mobility in Mexicali, B.C., Mexico: Towards Sustainable Solutions in Developing Cities. Sustainability. 2025;17(17):7802. doi: 10.3390/su17177802
- 38 Wang H, Loo BPY. The public transport disadvantaged in a highly transit-oriented city: An analytical framework, key challenges and opportunities. Journal of Transport Geography. 2024;120:103983. doi: 10.1016/j.jtrangeo.2024.103983
- 39 Li Y, “David” Fan W. Optimizing Transit Equity and Accessibility of the City of Charlotte, North Carolina, by Integrating Transit Gap Index, a General Transit Feed Specification Data-Relevant Performance Metric. J Transp Eng, Part A: Systems. 2021;147(4):04021005. doi: 10.1061/jtepbs.0000503
- 40 Liu L, Kar A, Tokey AI, Le HTK, Miller HJ. Disparities in public transit accessibility and usage by people with mobility disabilities: An evaluation using high-resolution transit data. Journal of Transport Geography. 2023;109:103589. doi: 10.1016/j.jtrangeo.2023.103589
- 41 Ribeiro J, Fontes T, Soares C, Borges JL. Accessibility as an indicator to estimate social exclusion in public transport. Transportation Research Procedia. 2021;52:740-747. doi: 10.1016/j.trpro.2021.01.019
Declarations
Funding
No financing
Conflict of interest
None
Authorship contributions
Drafting – original draft: Ronald Yesid Palencia Buelvas.
Writing–review and editing: Ronald Yesid Palencia Buelvas.