

Abstract
Introduction: Pedalcyclist fatalities in the United States have risen since the early 2010s, yet how this growth distributes across urban and rural settings, age groups and roadway classes has not been quantified jointly. Methods: This retrospective census analysis used the Fatality Analysis Reporting System annual files from 2013 through 2023. Pedalcyclist fatalities were defined as bicyclists or other pedalcyclists with a fatal injury. Annual counts were modeled with Poisson regression and the 2013 and 2023 distributions were compared with chi-square tests. Results: Between 2013 and 2023, 9,910 pedalcyclists died. Fatalities increased 4.5% per year (95% CI 3.9% to 5.2%), from 749 in 2013 to 1,173 in 2023. Urban fatalities rose 88.4% while rural fatalities declined 10.3%, and the urban share grew from 67.7% to 81.4%. Fatalities among cyclists aged 65 years or older increased 120.6%, and their share rose from 13.6% to 19.2%. Conclusions: The growth of cyclist fatalities concentrated in urban settings, in older adults and on arterial roadways, which directs prevention toward urban arterial corridors and older cyclists.
Keywords
bicycling, mortality, traffic accidents, urban population, rural population, age distribution
INTRODUCTION
Cycling delivers measurable benefits for physical health, air quality and household transport costs, and cities across the United States have expanded bicycle infrastructure and promotion for more than a decade.( 1)
Yet cycling exposes riders to a fatality risk far above that of motor vehicle occupants, because the human body is unprotected and the roads on which people cycle were designed around motor traffic, with speeds and crossing distances calibrated to vehicles rather than to vulnerable users.( 2)
The safety deficit is not a fixed property of cycling; it varies sharply with where the trip occurs and who is riding, which makes it a target for transport policy rather than an unavoidable cost of an active mode.( 3) The policy question is therefore not whether to encourage cycling, but how to build the network so that growth in trips does not translate into growth in deaths.( 1)
The recent trajectory of that deficit is unfavorable. Pedalcyclist deaths in the United States climbed from the early 2010s and, by 2023, reached the highest annual count recorded in more than four decades, reversing the long decline of the previous decades.( 4,5)
More than one thousand pedalcyclists died in each of the final years of the series, a toll that rose in parallel with total road deaths and that now commands the attention of federal, state and municipal safety programs.( 4)
The increase is not spread evenly across the population or the network: crash severity depends on traffic speed, roadway design and the built environment, all of which differ between urban and rural settings, and older cyclists consistently show the most adverse outcomes.( 6,7)
Exposure-adjusted fatality rates, the design of cycling networks and the changing mix of bicycles and e-bikes have each been proposed to explain the rise, yet most studies examine one dimension at a time.( 5,8)
What remains unquantified is how the growth of cyclist deaths has distributed jointly across urban and rural settings, age groups and roadway classes over the past decade. Each of those three axes is also a distinct policy lever: land use and network design for place, age-sensitive safety for people, and speed and separation for roads. The aim of this study was to quantify how pedalcyclist fatalities in the United States changed between 2013 and 2023 across urban or rural setting, age group and roadway functional class.
The analysis used the Fatality Analysis Reporting System, the national census of fatal motor vehicle crashes, and treated the period 2013 through 2023 as repeated annual cross-sections of all pedalcyclist deaths.( 9)
The three dimensions were analyzed in parallel so that prevention can be directed at the combinations of place, person and road that carry the largest burden, rather than at a single axis in isolation. The results therefore speak directly to the design of cycling networks, the management of speed and the protection of the growing share of older riders. No hypothesis was prespecified; the study is descriptive in intent and aims to map the burden precisely enough to target it.
METHODS
Design and data source
This retrospective census analysis examined all pedalcyclist fatalities recorded in the United States from 2013 through 2023. The design is an ecological time series of repeated annual cross-sections, reported following the STROBE statement for observational studies and its RECORD extension for routinely collected data. The source was the Fatality Analysis Reporting System (FARS) of the National Highway Traffic Safety Administration, which records every motor vehicle traffic crash on a public road that results in at least one death within 30 days of the crash.( 9)
The system is a census rather than a sample, maintained from police crash reports and death certificates across all states, the District of Columbia and Puerto Rico. Because it is a census, the counts are not subject to sampling error, and the analytic task is to describe and compare distributions rather than to generalize from a drawn sample. The person file was preferred over the crash file because it carries the person type, injury severity, age and sex of each victim together with the location and roadway variables needed for the three axes of this study.
The study period was chosen to span the full inflection of the national count, beginning at the low point of the early 2010s and ending at the record-setting year 2023, so the endpoints capture the entire reversal.( 4)
Data processing and harmonization
The person file schema changed during the period, and this was handled explicitly rather than assumed away. For 2013 and 2014 the urban or rural setting and the roadway functional class were derived from the two-digit roadway function code, in which codes 1 to 9 are rural and codes 11 to 19 are urban, and the second digit carries the functional class.
From 2015 onward the file carried an explicit rural-urban indicator and a separate functional class field. Both schemas were mapped to a single urban-rural indicator and to a common seven-category roadway classification so that the eleven years could be compared on equal terms.
The mapping of roadway classes was defined to be stable across both schemas. Interstate codes in rural and urban areas were combined into one interstate category. Freeway and expressway codes other than interstates formed the second category. Principal arterial and minor arterial classes kept their separate categories, major and minor collectors were combined into a single collector class, and local roads formed the last known class.
Codes for trafficways not in a state inventory, not reported and unknown were grouped into a single unknown category. Major and minor collectors were merged because the older schema distinguished them only in rural areas, and a merged class keeps the eleven years comparable without discarding any record. The same rule was applied mechanically to every year, so no classification decision depended on the outcome being measured.
Before tabulation, the extracts were checked for internal consistency: duplicate crash person identifiers, out-of-range injury codes and impossible ages were screened, and none were found beyond the documented unknown codes. The mapping was verified against the agency's own summary counts, and the annual totals reproduced the published national series to within the small release difference noted above.( 4)
Statistical analysis
Annual fatality counts were modeled with Poisson regression, with calendar year entered as a continuous linear predictor centered at 2013. The Poisson model was chosen because the outcome is a non-negative count of rare events, and its log link yields a per-year rate ratio directly.
Results are reported as incidence rate ratios per year with 95% confidence intervals, and the fitted percentage change over the whole period was derived from the estimated rate ratio raised to the tenth power. The model was fitted separately for the total and for the urban and rural series, so that each setting received its own trend estimate rather than a single slope forced across all locations.
Differences in the distribution of fatalities between 2013 and 2023 were tested with Pearson chi-square tests, using the five age groups and the six known roadway classes. The chi-square test was chosen because the comparison of interest is whether the relative composition of the two end years shifted, which is a question of distribution rather than of trend. A two-sided significance level of 0.05 was used throughout, and all confidence intervals are two-sided. Because the data are a census of fatal crashes rather than a sample, the statistical tests describe the strength of the distributional shift between the two end years and should not be read as inference to a larger population.
As a sensitivity check, the trend models were also estimated with negative binomial regression, and the point estimates were materially unchanged, so only the Poisson results are reported. Trend estimates are presented on the multiplicative scale because a constant percentage change per year, rather than a constant additive change, is the natural way to describe growth in a count series.
Two sensitivity checks tested the stability of the harmonization decisions. Reclassifying the 22 records with an unknown setting as urban changed the overall urban share by 0.2 percentage points and did not alter any trend estimate. Excluding the 122 records with unreported age from the totals, rather than from the age denominators only, left the age distribution and the chi-square result unchanged. Neither sensitivity analysis modified the conclusions, so the main analysis is reported as specified.
Variables and case definition
A pedalcyclist fatality was defined as a person recorded as a bicyclist (person type 6) or other pedalcyclist (person type 7) with a fatal injury (injury severity 4). This definition follows the agency's standard classification of pedalcyclists and counts only persons whose injury was coded as fatal, excluding those who died before the crash.
Age was grouped into five categories: younger than 18, 18 to 34, 35 to 54, 55 to 64, and 65 years or older. These categories separate children, younger adults, middle-aged adults, late middle age and older adults, the last being the group in which cycling injury severity rises most steeply. The boundaries follow the age bands used in routine traffic safety tabulations, which eases comparison with published national figures.( 4) The 122 records with unreported age were excluded only from the age-specific denominators, and the median age was computed on the remaining valid values.
The urban-rural indicator classified each fatality as rural, urban or unknown. The 22 records with an unknown setting were retained in the totals but excluded from the urban-rural comparisons and from the urban and rural trend models. Roadway functional class was grouped into interstate, other freeways and expressways, principal arterial, minor arterial, collector, and local roads, with an additional category for unknown or unreported class. These classes rank the road network by its function, from the highest-speed through-roads down to local streets, which is the hierarchy most relevant to where fatal conflicts between motor traffic and cyclists arise. Sex was recorded as male, female or not reported.
RESULTS
The annual number of pedalcyclist fatalities increased by an average of 4.5% per year between 2013 and 2023 (95% CI 3.9% to 5.2%; p <0.001) (Table 1; Figure 1). The total rose from 749 deaths in 2013 to 1,173 in 2023, a 56.6% increase. The lowest annual count was 729 in 2014 and the highest was 1,173 in 2023. The series climbed in every year from 2018 onward, and the jump between 2021 and 2022 was the largest single-year increase of the period. The count in 2020, the first pandemic year, already exceeded every year before 2018.
The increase was almost entirely urban (Table 1). Urban fatalities rose from 507 in 2013 to 955 in 2023, a 88.4% increase at 6.7% per year (95% CI 5.9% to 7.4%; p <0.001). Rural fatalities declined 10.3%, from 242 to 217. The urban share of all pedalcyclist fatalities stood at 81.4% in 2023, up from 67.7% in 2013, while the rural share fell from 32.3% to 18.5%.
The fitted change over the full period was 90.6% for urban fatalities and a decline of 23.8% for rural fatalities. The urban series reached its highest level of the period in 2023, while the rural series remained below its 2013 value in every subsequent year.
The age distribution shifted toward older adults (Table 2). Fatalities among cyclists aged 65 years or older increased 120.6% between 2013 and 2023, from 102 to 225, and their share rose from 13.6% to 19.2%. Fatalities also increased in cyclists aged 35 to 54 years (65.8%), 55 to 64 years (61.3%) and 18 to 34 years (22.4%), while those in cyclists younger than 18 years were 78 in 2023, down from 84 in 2013. The age distribution differed between the two years (<0.001). The 35 to 54 age group was the largest overall, with 3,141 deaths, followed by the 55 to 64 group with 2,276 deaths.
Deaths on arterial and collector roadways grew the most (Table 3). Fatalities on principal arterials, the largest category, rose 71.5% from 246 in 2013 to 422 in 2023. Minor arterials increased 116.4% and collectors 108.6%, whereas local roads fell from 214 to 139. Interstate fatalities, although few, rose from 10 to 27. The roadway distribution differed between the two years (<0.001). Other freeways and expressways accounted for 17 deaths in 2023, close to the interstate count.
Across the study period 9,910 pedalcyclists died (Table 1). Males represented 86.4% of fatalities and females 13.0%. The median age was 50 years in 2023 compared with 49 years in 2013. Principal arterials accounted for 36.6% of all fatalities, minor arterials 25.9% and local roads 16.3%.
Year | Total (n) | Rural (n) | Urban (n) | Urban share (%) |
|---|---|---|---|---|
2013 | 749 | 242 | 507 | 67.7 |
2014 | 729 | 214 | 515 | 70.6 |
2015 | 829 | 234 | 591 | 71.3 |
2016 | 853 | 220 | 632 | 74.1 |
2017 | 806 | 191 | 614 | 76.2 |
2018 | 871 | 172 | 693 | 79.6 |
2019 | 859 | 174 | 685 | 79.7 |
2020 | 948 | 185 | 759 | 80.1 |
2021 | 976 | 141 | 832 | 85.2 |
2022 | 1117 | 189 | 926 | 82.9 |
2023 | 1173 | 217 | 955 | 81.4 |
Total 2013-2023 | 9910 | 2179 | 7709 | 77.8 |
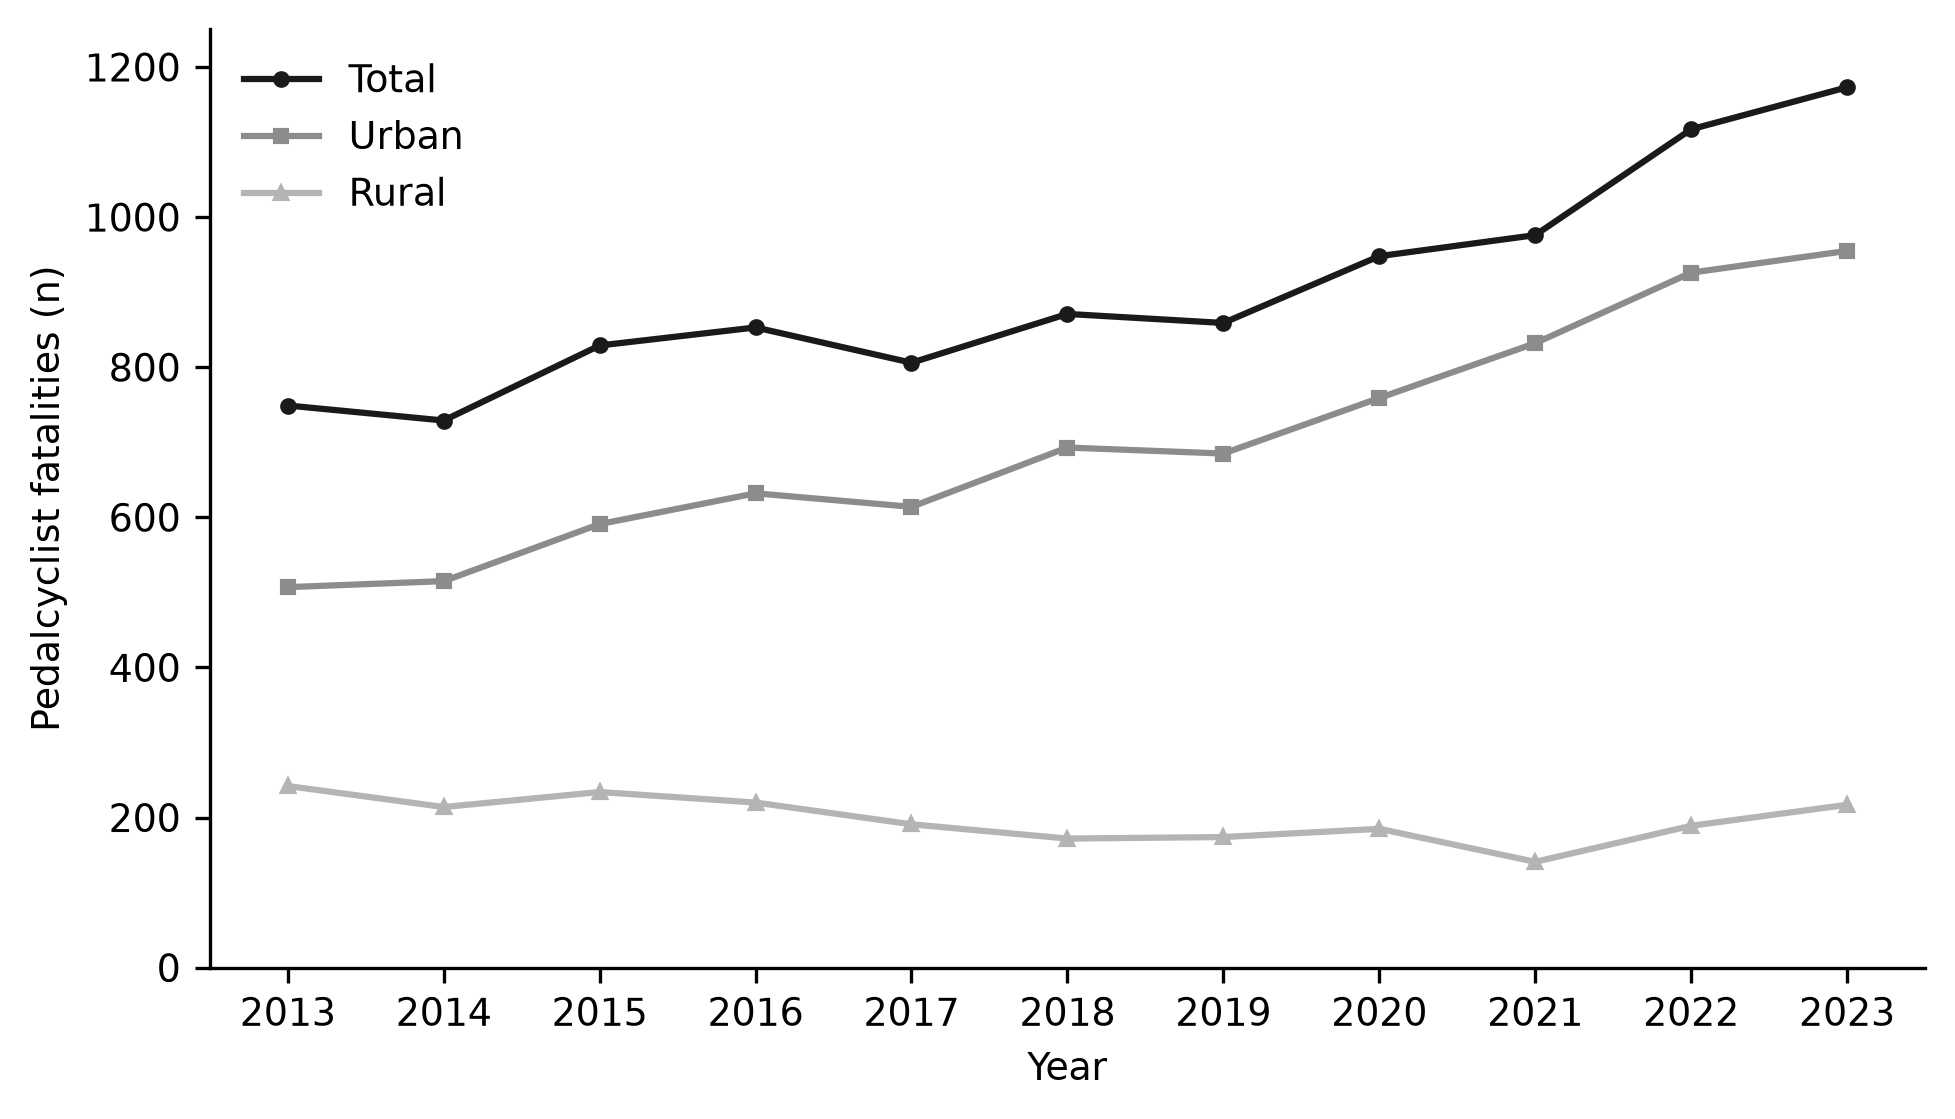
Figure 1. Pedalcyclist fatalities in the United States by year and urban-rural setting, 2013-2023.
Age group | 2013 (n) | 2023 (n) | Change (%) | Overall (n) | Overall (%) |
|---|---|---|---|---|---|
<18 | 84 | 78 | -7.1 | 858 | 8.7 |
18-34 | 152 | 186 | 22.4 | 1807 | 18.2 |
35-54 | 243 | 403 | 65.8 | 3141 | 31.7 |
55-64 | 163 | 263 | 61.3 | 2276 | 23.0 |
>=65 | 102 | 225 | 120.6 | 1706 | 17.2 |
Roadway class | 2013 (n) | 2023 (n) | Change (%) | Overall (n) | Overall (%) |
|---|---|---|---|---|---|
Interstate | 10 | 27 | 170.0 | 158 | 1.6 |
Other freeways and expressways | 14 | 17 | 21.4 | 160 | 1.6 |
Principal arterial | 246 | 422 | 71.5 | 3626 | 36.6 |
Minor arterial | 159 | 344 | 116.4 | 2564 | 25.9 |
Collector | 105 | 219 | 108.6 | 1747 | 17.6 |
Local | 214 | 139 | -35.0 | 1611 | 16.3 |
Unknown | 1 | 5 | 400.0 | 44 | 0.4 |
DISCUSSION
The concentration of rising cyclist deaths in urban settings, on arterial roadways and among older adults carries a direct implication: the places where cities encourage cycling are the places where cyclists are dying, so arterial safety must precede any push to grow cycling. Prevention that waits until ridership expands risks amplifying the very fatalities this census documents, because the growth is not random but channeled through a small number of road types and demographic groups that can be named and treated.
The overall increase agrees with the national picture reported by the federal agency, which describes 2023 as the deadliest year for pedalcyclists in more than four decades.( 4) It also matches the pandemic-period acceleration of bicyclist deaths documented in national data, when emptier roads encouraged faster driving and shifted travel patterns.( 10)
Exposure-adjusted work offers a partial counterpoint, since bicycle fatality rates per distance or per trip improved during earlier decades even as raw counts climbed.( 5) The two readings are compatible: more people cycling in more dangerous places can raise the count while the per-trip risk falls, and this study suggests the added trips are overwhelmingly urban. An absolute count therefore remains the right headline for a national safety problem, even though it is not, by itself, a measure of risk.
The timing of the rise points to the pandemic as an accelerator rather than a cause. Bicyclist fatality trends turned sharply upward after 2019 in national data, as traffic volumes dropped, speeds rose and travel shifted toward outdoor and solo modes.( 10)
The same years saw motor vehicle fatalities worsen most where socioeconomic conditions were already strained,( 11) and pedestrian fatality analyses document a similar post-2020 inflection.( 12) The continuation of the rise through 2023, however, indicates that the pandemic exposed a pre-existing structural drift toward urban, arterial and older-adult cycling that outlived the emergency period.
The urban shift is the clearest finding, and it aligns with analyses that treat urban and rural environments as distinct safety systems with different speeds, intersection density and separation of cyclists.( 3)
The rural decline is consistent with evidence that community vulnerability and safety operate differently across urban, suburban and rural contexts, and with the lower and falling exposure of rural residents to motorized traffic.( 6)
The rural result should not be read as reassurance, because rural crashes still involve higher speeds, longer emergency response times and a smaller share of riders who survive the pre-hospital interval, all of which are documented in the safe system literature.( 3)
At the same time, rural cycling carries its own distinct risk profile, including lower helmet use among rural adolescents and crash concentrations that cluster in specific corridors rather than across dense networks.( 13,14)
The urban share observed here matches the federal estimate for the same year.( 4) The persistence of a substantial rural minority, even as its absolute count fell, means that rural-specific measures such as shoulder improvements and faster emergency response remain relevant despite the urban concentration.
The aging of the fatality profile reproduces findings that older bicyclists show the most severe crash outcomes and distinct risk patterns, including lower tolerance of injury and higher fatality risk at a given impact.( 7,15)
The decline among children is consistent with falling child bicycle injury rates reported in other high-income settings,( 16) while child crash determinants remain concentrated in the same urban traffic conditions that affect adults, particularly near schools.( 17,18)
The rise of e-bikes offers a plausible mechanism for the growth at ages 65 and older, because e-bikes extend older adults' range and speed, and e-bike and bicycle injuries in the United States cluster in comparable crash types.( 8,19)
The modest movement of the median age, which changed by one year, sits alongside the steep growth in the oldest group and reveals that the distribution widened rather than shifted uniformly. The middle adult bands still account for the largest share of deaths, while the fastest growth occurs at the extremes, up among older riders and down among children. Prevention therefore faces two profiles: a large, stable group of working-age adults and a small, rapidly growing group of older riders whose fatality risk per crash is highest.( 7)
The roadway pattern points to arterials as the dominant and fastest-growing location, which agrees with work linking cyclist crash risk to level of traffic stress and to high-speed arterial corridors.( 20)
To a lesser extent, the concentration at intersections matches studies of bicycle crashes at urban signalized intersections and of how intersections accommodate cyclists.( 21,22)
The small freeway share mirrors the low but severe pattern documented for pedestrians on interstates and freeways.( 23) Second, speed appears to be the common thread across these roads, and both the effectiveness of 30 km/h limits and of speed-limit reductions on roads with many cyclists support speed management as a primary lever.( 24,25)
The vehicle fleet offers a further amplifier. Larger and heavier passenger vehicles, which have grown in the fleet over the study period, produce worse outcomes for pedestrians and cyclists in crashes, and the federal tabulations point to light trucks as the vehicle type involved in the largest share of cyclist deaths.( 4) Vehicle design, like road design, therefore sits within the same safe system frame, in which speed, mass and separation jointly determine whether a collision becomes a fatality.( 3)
The fleet change operates in the same direction as the roadway pattern: heavier vehicles and arterials that carry them at speed multiply the energy transferred to an unprotected cyclist, and the two trends reinforce each other on the exact corridors where the deaths concentrate.
The sex distribution, in which males accounted for the large majority of deaths, matches the federal figure for the same year and the long-standing overrepresentation of men in cycling fatalities.( 4)
This pattern reflects both higher male ridership and higher risk behavior, and it cautions against reading the overall rise as a uniform increase across all cyclists. The alcohol dimension, which other analyses of the same public files have linked to pedalcyclist fatalities, reinforces the point that person-level circumstances modify the risk that road and vehicle design set in motion.( 26) A safe system response does not deny that behavioral factor; it accepts that impaired riding and driving will occur and asks the road to absorb the error instead of converting it into a death.
Mechanisms for the urban and arterial concentration plausibly combine rising urban ridership with infrastructure that protects cyclists least exactly where exposure is highest.
Cycling infrastructure reduces injury when installed,( 27) and physical roadway interventions cut injuries and deaths for vulnerable road users in cities,( 28) yet the safety-in-numbers effect is uneven and does not by itself offset the risk of high-speed arterials.( 29,30)
Contextual elements such as speed, traffic volume and facility type remain the dominant modifiers of bicyclist safety.( 2,31)
The implication for evaluation is that both the count of riders and the character of the road must be measured together, otherwise a widening of a cycle network can be misread as a safety failure when it is in fact an exposure shift.
The counterfactual of exposure deserves emphasis. Cities with high bicycling rates record lower per-rider fatality risk than cities with low rates, a paired pattern documented across small and mid-sized US cities.( 1)
The safety-in-numbers effect has been reproduced for injury severity and for intersection crashes,( 29,30) but it operates through the same corridors that this census identifies as hazardous, which means additional riders on an unprotected arterial can still raise the absolute count even as the per-rider rate falls. That distinction reconciles the apparent contradiction between rising counts and improving exposure-adjusted rates.( 5)
The pattern also departs from several high-income peers, where child cycling injuries and overall cyclist risk have fallen as safety cultures matured.( 16) In European settings, the discussion of cyclist safety centers on intersection design and moderate speed limits rather than on a rising absolute toll, which suggests that the US urban increase is partly a consequence of road environments that have not caught up with growing ridership.( 22,24)
Comparisons with studies of bicycle crashes at signalized intersections strengthen the case that the lever is design rather than demand.( 21) The US experience therefore reads less as an unavoidable consequence of more cycling and more as a gap between the rate at which ridership grew and the rate at which the road environment adapted.
The demographic composition of the fatalities also situates the problem within broader inequalities. Traffic fatalities in the United States are not distributed evenly by income, race and urbanicity, and the pandemic deepened those disparities.( 11,32)
Pedestrian analyses show how place-based disadvantage concentrates fatal crashes,( 33) and death rates by urbanicity differ materially across social vulnerability profiles.( 34) Cyclist deaths should be read within the same geography of disadvantage, even though this census could not attach neighborhood-level socioeconomic data to each fatality. Targeting the arterial corridors that dominate this census would therefore reduce the toll and, at the same time, reach the places where the burden falls hardest on already disadvantaged communities.
Methodologically, the study shows that a national administrative file can be harmonized across a schema change with modest effort, and that the resulting series tracks the agency's own tabulations closely.( 4)
Comparable work on pedalcyclists has relied on the same public files and reached consistent case definitions, which supports the portability of the present approach.( 26) Future surveillance could benefit from linking these fatality records to hospital data and to ridership counts, a combination that would convert the census counts reported here into rates and risk estimates.( 35)
Surveillance itself is part of the remedy. The annual FARS release makes a national census of this problem freely available, and the harmonization reported here shows that a decade-long series can be assembled without specialist access.( 9)
State and local programs could apply the same pipeline to their own files to monitor whether arterial and older-rider trends are shared, and to evaluate whether protected-lane and speed programs bend the curves documented here. The missing input is not a fatal-crash file but a reliable denominator of ridership by place and age, without which progress will be judged in lives rather than in risk.( 5)
The strengths of this analysis are its census scope, the eleven-year harmonized series and the fully reproducible pipeline that maps two FARS schemas into one classification. The census nature removes sampling uncertainty, and the explicit harmonization makes the schema change visible rather than hidden, which is rarely the case in long national series.
Reading the three axes together, rather than separately, is what distinguishes this account. Prior studies have documented the urban predominance, the older-adult excess and the arterial concentration one at a time.( 3,7,20)
Considered jointly they reveal a single profile, an urban, middle-aged to older male rider on an arterial, that concentrates the growth and therefore deserves the combined attention of infrastructure, speed management and demographic-sensitive design. Single-axis reporting risks fragmenting a coherent target into three partial problems.
The limitations are equally concrete. First, the counts are not exposure-adjusted, so the study cannot separate more cycling from more risk per cyclist; future work should pair these fatalities with ridership or trip denominators.( 5)
Second, the urban-rural field changed definition during the period, and although the harmonization is documented, residual misclassification of a small number of records is possible; validation against agency tabulations is recommended.( 4) Third, the analysis used only location, age and sex, leaving crash circumstances such as alcohol, helmet use and vehicle type unexamined, which studies using the same public files show to matter.( 26,35)
Fourth, the national census obscures local disparities by income and race that other analyses of traffic fatalities have documented.( 32,34)
Fifth, the ecological design describes group-level patterns and cannot attribute causation or individual risk, so the findings support targeting but not causal claims.
The policy reading follows from these patterns. Protected lanes and speed reduction on principal and minor arterials target the largest and fastest-growing segment, and a safe system design that separates older cyclists from high-speed traffic is the intervention most directly supported by the age and roadway patterns.( 3,24)
Reduced urban speed limits, protected intersections and age-friendly cycle facilities are the concrete instruments that match the three axes documented here. Age-sensitive design, including separated facilities comfortable for slower and less confident riders, extends the same logic to the fastest-growing demographic group. Cities that frame cycling growth as a safety project first, and an exposure project second, are best positioned to reverse the urban increase documented here.( 1)
CONCLUSIONS
Pedalcyclist fatalities in the United States increased from 2013 to 2023, and the increase was concentrated in urban settings. The growth was largest among adults aged 65 years or older and on principal and minor arterial roadways, while deaths on local roads and among children declined. These patterns locate the burden on urban arterial corridors and older cyclists and support prioritizing protected infrastructure and lower speeds on those corridors, with surveillance that links fatality records to ridership so as to track risk rather than counts alone. The census nature of the data makes the picture definitive for the United States over the study period, and it leaves the design of safer urban arterials as the clearest next step for both research and practice.
References
- 1 Ferenchak NN, Marshall WE. Traffic safety for all road users: A paired comparison study of small & mid-sized U.S. cities with high/low bicycling rates. Journal of Cycling and Micromobility Research. 2024;2:100010. doi: 10.1016/j.jcmr.2024.100010
- 2 Dai B, Dadashova B. Review of contextual elements affecting bicyclist safety. Journal of Transport & Health. 2021;20:101013. doi: 10.1016/j.jth.2021.101013
- 3 Charyk Stewart T, Pellar A, Halari M, McClafferty K, Verville P, Pickup M, et al. Safe system approach to preventing cyclist fatalities: safety by design for urban and rural environments. Inj Epidemiol. 2025;12(S1):71. doi: 10.1186/s40621-025-00621-w
- 4 National Highway Traffic Safety Administration. Traffic Safety Facts 2023 data: bicyclists and other cyclists (DOT HS 813 739) [Internet]. 2025. Available from: https://crashstats.nhtsa.dot.gov/Api/Public/ViewPublication/813739
- 5 Ferenchak NN, Marshall WE. Is bicycling getting safer? Bicycle fatality rates (1985–2017) using four exposure metrics. Transportation Research Interdisciplinary Perspectives. 2020;8:100219. doi: 10.1016/j.trip.2020.100219
- 6 Kasha A, Tefft BC, Steinbach R. Community vulnerability influences traffic safety differently in urban, suburban, and rural areas. Journal of Transport & Health. 2025;44:102146. doi: 10.1016/j.jth.2025.102146
- 7 Mimi MS, Islam MM, Sheykhfard A, Das S. Crash risk patterns among older bicyclists: Insights from hybrid XGBoost-Cluster Correspondence Analysis. Journal of Safety Research. 2025;95:301-317. doi: 10.1016/j.jsr.2025.10.009
- 8 Kröyer H. Bicycles, E-Bikes and Micromobility, A Traffic Safety Overview. In: International Encyclopedia of Transportation. Elsevier; 2021. p. 125-138. doi: 10.1016/b978-0-08-102671-7.10102-2
- 9 National Highway Traffic Safety Administration. Fatality Analysis Reporting System (FARS): annual National CSV files, 2013-2023 [Internet]. 2025. Available from: https://static.nhtsa.gov/nhtsa/downloads/FARS/2023/National/FARS2023NationalCSV.zip
- 10 Ferenchak NN. US road safety during COVID-19: motorist, pedestrian and bicyclist fatality trends. IJDRBE. 2025;16(2):193-208. doi: 10.1108/ijdrbe-09-2022-0091
- 11 Tefft BC, Steinbach R. COVID-19 pandemic exacerbated socioeconomic disparities in motor vehicle traffic fatalities. American Journal of Epidemiology. 2025;194(7):2112-2116. doi: 10.1093/aje/kwae068
- 12 Bamney A, Gupta N, Keshari S, Joshi M. Analyzing pedestrian fatalities in the United States: A comparative study of pedestrian and census tract level factors across pre-, during, and late-pandemic periods. Journal of Safety Research. 2025;95:10-24. doi: 10.1016/j.jsr.2025.08.007
- 13 Askelsen BL, Iverson BJ, Spolsdoff DE, Hoogerwerf PJ, Vergara B, Jennissen CA. Rural adolescent attitudes and use of bicycle helmets in Iowa. Inj Epidemiol. 2025;12(S1):41. doi: 10.1186/s40621-025-00596-8
- 14 Rizwan M, Alam BM, Kwarteng Y. Mapping Bicycle Crash-Prone Areas in Ohio Using Exploratory Spatial Data Analysis Techniques: An Investigation into Ohio DOT’s GIS Crash Analysis Tool Data. Future Transportation. 2025;5(3):103. doi: 10.3390/futuretransp5030103
- 15 Scarano A, Sadeghi M, Mauriello F, Riccardi MR, Aghabayk K, Montella A. Cyclist crash severity modeling: A hybrid approach of XGBoost-SHAP and random parameters logit with heterogeneity in means and variances. Journal of Safety Research. 2025;93:373-398. doi: 10.1016/j.jsr.2025.04.003
- 16 Thorsdottir SE, Lauritsen JM, Faergemann C. Trends in bicycle related injuries in children 0–9 years of age in an urban Danish population 1980-2023. Injury. 2025;56(6):112290. doi: 10.1016/j.injury.2025.112290
- 17 Chakraborty R, Mills D, Das S. Children on wheels: Identifying crash determinants using cluster correspondence analysis. Accident Analysis & Prevention. 2025;216:108025. doi: 10.1016/j.aap.2025.108025
- 18 Bahrami V, Lavrenz S, Ahmed MM. Severity Analysis of Pedestrian and Bike Crashes in School Buffer Zones. Transportation Research Record: Journal of the Transportation Research Board. 2025;2679(4):732-748. doi: 10.1177/03611981241297682
- 19 Younes H. Comparing injuries from e-scooters, e-bikes, and bicycles in the United States. Journal of Cycling and Micromobility Research. 2025;4:100061. doi: 10.1016/j.jcmr.2025.100061
- 20 Gehrke SR, Russo BJ, Holliday TM. Cyclist-Involved Crashes and Level of Traffic Stress: Evidence from Arizona. Transportation Research Record: Journal of the Transportation Research Board. 2025;2679(6):918-931. doi: 10.1177/03611981251322611
- 21 Schröter B, Hantschel S, Huber S, Gerike R. Determinants of bicycle crashes at urban signalized intersections. Journal of Safety Research. 2023;87:132-142. doi: 10.1016/j.jsr.2023.09.011
- 22 Zanetti C, Marincek D, Rérat P. How to accommodate cycling at intersections. The limits of behavioural measures. Journal of Cycling and Micromobility Research. 2025;6:100094. doi: 10.1016/j.jcmr.2025.100094
- 23 Wang J, Cicchino JB. Fatal pedestrian crashes on interstates and other freeways in the United States. Journal of Safety Research. 2020;74:1-7. doi: 10.1016/j.jsr.2020.04.009
- 24 Yannis G, Michelaraki E. Effectiveness of 30 km/h speed limit – A literature review. Journal of Safety Research. 2025;92:490-503. doi: 10.1016/j.jsr.2024.11.003
- 25 Schaefer JS, Figliozzi MA, Unnikrishnan A. Evaluation of Posted Speed Limits Reductions on Urban Roads with a High Percentage of Cyclists. Transportation Research Record: Journal of the Transportation Research Board. 2022;2676(6):685-695. doi: 10.1177/03611981221076115
- 26 Burford KG, Rundle AG, Frangos S, Pfaff A, Wall S, Adeyemi O, et al. Comparing alcohol involvement among injured pedalcycle and motorcycle riders across three national public-use datasets. Traffic Injury Prevention. 2024;25(8):1023-1030. doi: 10.1080/15389588.2024.2364358
- 27 Anupriya, Zhu X, McCoy E, Graham DJ. Safe streets for cyclists? Quantifying the causal impact of cycling infrastructure interventions on safety. Accident Analysis & Prevention. 2025;220:108168. doi: 10.1016/j.aap.2025.108168
- 28 Roberts LE, Bushover B, Mehranbod CA, Gobaud AN, Fish C, Eschliman EL, et al. Physical environmental roadway interventions and injury and death for vulnerable road users: a natural experiment in New York City. Inj Prev. 2025;31(5):420-423. doi: 10.1136/ip-2023-045219
- 29 Islam A, Mekker M, Singleton PA. Investigating bicycle crash frequency, severity, and safety in numbers at signalized intersections in Utah using crowdsourced data. Journal of Cycling and Micromobility Research. 2025;4:100068. doi: 10.1016/j.jcmr.2025.100068
- 30 Lian Y, Zhou E, Lee J, Abdel-Aty M. Existence of the safety-in-numbers effect in the aspect of injury severity: A macroscopic analysis for bicyclists and pedestrians. Journal of Safety Research. 2022;83:302-309. doi: 10.1016/j.jsr.2022.09.004
- 31 Cai Q, Abdel-Aty M, Castro S. Explore effects of bicycle facilities and exposure on bicycle safety at intersections. International Journal of Sustainable Transportation. 2021;15(8):592-603. doi: 10.1080/15568318.2020.1772415
- 32 Raifman MA, Choma EF. Disparities in Activity and Traffic Fatalities by Race/Ethnicity. American Journal of Preventive Medicine. 2022;63(2):160-167. doi: 10.1016/j.amepre.2022.03.012
- 33 Sanders RL, Schneider RJ. An exploration of pedestrian fatalities by race in the United States. Transportation Research Part D: Transport and Environment. 2022;107:103298. doi: 10.1016/j.trd.2022.103298
- 34 Barry V, Matthews SA, Beck L, Rockhill S, Fletcher K, West BA, et al. Motor vehicle crash death rates among passenger vehicle occupants and pedestrians by county-level social vulnerability and urbanicity: the USA, 2019. Inj Prev. 2025:ip-2025-045633. doi: 10.1136/ip-2025-045633
- 35 Schubert A, Campolettano ET, Scanlon JM, McMurry TL, Unger T. Bridging the gap: Mechanistic-based cyclist injury risk curves using two decades of crash data. Traffic Injury Prevention. 2024;25(sup1):S105-S115. doi: 10.1080/15389588.2024.2400276
Declarations
Funding
No financing
Conflict of interest
None
Authorship contributions
Drafting – original draft: Rómulo Esteban Montilla, Edixon Chacón Guerrero.
Writing–review and editing: Rómulo Esteban Montilla, Edixon Chacón Guerrero.