

Abstract
Introduction: Electric scooters and electric bicycles have expanded rapidly in United States cities, and emergency department surveillance points to a growing injury burden, but their comparative national trajectory through 2024 is not well quantified. Methods: This retrospective cross-sectional study analyzed the National Electronic Injury Surveillance System, a probability sample of United States emergency departments, from 2017 through 2024. Cases were identified with narrative keywords and product codes for powered scooters and electric bicycles. National estimates and proportions were computed with survey weights and a design-based variance estimator, with 95% confidence intervals. Results: A total of 12,754 e-scooter and 7,141 e-bike visits were identified, representing national estimates of 456,126 and 285,075 emergency department visits. Annual e-scooter estimates climbed from 18,644 in 2017 to 126,420 in 2024 (578%) and e-bike estimates from 12,015 to 88,429 (636%). Median age was 27 years for e-scooters and 31 years for e-bikes, and 63.3% and 71.5% of patients were male. Fractures accounted for 27.0% and 22.1% of injuries, and hospital admission for 11.0% and 12.0%. Conclusions: Emergency department injuries from e-scooters and e-bikes increased sharply from 2017 to 2024 and show device-specific age and injury profiles, which supports targeted prevention.
Keywords
electric scooter, electric bicycle, emergency department, injuries, NEISS, micromobility
INTRODUCTION
Shared electric scooters and electric bicycles have become common features of urban mobility in the United States since the first dockless scooter fleets appeared in 2017. Cities adopted these devices as instruments for short trips, first- and last-mile connections, congestion relief, and lower-carbon travel, and their use has grown in parallel with public investment in cycling infrastructure and dedicated lanes.
By the early 2020s, shared and privately owned e-scooters accounted for tens of millions of trips annually in the largest metropolitan areas, and several states reported e-bike purchases rising faster than any other vehicle category. Electric bicycle sales, in particular, expanded sharply during and after 2020, outpacing conventional bicycle sales in several national markets and attracting riders who had not previously cycled for transport. This rapid diffusion has not been free of cost.
Emergency department surveillance shows a rising volume of injuries associated with these devices, and national analyses now treat micromobility trauma as an emerging public health problem rather than an isolated urban novelty.( 1,2) Unlike conventional bicycles, e-scooters expose riders to small wheels, a standing posture, and forward ejection over the handlebars, often without helmets, while e-bikes combine bicycle ergonomics with motorized acceleration, higher mass, and greater speed.( 3,4)
These mechanical differences imply that the two devices may produce different injury profiles, yet they are frequently grouped together in policy and surveillance reporting, which can obscure where prevention should be directed. The regulatory response has been similarly fragmented: helmet mandates, speed limits, and age restrictions vary across states and cities, and no single national standard governs the design or operation of either device. Reliable national estimates of injury burden are a prerequisite for that regulation, because they establish the size and composition of the problem that policy must address.
Available estimates anticipate a steep upward pattern for both devices. National surveillance identified roughly 4,600 electric scooter injuries in 2014 and about 29,000 in 2019, a rise that coincided with the rollout of shared fleets.( 1)
Federal reports from the Consumer Product Safety Commission place micromobility injuries in the tens of thousands per year by 2021 and note that e-scooter and e-bike cases carry a meaningful share of fractures and hospitalizations.( 4)
A national comparison of electric and conventional scooters and bicycles found that electric devices carry a higher risk of hospitalization than their non-motorized counterparts.( 5)
Subsequent analyses of the same system report that electric bicycle injuries have increased faster than injuries from conventional bicycles, with fractures and hospital admissions rising most among adults.( 6,7)
Head and neck injuries from powered scooters and e-bikes follow a similar trajectory, and they concentrate in young men for scooters and in older riders for e-bikes.( 8,9)
Pediatric series add that fractures from powered scooters have climbed among children and adolescents even as conventional scooter injuries have stabilized.( 10)
Regional surveillance in Illinois and state-level studies confirm the same direction at subnational scales.( 11) The expected pattern, therefore, is one of accelerating national counts for both devices, with e-scooter injuries skewed toward younger adults and e-bike injuries toward middle-aged and older riders.
Most national studies have examined a single device, a shorter window, or a period ending before 2023, so the comparative trajectory of e-scooter and e-bike injuries across the full adoption period remains uncertain.( 2,12)
The years after 2020 are particularly informative because they capture the pandemic shift toward e-bike commuting and the return of shared scooter fleets, yet they are the least represented in the published record. A direct comparison of the two devices over the same recent interval, with consistent case definitions and design-based national estimates, would clarify whether prevention resources should be allocated differently to each device.
This study aimed to estimate national counts of e-scooter and e-bike emergency department visits in the United States from 2017 through 2024, to describe their trajectory, to characterize the injuries and age groups that predominate for each device, and to compare the likelihood of hospital admission between them.
METHODS
Study design
This retrospective cross-sectional analysis used the National Electronic Injury Surveillance System (NEISS), a probability sample of hospital emergency departments in the United States and its territories operated by the Consumer Product Safety Commission.( 13) The study period covered January 1, 2017, through December 31, 2024, and the reporting followed the STROBE recommendations for observational studies of routine surveillance data.
Data source
NEISS collects de-identified records of emergency department visits associated with consumer products or recreational activities from approximately 100 hospitals sampled within five strata defined by size and geography, and assigns a sample weight that scales each record to a national estimate.( 13)
The weight reflects the inverse probability of hospital selection within each stratum, so that the sum of weights for a given diagnosis or product approximates the national number of visits. Each record includes the treatment date, patient age and sex, the primary body part and diagnosis, the disposition, up to three product codes, and a free-text narrative describing the injury. The annual public files were obtained from an open consolidated Parquet mirror of the NEISS records (Layered-Labs/neiss-injury-data, Hugging Face), which concatenates the CPSC annual files for 2005 through 2024.( 14)
Case identification
E-scooter cases were defined as records whose narrative text matched electric scooter, e-scooter, motorized scooter, or powered scooter, including ride-share and rental scooters and common brands, or whose product code was 5042 (scooters and skateboards, powered, used from 2017 through 2019) or 5022 (scooters, powered, used from 2020 onward). E-bike cases were defined as records whose narrative matched e-bike, electric bicycle, or power-assisted bicycle, or whose product code was 5045 (electric bicycles, present in the 2024 file).
Records whose narrative indicated a moped, motorcycle, dirt bike, gas-powered vehicle, mobility scooter, wheelchair, all-terrain vehicle, hoverboard, skateboard, or golf cart were excluded from the corresponding group, because these devices are distinct from e-scooters and e-bikes and would otherwise be captured by the same product codes. Fifty-nine records that met both definitions were excluded from the device-specific comparisons. The product codes and the 2020 change from 5042 to 5022 follow the NEISS coding manual, and the case definition was applied identically to all years so that the trend does not simply reflect a change in coding.( 13)
Variables
Year was derived from the treatment date. Age was recorded in years for patients aged two years or older and in months for younger children, and was grouped as 0 to 17, 18 to 34, 35 to 54, and 55 or more years. Sex was classified as male or female. Primary diagnosis was grouped into fracture (code 57), contusion or abrasion (53), strain or sprain (64), laceration (59), internal organ injury (62), concussion (52), and other, following the NEISS diagnosis codes.( 13)
Primary body part was grouped into head, face, or neck (codes 75, 76, 77, 88, 89, and 94); upper extremity (30, 80, 32, 33, 34, 82, and 92); lower extremity (81, 35, 36, 37, 83, and 93); trunk (31, 79, and 38); and other. Disposition was classified as hospitalized (code 4), treated and released (code 1), or other, which included transfer, observation, leaving without treatment, and death.( 13)
Statistical analysis
All analyses incorporated the NEISS sample weight, with variance estimated from the stratified one-stage cluster design using stratum and hospital (primary sampling unit) identifiers.( 13) For each national total, the hospital-level weighted sums were computed within each stratum and the standard Taylor-series formula for a stratified one-stage cluster sample was applied. Annual national estimates and 95% confidence intervals were computed for each device, and Figure 1 plots these estimates against year.
A weighted least-squares regression of the annual estimates on year, with inverse-variance weights, estimated the average annual change and its p value. Pooled 2017 to 2024 totals and category proportions used year and stratum as stratification variables and hospital as the primary sampling unit, so that between-year sampling variation contributed to the pooled confidence intervals. Category proportions were estimated with a ratio estimator and its linearized variance.
Figure 2 plots the weighted age distribution of each device, Figure 3 the diagnosis distribution, and Figure 4 the body region distribution. Table 1 reports the exact annual estimates and confidence intervals that underlie Figure 1, and Table 2 the exact percentages and confidence intervals that underlie Figures 2 to 4 and the disposition analysis. The difference in hospital admission between devices was tested with a design-based ratio estimator for the difference of two proportions. As a sensitivity analysis, e-scooter totals were re-estimated from narrative text alone, without product codes, to assess how much the estimates depended on the coding scheme.
Records with missing sample weights, which occurred in a subset of the 2024 file, were excluded from the weighted estimation. The analysis script was executed twice and produced identical metric files, confirming the reproducibility of the estimates; a two-sided significance level of 0.05 was used.
Data quality and missing values
Records with missing sample weight, stratum, or primary sampling unit identifiers were excluded from the weighted estimation because they cannot contribute to a design-based national estimate.
These records were concentrated in the 2024 file and represented a small fraction of that year's total; their exclusion is reported in the statistical analysis. Narrative fields were reviewed to confirm that the keyword patterns captured the intended devices and that the exclusion terms removed mopeds, mobility scooters, and similar products, and a random sample of classified records was inspected against the source narratives. Age values coded in months for children younger than two years were converted to years before grouping, and records with an implausible or missing age were left out of the age distribution but retained in the overall totals.
Ethical considerations
The study used de-identified, publicly available surveillance data and did not require institutional review.
RESULTS
The sample contained 12,754 e-scooter and 7,141 e-bike injury visits between 2017 and 2024, and 59 additional records that met both definitions were excluded from the device-specific comparisons. The national estimate of e-scooter injuries climbed from 18,644 in 2017 to 126,420 in 2024, a rise of 578% (Figure 1). The estimate reached 28,450 in 2018 and 43,391 in 2019, and the 2019 value had nearly tripled by 2024.
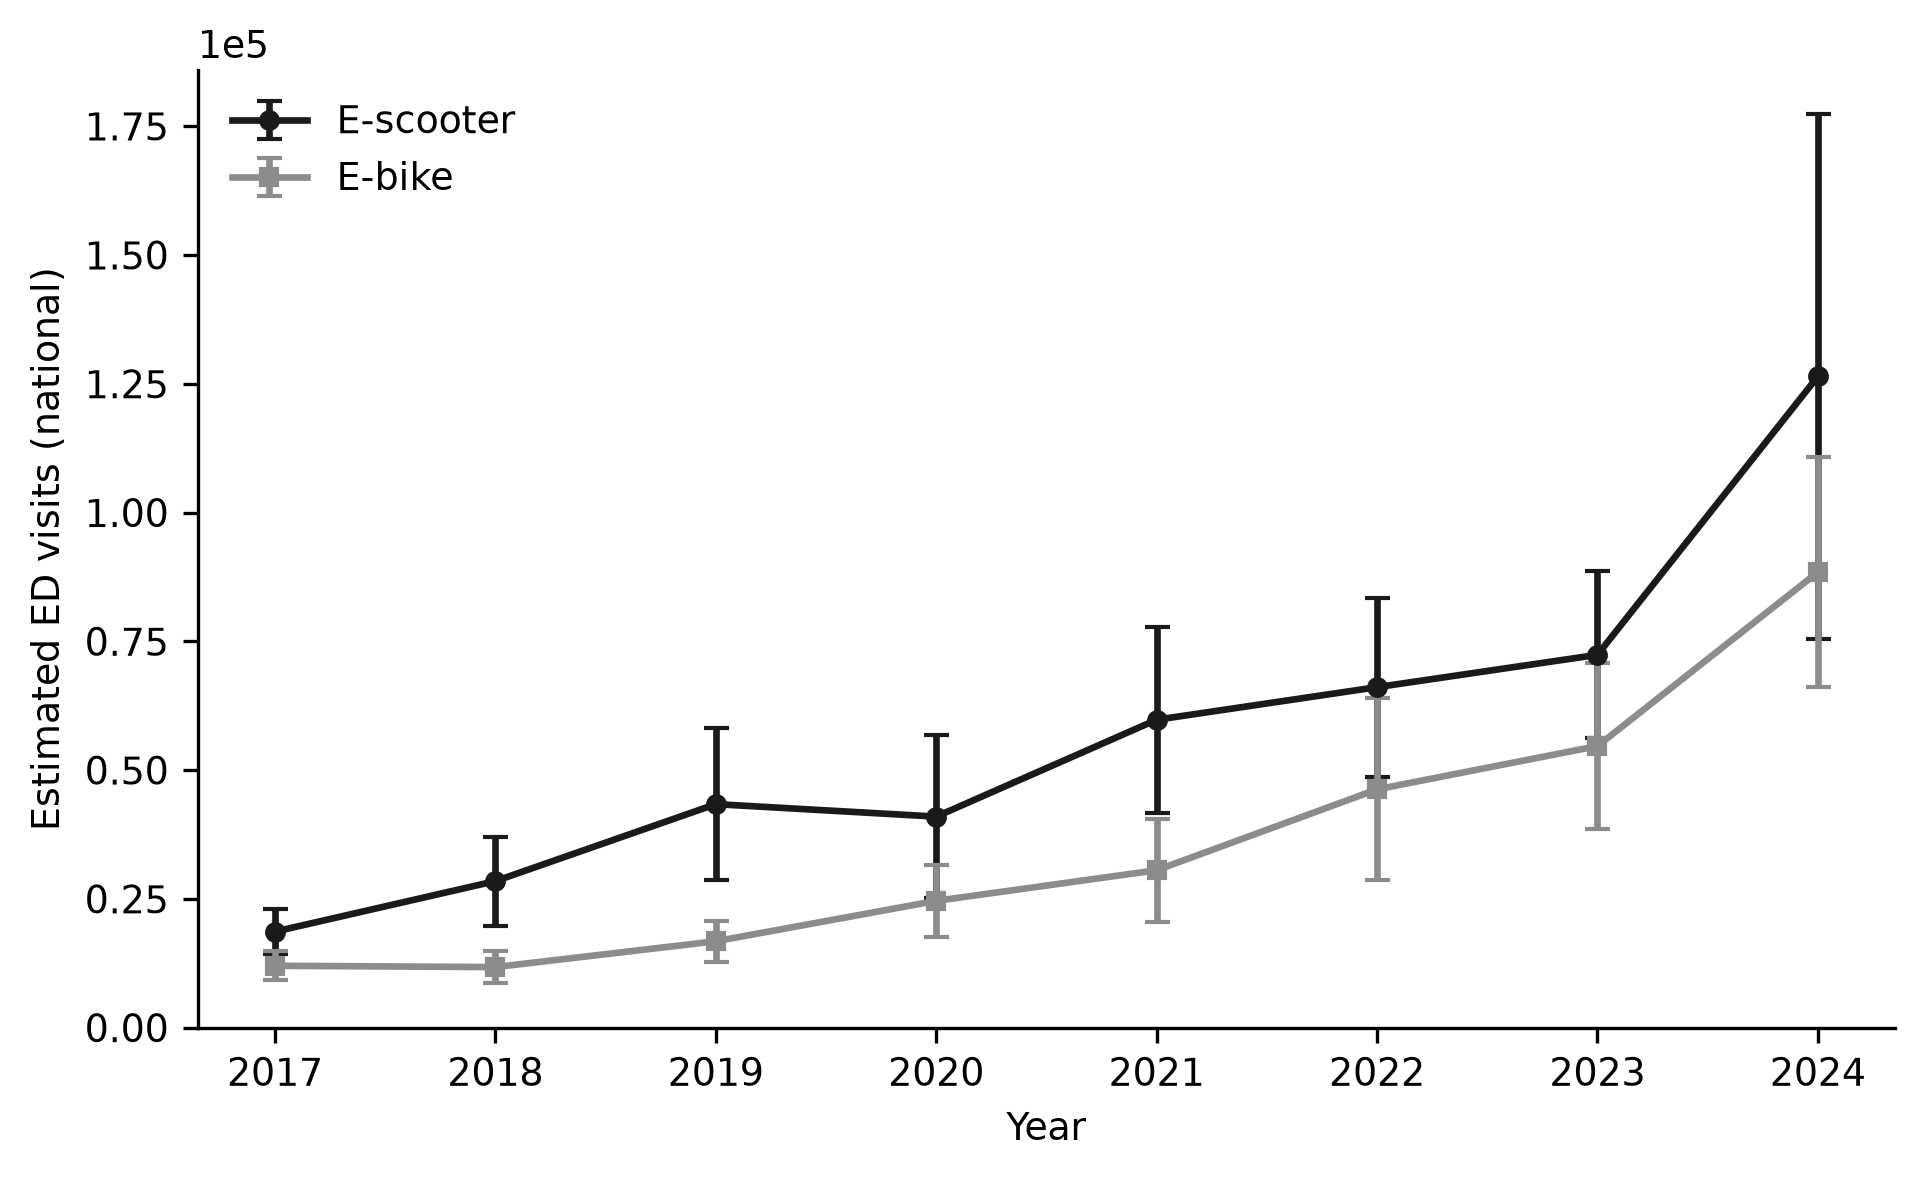
Figure 1. Annual national estimates of emergency department visits for e-scooter and e-bike injuries, United States, 2017-2024.
The trajectory paused in 2020, when the estimate of 40,968 fell below the 2019 value, and then resumed growth through 59,775 in 2021, 66,099 in 2022, and 72,378 in 2023 (Table 1). The e-bike estimate rose 636% over the same period, from 12,015 in 2017 to 88,429 in 2024. The e-bike curve remained near 11,757 in 2018, reached 16,776 in 2019, and then accelerated to 24,615 in 2020, 30,558 in 2021, 46,262 in 2022, and 54,663 in 2023.
Year | E-scooter estimate | E-scooter 95% CI lower | E-scooter 95% CI upper | E-bike estimate | E-bike 95% CI lower | E-bike 95% CI upper |
|---|---|---|---|---|---|---|
2017 | 18,644 | 14,323 | 22,965 | 12,015 | 9,231 | 14,799 |
2018 | 28,450 | 19,803 | 37,096 | 11,757 | 8,719 | 14,794 |
2019 | 43,391 | 28,590 | 58,192 | 16,776 | 12,760 | 20,792 |
2020 | 40,968 | 25,087 | 56,848 | 24,615 | 17,619 | 31,611 |
2021 | 59,775 | 41,716 | 77,835 | 30,558 | 20,593 | 40,522 |
2022 | 66,099 | 48,742 | 83,457 | 46,262 | 28,577 | 63,948 |
2023 | 72,378 | 56,140 | 88,617 | 54,663 | 38,578 | 70,749 |
2024 | 126,420 | 75,457 | 177,384 | 88,429 | 66,040 | 110,818 |
The average annual change was 9,646 visits for e-scooters (p = <0.001) and 5,876 visits for e-bikes (p = 0.006). Across the full period, the pooled estimate was 456,126 e-scooter visits (95% CI 392,462-519,789) and 285,075 e-bike visits (95% CI 249,662-320,489). The e-bike estimate exceeded the e-scooter estimate in no single year, although the gap narrowed from 2022 onward. The confidence intervals for 2024 were wider than for the preceding years (Table 1).
The age distribution differed between devices (Figure 2).
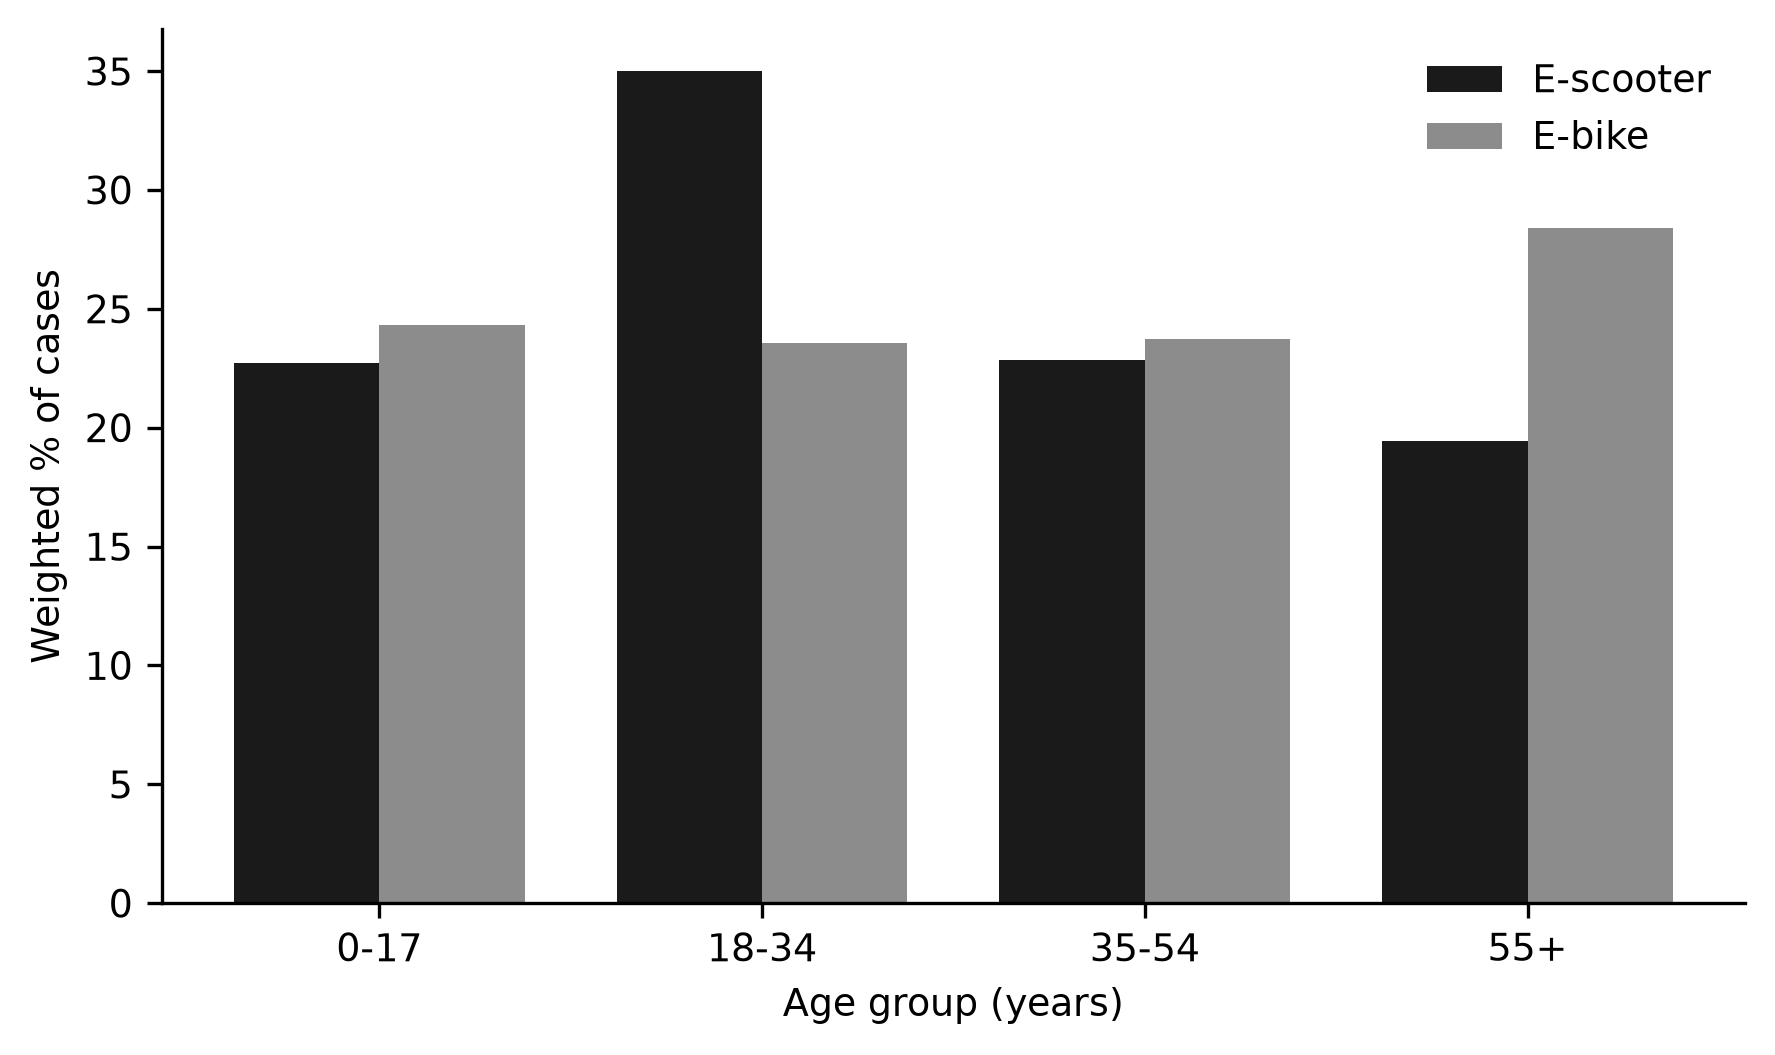
Figure 2. Age distribution of e-scooter and e-bike emergency department visits, United States, 2017-2024.
E-scooter injuries clustered in young adults, with 35.0% of cases among patients aged 18 to 34 years, whereas e-bike injuries spread more evenly across adulthood and peaked in patients aged 55 years or older at 28.4% (Table 2).
Characteristic | E-scooter % (95% CI) | E-bike % (95% CI) |
|---|---|---|
Age group (years) | ||
0-17 | 22.7 (19.8-25.6) | 24.3 (21.8-26.8) |
18-34 | 35.0 (32.3-37.7) | 23.6 (20.9-26.2) |
35-54 | 22.8 (20.9-24.7) | 23.7 (22.1-25.3) |
55+ | 19.4 (17.4-21.5) | 28.4 (25.9-30.9) |
Sex | ||
Male | 63.3 (61.2-65.3) | 71.5 (69.4-73.5) |
Female | 36.6 (34.6-38.6) | 28.4 (26.4-30.4) |
Diagnosis | ||
Fracture | 27.0 (25.5-28.4) | 22.1 (20.7-23.4) |
Contusion/abrasion | 19.0 (17.5-20.5) | 17.1 (15.7-18.5) |
Strain/sprain | 6.7 (5.9-7.4) | 7.3 (6.5-8.1) |
Laceration | 13.0 (12.2-13.8) | 14.0 (13.0-15.1) |
Internal organ injury | 11.7 (10.7-12.7) | 11.4 (10.2-12.7) |
Concussion | 2.4 (2.0-2.8) | 1.8 (1.4-2.2) |
Other | 20.3 (19.0-21.6) | 26.3 (24.5-28.2) |
Body region | ||
Head/face/neck | 33.1 (31.2-35.0) | 29.0 (27.7-30.4) |
Upper extremity | 28.2 (26.9-29.5) | 23.5 (22.2-24.8) |
Lower extremity | 26.0 (24.7-27.4) | 26.3 (24.8-27.8) |
Trunk | 11.1 (10.3-11.9) | 18.0 (16.6-19.3) |
Other | 1.5 (1.3-1.8) | 3.2 (2.7-3.8) |
Disposition | ||
Hospitalized | 11.0 (9.7-12.2) | 12.0 (9.9-14.2) |
Treated and released | 84.0 (82.7-85.4) | 83.0 (81.0-84.9) |
The modal age group was 18 to 34 years for e-scooters and 55 years or older for e-bikes. Children and adolescents accounted for 22.7% of e-scooter and 24.3% of e-bike cases, and adults aged 35 to 54 years for 22.8% and 23.7%. The median age was 27 years for e-scooter riders and 31 years for e-bike riders. Males predominated in both groups, at 63.3% of e-scooter and 71.5% of e-bike cases, and females represented 36.6% and 28.4%; the male predominance was stronger for e-bikes, and the female share of e-scooter injuries was the larger of the two.
Fractures were the leading diagnosis in both devices, at 27.0% of e-scooter and 22.1% of e-bike injuries (Figure 3). Contusions and abrasions accounted for 19.0% and 17.1%, and lacerations for 13.0% and 14.0% (Table 2). Strains and sprains were less frequent, at 6.7% and 7.3%. Internal organ injuries accounted for 11.7% and 11.4% of cases, and concussions for 2.4% and 1.8%. The residual diagnosis category was the second largest for e-bikes, at 26.3%, and accounted for 20.3% of e-scooter cases.
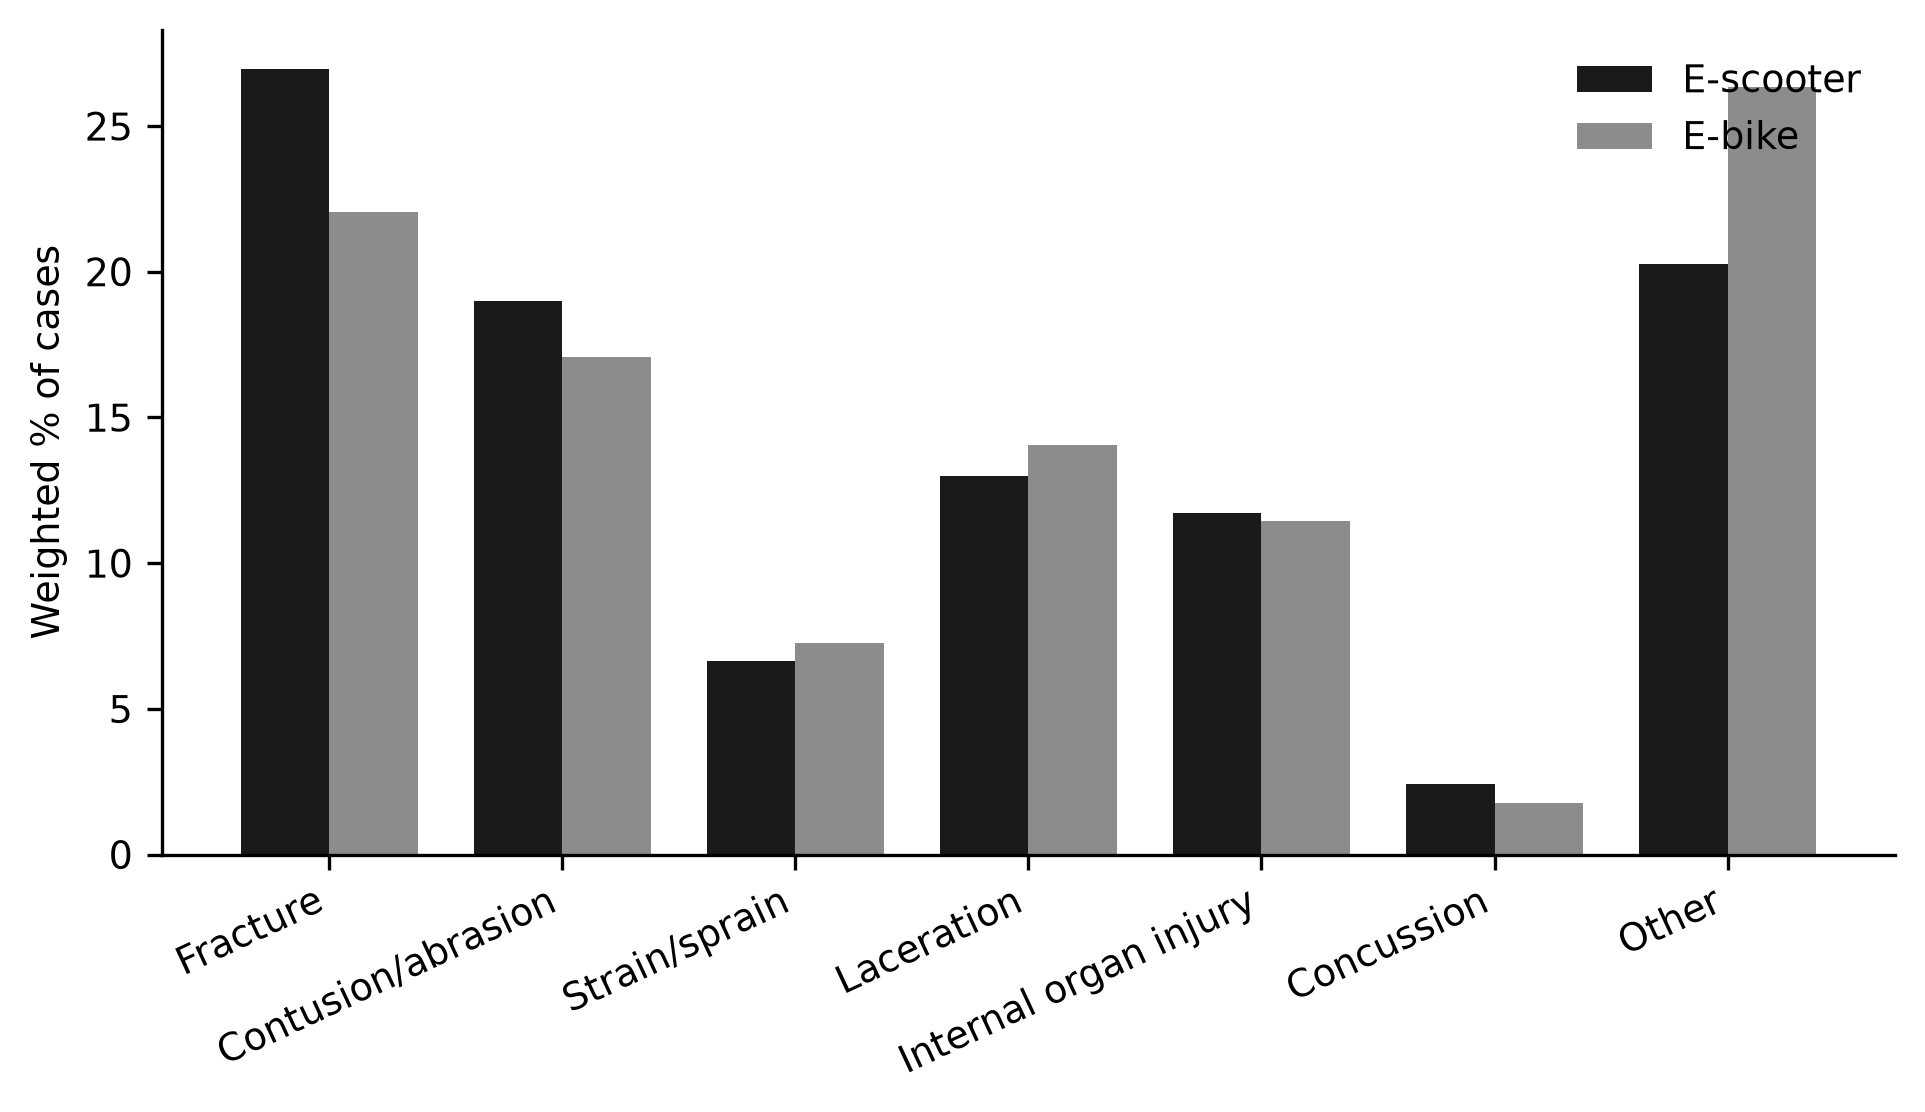
Figure 3. Diagnosis distribution of e-scooter and e-bike emergency department visits, United States, 2017-2024.
The distribution of body regions mirrored the diagnosis pattern (Figure 4). Head, face, or neck injuries accounted for 33.1% of e-scooter and 29.0% of e-bike cases (Table 2). Upper extremity injuries were present in 28.2% and 23.5%, and lower extremity injuries in 26.0% and 26.3%. Trunk injuries were more frequent in e-bike cases, at 18.0% versus 11.1%. The remaining body regions accounted for 1.5% and 3.2%.
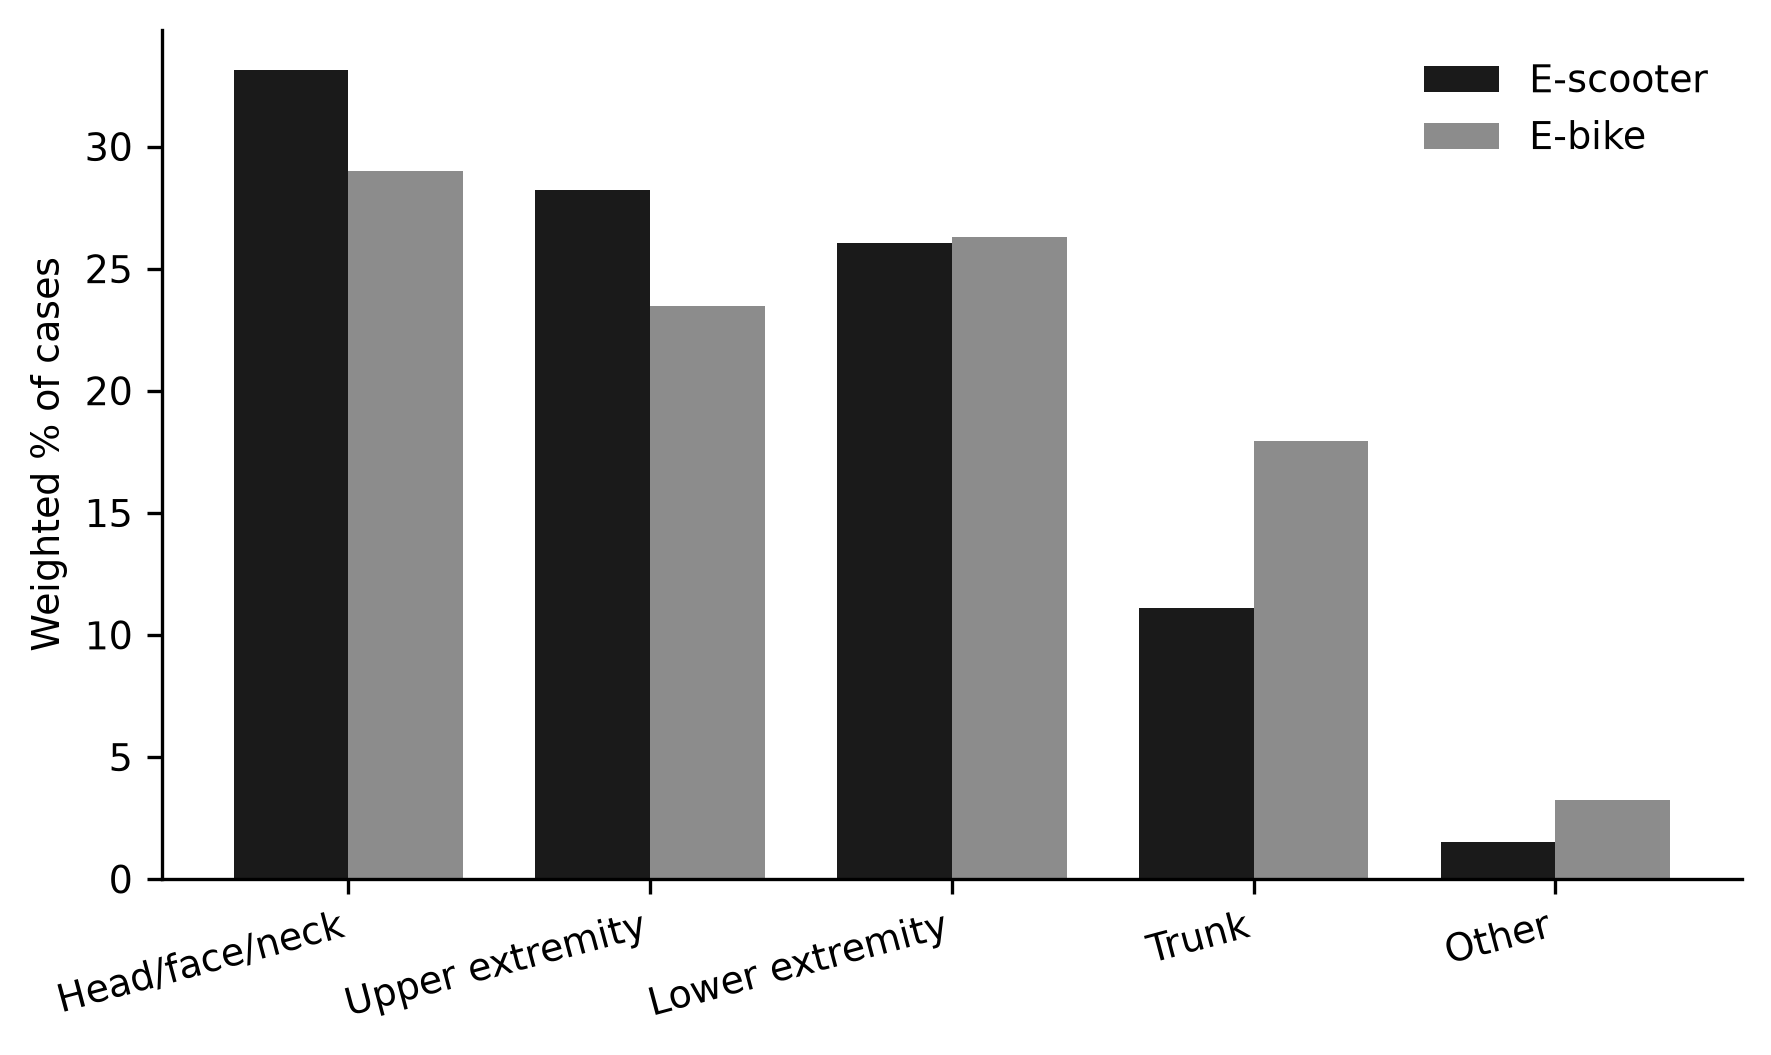
Figure 4. Body region distribution of e-scooter and e-bike emergency department visits, United States, 2017-2024.
The proportion hospitalized was 11.0% for e-scooters and 12.0% for e-bikes, and the proportion treated and released was 84.0% and 83.0% (Table 2). The remaining cases were transferred, observed, or left without being seen. The difference in hospitalization of −1.1 percentage points (95% CI −2.8 to 0.6) was not statistically significant (p = 0.218).
The sensitivity analysis restricted to narrative text without product codes produced a pooled e-scooter estimate of 88,831 visits, and the annual series retained the same direction and growth as the primary definition. This estimate was lower than the primary pooled estimate, as expected from the removal of code-identified cases.
DISCUSSION
The main finding is a steep and sustained rise in emergency department injuries from both e-scooters and e-bikes between 2017 and 2024, with e-scooters contributing more visits overall and e-bikes growing at a slightly faster relative pace. The two devices also produced distinct profiles: e-scooter injuries concentrated in young adult men with fractures and head and neck injuries, whereas e-bike injuries spread across a broader age range and carried a similar likelihood of hospital admission.
The growth pattern is consistent with earlier national surveillance. The estimated incidence of electric scooter injuries in the United States rose from 2014 to 2019 and was attributed to the expansion of shared fleets,( 1) and national analyses through 2022 found a continuing increase in powered scooter and e-bike injuries.( 2,15)
Single-city studies of dockless rental scooters in large United States metropolitan areas documented the same influx of injured riders soon after fleet launch, with young adult men overrepresented.( 16,17)
Orthopaedic series from level I trauma centers likewise described a rapid rise in e-scooter fractures as the devices became available.( 18,19)
The temporary decline in e-scooter visits observed in 2020 coincides with pandemic mobility restrictions and the interruption of shared services, a pattern also reported for fracture injuries associated with alternative transport during COVID-19.( 20)
The uninterrupted rise of e-bike injuries across the same period is consistent with the pandemic surge in e-bike sales and use documented in national data.( 6,7)
International evidence from China, where e-bikes have been established for decades, shows that e-bike crashes are a leading source of two-wheeled road injury, and systematic reviews there link higher speeds and mixed traffic to more severe outcomes than pedal bicycles.( 21)
Comparisons from Europe and Australia describe the same secular increase in e-scooter trauma after fleet introductions, which suggests that the United States pattern reflects a general property of device adoption rather than a local anomaly.( 22,23)
Oslo, Helsinki, and several German cities reported steep increases in e-scooter and e-bike emergency presentations after the arrival of shared fleets, with injury severity that closely resembles the present estimates.( 24-26)
The magnitude of the burden is consistent with the federal estimates that anchor this literature. The Consumer Product Safety Commission reported that e-scooter and e-bike injuries together reached tens of thousands of emergency department visits per year by 2021, and the present pooled estimate of more than 700,000 visits across eight years falls within the same order of magnitude while extending the series to 2024.( 4)
The difference in totals between devices is also consistent with recent national comparisons, which find more scooter-related visits than e-bike visits but a faster growth rate for e-bikes.( 2,15)
These correspondences increase confidence that the narrative-based case definition captured the intended population despite the absence of a single consistent product code across the period, and they imply that the annual totals reported here can be interpreted as national burdens rather than as idiosyncratic samples.
Comparability with earlier estimates is limited by differences in case definitions. Earlier estimates used narrative terms alone, product codes alone, or a combination of the two, which produces different point estimates for the same year even when the underlying data are identical.( 2,15)
The present approach of combining narrative and product codes, while excluding non-electric lookalikes, was intended to maximize sensitivity in the early years and specificity throughout, and the close agreement with the Consumer Product Safety Commission figures for overlapping years supports this choice.( 4)
Readers comparing these numbers with single-city or single-year series should account for those definitional differences, which affect the level of each estimate more than the shape of the trend.
The age distributions align with prior work but sharpen the contrast between devices. The clustering of e-scooter injuries in young adults matches single-center and multicenter series that place most injured riders between 18 and 34 years.( 27,28)
The older profile of e-bike riders, with more than one quarter aged 55 years or older, is consistent with national age-specific analyses showing that e-bike injury growth is fastest in middle-aged and older adults.( 6,29)
Sex distributions also agree with the literature, which uniformly reports male predominance for both devices, usually above 60%.( 30,31)
The greater male predominance for e-bikes than for e-scooters is consistent with the demographic composition of e-bike riders described in national samples.(6) The pediatric contribution to e-scooter injuries, at about one fifth of cases, is in line with pediatric emergency series that document a rising share of powered scooter injuries among children and adolescents, and with guidance that frames micromobility injuries as a growing pediatric injury mechanism.(10,32,33) Because many shared platforms set a minimum rider age, this pediatric burden may reflec
t private devices or noncompliance with rental terms, which points to parental supervision and device design as relevant levers in addition to enforcement.
The injury patterns replicate the established signature of micromobility trauma. Fractures accounted for roughly one quarter of cases, close to the proportions reported in European trauma registries and systematic reviews.( 34,35)
Head and neck involvement in about one third of e-scooter injuries is the finding with the clearest prevention implication, and it is consistent with the high prevalence of facial and cranial injuries described in United States and international series.( 9,36,37) Imaging-based studies of computed tomography findings reinforce the point, showing a substantial share of e-scooter crash patients with intracranial or facial fractures even among those without a recorded concussion.( 9)
The elevated proportion of trunk injuries among e-bike riders has also been reported and may reflect different crash kinematics, including greater speed and collisions with motor vehicles.( 38,39)
Concussion and other head injuries from electric biking are rising nationally, which reinforces the interpretation that e-bike crashes are not simply bicycle crashes with a motor.( 8,40)
The similarity in hospital admission between devices, around 11% to 12%, stands out given the different age profiles. Comparable admission proportions have been reported in multicenter e-scooter and bicycle comparisons, although some trauma-center series describe higher rates because they capture only the most severely injured patients.( 35,41)
The finding that e-bike riders are hospitalized at least as often as e-scooter riders, despite being older, supports concerns that e-bike crashes can be high-energy events.( 37,40)
Cost studies add that the burden extends beyond the index visit, with orthopaedic injuries from both devices generating substantial follow-up and surgical care.( 34,42)
Trauma-center comparisons of injury severity add nuance to the present disposition-based picture. Several European registries report higher Injury Severity Scores for e-bike than for e-scooter crashes, driven by craniocerebral and truncal trauma, even though e-scooter series often include more patients overall.( 37,39)
This is compatible with the observation here that admission proportions were similar despite very different age structures, and it suggests that the average e-bike crash may be more energy-intensive than the average e-scooter crash. Severity data are not available in NEISS, which is why this study relied on disposition as a proxy for serious injury, and this proxy probably underestimates the full spectrum of severe outcomes.( 40)
Mechanistic explanations for these patterns are plausible and supported by the literature. E-scooter riders are exposed to small wheels, a standing posture, and forward ejection over the handlebars, which concentrates impact on the face, head, and upper extremities.( 3,43)
E-bike riders travel at higher speeds and share roadways with motor vehicles, which raises the frequency of high-energy and truncal injuries.( 38)
The older age of e-bike riders may also contribute through reduced bone resilience and slower reaction times, mechanisms proposed in age-specific analyses of e-bike trauma.( 29)
Helmet use remains low in both groups, and alcohol involvement is repeatedly documented in e-scooter crashes.( 44,45)
Helmet status can now be extracted from unstructured clinical notes at scale, which offers a route to quantify the protective effect in future surveillance.( 43)
Behavioral factors also differ between the two populations and may shape prevention. Alcohol and nighttime riding are overrepresented in e-scooter injuries, and several cities have responded with nighttime restrictions or speed limits that were followed by measurable reductions in injuries.( 44,45)
E-bike injuries, by contrast, are more often associated with traffic exposure and roadway interactions than with intoxication, which shifts the preventive emphasis toward infrastructure and vehicle design.( 38,40)
These distinctions reinforce the case for keeping the two devices separate in injury surveillance and in safety policy.
Helmet use deserves particular emphasis because head and face injuries were the single largest body-region group. Observational series consistently associate helmet nonuse with more severe cranial and facial injuries in e-scooter crashes, and helmet legislation has been proposed as the most direct lever for reducing that burden.( 9,37) A
t the same time, helmet enforcement is difficult for shared fleets, which may explain why helmet prevalence has remained low despite repeated recommendations.( 44)
The higher trunk injury share in e-bike riders suggests that helmets alone will not address the full injury burden of that device, and that speed management and separation from motor traffic deserve equal attention.( 38,39)
This study has several strengths. It used a nationally representative probability sample with design-based variance, covered the full adoption period through 2024, and applied an explicit, reproducible case definition that handles the 2020 product code change. Several limitations qualify the estimates. Case identification relied partly on free-text narratives, which can misclassify devices with sparse descriptions and probably under-ascertain early cases, a limitation shared with other narrative-based NEISS analyses.( 15)
The sensitivity analysis restricted to narrative text confirmed the direction of the trend but produced lower totals, which indicates that product codes capture cases the narrative alone misses. The 2024 file contained records without assigned sample weights that could not contribute to national estimates, and the estimates therefore understate the most recent year to an unknown degree. NEISS records emergency department visits only and provides no trip or distance denominators, so the estimates measure burden rather than risk per trip, and comparisons between devices cannot be read as comparisons of per-ride risk.( 46)
The data also exclude injuries treated in urgent care or primary care, deaths that occurred without an emergency department visit, and exposures among tourists or visitors whose visits fall outside the sampling frame. Finally, the data contain limited information on helmet use, alcohol, and crash circumstances, which prevents a fuller analysis of causation. Future studies could link these records to exposure data, incorporate helmet and speed information, and validate the case definition against state trauma registries.
The implications are device-specific. For e-scooters, the concentration of injuries in young adults and the head and neck burden argue for helmet promotion, reduced speeds, and continued limits on intoxicated riding.( 44,47)
For e-bikes, the older rider population and the growing fracture burden suggest attention to vehicle stability, roadway infrastructure, and training for riders who may be returning to cycling after a long gap.( 7,21)
These two sets of measures share little beyond their target population, and their success should be judged separately and transparently over time. Emergency physicians and trauma surgeons can contribute by documenting the device type in the medical record and by reinforcing helmet counseling at discharge, which in turn improves the surveillance that these estimates depend on.( 43)
Regulation and infrastructure designed for one device will not automatically serve the other, and surveillance systems that distinguish e-scooters from e-bikes will be needed to evaluate the effect of any intervention.( 46,47)
Taken together, these results extend the national surveillance record to the end of 2024 and show that e-scooters and e-bikes, although often treated as a single micromobility category, generate different injury problems that call for different countermeasures. The estimates provide a national reference against which state and local programs can benchmark their own data, and they identify the age groups and injury types most likely to benefit from intervention in each device population. As adoption of both devices continues, periodic updating of these estimates will indicate whether prevention efforts are keeping pace with the growth in use.
CONCLUSIONS
The national estimates of e-scooter and e-bike injuries treated in United States emergency departments increased sharply between 2017 and 2024, with e-scooters contributing more visits overall and e-bikes growing at a faster relative pace. E-scooter injuries concentrated in young adult men and were dominated by fractures and head and neck injuries. E-bike injuries spread across older age groups and produced a comparable rate of hospital admission. The device-specific age and injury profiles identified here support targeted prevention rather than uniform micromobility policy.
References
- 1 Farley KX, Aizpuru M, Wilson JM, Daly CA, Xerogeanes J, Gottschalk MB, et al. Estimated Incidence of Electric Scooter Injuries in the US From 2014 to 2019. JAMA Netw Open. 2020;3(8):e2014500. doi: 10.1001/jamanetworkopen.2020.14500
- 2 Burford KG, Itzkowitz NG, Rundle AG, DiMaggio C, Mooney SJ. The Burden of Injuries Associated With E-Bikes, Powered Scooters, Hoverboards, and Bicycles in the United States: 2019‒2022. Am J Public Health. 2024;114(12):1365-1374. doi: 10.2105/ajph.2024.307820
- 3 Toofany M, Mohsenian S, Shum LK, Chan H, Brubacher JR. Injury patterns and circumstances associated with electric scooter collisions: a scoping review. Inj Prev. 2021;27(5):490-499. doi: 10.1136/injuryprev-2020-044085
- 4 U.S. Consumer Product Safety Commission. Micromobility Products-Related Deaths, Injuries, and Hazard Patterns: 2017-2021 [Internet]. 2023. Available from: https://www.cpsc.gov/s3fs-public/Micromobility-Products-Related-Deaths-Injuries-and-Hazard-Patterns-2017-2021.pdf
- 5 Fernandez AN, Li KD, Patel HV, Allen IE, Ghaffar U, Hakam N, et al. Injuries With Electric vs Conventional Scooters and Bicycles. JAMA Netw Open. 2024;7(7):e2424131. doi: 10.1001/jamanetworkopen.2024.24131
- 6 Locke AR, Koehne NH, Ramey MD, Corvi JJ, Alley AA, Yendluri A, et al. The rise in electric biking (E-bike) injuries: a 10-year age and sex-specific analysis of national injury data. The Physician and Sportsmedicine. 2025;53(5):345-352. doi: 10.1080/00913847.2025.2470104
- 7 Namiri NK, Locke AR, Koehne NH, Yendluri A, Obana KK, Nietsch K, et al. The Rapid Escalation of Fractures and Hospital Admissions From Electric Bicycle Injuries in the United States: An Analysis of National Injury Data From 2019 to 2023. Journal of Orthopaedic Trauma. 2025;39(5):269-274. doi: 10.1097/bot.0000000000002965
- 8 Koehne NH, Locke AR, Alley AA, Ramey MD, Namiri NK, Dhanjani S, et al. Increasing incidence of concussion and head injury due to electric biking: a 10-year sex- and age-specific analysis of national injury data. The Physician and Sportsmedicine. 2025;53(3):197-202. doi: 10.1080/00913847.2024.2440309
- 9 Kappagantu A, Yaremchuk K, Tam S. Head and Neck Injuries and Electronic Scooter Use in the United States. The Laryngoscope. 2021;131(11):E2784-E2789. doi: 10.1002/lary.29620
- 10 Weiss DL, Law CK, Yendluri A, Zhang DX, Obana KK, Danaher MJ, et al. Rising trends in pediatric fractures associated with electric scooter use seen in emergency departments between 2014 and 2023. The Physician and Sportsmedicine. 2025;53(6):423-429. doi: 10.1080/00913847.2025.2502323
- 11 Shannon B, Ni N, Ehsani J, Friedman LS. Injuries From Electric Bikes and Scooters: Illinois, U.S., 2021–2023. American Journal of Preventive Medicine. 2025;69(6):108065. doi: 10.1016/j.amepre.2025.108065
- 12 Cho NY, Kim S, Tran Z, Hadaya J, Ali K, Kronen E, et al. National Trends and Clinical Outcomes after Scooter Injury in the US: 2016 to 2020. Journal of the American College of Surgeons. 2024;238(3):254-260. doi: 10.1097/xcs.0000000000000918
- 13 U.S. Consumer Product Safety Commission. NEISS Coding Manual, July 2023 [Internet]. 2024 [cited 2026 Oct 28]. Available from: https://www.cpsc.gov/s3fs-public/January-2024-NEISS-CPSC-only-Coding-Manual_0.pdf
- 14 Layered Labs. NEISS Injury Data 2005-2024 [Internet]. 2025. Available from: https://huggingface.co/datasets/Layered-Labs/neiss-injury-data
- 15 Younes H. Comparing injuries from e-scooters, e-bikes, and bicycles in the United States. Journal of Cycling and Micromobility Research. 2025;4:100061. doi: 10.1016/j.jcmr.2025.100061
- 16 English KC, Allen JR, Rix K, Zane DF, Ziebell CM, Brown CVR, et al. The characteristics of dockless electric rental scooter-related injuries in a large U.S. city. Traffic Injury Prevention. 2020;21(7):476-481. doi: 10.1080/15389588.2020.1804059
- 17 Dhillon NK, Juillard C, Barmparas G, Lin TL, Kim DY, Turay D, et al. Electric Scooter Injury in Southern California Trauma Centers. Journal of the American College of Surgeons. 2020;231(1):133-138. doi: 10.1016/j.jamcollsurg.2020.02.047
- 18 Siow MY, Lavoie-Gagne O, Politzer CS, Mitchell BC, Harkin WE, Flores AR, et al. Electric Scooter Orthopaedic Injury Demographics at an Urban Level I Trauma Center. Journal of Orthopaedic Trauma. 2020;34(11):e424-e429. doi: 10.1097/bot.0000000000001803
- 19 Coelho A, Feito P, Corominas L, Sánchez-Soler JF, Pérez-Prieto D, Martínez-Diaz S, et al. Electric Scooter-Related Injuries: A New Epidemic in Orthopedics. JCM. 2021;10(15):3283. doi: 10.3390/jcm10153283
- 20 Jiang SH, Davison-Kerwood M, Gonzalez MH. Increased Rate of Fracture Injuries Associated With Alternative Modes of Transportation During COVID-19. JAAOS Glob Res Rev. 2022;6(9):e22.00147. doi: 10.5435/jaaosglobal-d-22-00147
- 21 Li Y, Chen Q, Ma Q, Yu H, Huang Y, Zhu L, et al. Injuries and risk factors associated with bicycle and electric bike use in China: A systematic review and meta-analysis. Safety Science. 2022;152:105769. doi: 10.1016/j.ssci.2022.105769
- 22 Frank S, Sator T, Kinsky RM, Frank JK, Frank R, Fialka C, et al. Continuously increasing e-scooter accidents and their possible prevention in a large European city. Eur J Trauma Emerg Surg. 2024;50(6):2895-2904. doi: 10.1007/s00068-024-02594-9
- 23 Cevik J, Read D, Putland M, Fazio T, Gumm K, Varma A, et al. The impact of electric scooters in Melbourne: data from a major trauma service. ANZ Journal of Surgery. 2024;94(4):572-579. doi: 10.1111/ans.18814
- 24 Stray AV, Siverts H, Melhuus K, Enger M, Galteland P, Næss I, et al. Characteristics of Electric Scooter and Bicycle Injuries After Introduction of Electric Scooter Rentals in Oslo, Norway. JAMA Netw Open. 2022;5(8):e2226701. doi: 10.1001/jamanetworkopen.2022.26701
- 25 Hartz F, Zehnder P, Resch T, Römmermann G, Hartmann V, Schwarz M, et al. Characteristics of e-scooter and bicycle injuries at a university hospital in a large German city – a one-year analysis. Inj Epidemiol. 2025;12(1):2. doi: 10.1186/s40621-024-00554-w
- 26 Seitakari L, Pakarinen O, Harjola VP, Castrén M, Vasara H. Comparing the characteristics of electric scooter and bicycle injuries: a retrospective cohort study. Sci Rep. 2025;15(1):27599. doi: 10.1038/s41598-025-12627-x
- 27 Lavoie-Gagne O, Siow M, Harkin W, Flores AR, Girard PJ, Schwartz AK, et al. Characterization of electric scooter injuries over 27 months at an urban level 1 trauma center. The American Journal of Emergency Medicine. 2021;45:129-136. doi: 10.1016/j.ajem.2021.02.019
- 28 Moftakhar T, Wanzel M, Vojcsik A, Kralinger F, Mousavi M, Hajdu S, et al. Incidence and severity of electric scooter related injuries after introduction of an urban rental programme in Vienna: a retrospective multicentre study. Arch Orthop Trauma Surg. 2021;141(7):1207-1213. doi: 10.1007/s00402-020-03589-y
- 29 Hamzani Y, Demtriou H, Zelnik A, Cohen N, Drescher MJ, Chaushu G, et al. Age as a Predictive Factor in Severity of Injuries in Riders of Electric Bikes and Powered Scooters: A Retrospective Cross-Sectional Study. Healthcare. 2022;10(9):1689. doi: 10.3390/healthcare10091689
- 30 Bloom MB, Noorzad A, Lin C, Little M, Lee EY, Margulies DR, et al. Standing electric scooter injuries: Impact on a community. The American Journal of Surgery. 2021;221(1):227-232. doi: 10.1016/j.amjsurg.2020.07.020
- 31 Yahya BH, Demetriou H, Zelnik A, Cohen N, Drescher MJ, Chaushu G, et al. Trends in the Incidence and Severity of Injuries Sustained by Riders of Electric Bikes and Powered Scooters: A Retrospective Cross-Sectional Study. Medicina. 2022;58(7):934. doi: 10.3390/medicina58070934
- 32 McGalliard R, Hallam K, Townley S, Messahel S, Durand CL. Two-year paediatric trauma centre analysis of electric scooter injuries. Arch Dis Child. 2022;107(11):1061-1062. doi: 10.1136/archdischild-2022-324213
- 33 Flaherty MR, Rosenfield A, Rosenfield D. Pediatric Injuries Among Those Using Active Transportation & Micromobility Devices. Pediatric Clinics of North America. 2025;72(6):1097-1109. doi: 10.1016/j.pcl.2025.08.001
- 34 Linhart C, Jägerhuber L, Ehrnthaller C, Schrempf J, Kußmaul AC, Neuerburg C, et al. E-scooter accidents—epidemiology and injury patterns: 3-year results from a level 1 trauma center in Germany. Arch Orthop Trauma Surg. 2024;144(4):1621-1626. doi: 10.1007/s00402-024-05209-5
- 35 Benhamed A, Gossiome A, Ndiaye A, Tazarourte K. Characteristics and comparison between e-scooters and bicycle-related trauma: a multicentre cross-sectional analysis of data from a road collision registry. BMC Emerg Med. 2022;22(1):164. doi: 10.1186/s12873-022-00719-0
- 36 Soulakis ND, Shaffer A, Hensing C, Gonzalez-Velez D, Pecoraro N, Peters AA, et al. Characterizing Emergency Department Visits for Product-Related Head Injuries in the United States 2014 to 2024. JACEP Open. 2025;6(6):100256. doi: 10.1016/j.acepjo.2025.100256
- 37 Rauer T, Klingebiel FKL, Lühring A, Küffer A, Hofer AS, Ferrari RM, et al. Cranio-cervical and traumatic brain injury patterns—do they differ between electric bicycle, bicycle, and motorcycle-induced accidents?. Eur J Trauma Emerg Surg. 2024;50(6):3039-3048. doi: 10.1007/s00068-024-02510-1
- 38 Atkinson E, Atkinson T. Injury patterns and safety implications for electric bikes compared to mopeds in the United States. Traffic Injury Prevention. 2025;26(sup1):S132-S140. doi: 10.1080/15389588.2025.2543497
- 39 Anderson A, McLellan M, Tedesco A, Callan K, Grabar C, Joe V, et al. Comparison of Characteristics, Injury Patterns, and Orthopaedic Injuries Between Electric Bicycle, Pedal Bicycle, Electric Scooters, and Motorcycle Accidents at a Level 1 Trauma Center. JAAOS Glob Res Rev. 2025;9(6):e25. doi: 10.5435/jaaosglobal-d-25-00099
- 40 van der Spek WR, Nijveldt RJ, van Helden SH, Spanjersberg WR, Houben PFJ, van der Sluis FJ. E-bikers at risk for severe traumatic brain injury and skull fractures. Injury. 2025;56(5):112306. doi: 10.1016/j.injury.2025.112306
- 41 Gan-El E, Ngatchou Djomo W, Pascu Ciobanu AM, Kaufman L, Ndé Djiélé F, Ulrix M, et al. Risk assessment, consequences, and epidemiology of electric scooter accidents admitted to an emergency department: a prospective observational study. Eur J Trauma Emerg Surg. 2022;48(6):4847-4855. doi: 10.1007/s00068-022-02019-5
- 42 Vasara H, Toppari L, Harjola VP, Virtanen K, Castrén M, Kobylin A. Characteristics and costs of electric scooter injuries in Helsinki: a retrospective cohort study. Scand J Trauma Resusc Emerg Med. 2022;30(1):57. doi: 10.1186/s13049-022-01042-0
- 43 Burford KG, Itzkowitz NG, Ortega AG, Teitler JO, Rundle AG. Use of Generative AI to Identify Helmet Status Among Patients With Micromobility-Related Injuries From Unstructured Clinical Notes. JAMA Netw Open. 2024;7(8):e2425981. doi: 10.1001/jamanetworkopen.2024.25981
- 44 Black KM, Santorelli JE, Costantini TW, Kobayashi LM, Doucet JJ, Haines LN. From Peril to Protection: an evaluation of regulations impacting eScooter injuries. Trauma Surg Acute Care Open. 2025;10(1):e001440. doi: 10.1136/tsaco-2024-001440
- 45 Dibaj S, Vosough S, Kazemzadeh K, O’Hern S, Mladenović MN. An exploration of e-scooter injuries and severity: Impact of restriction policies in Helsinki, Finland. Journal of Safety Research. 2024;91:271-282. doi: 10.1016/j.jsr.2024.09.006
- 46 Pai RR, Dozza M. Is e-cycling safer than e-scootering? Comparing injury risk across Europe when vehicle-type, location, exposure, usage, and ownership are controlled. Journal of Safety Research. 2025;94:469-472. doi: 10.1016/j.jsr.2025.06.015
- 47 Naaseh A, Tohmasi S, Kranker LM, Schuerer DJE. Road Traffic Injury Prevention: Standing Electric Scooters. Curr Trauma Rep. 2024;10(4):47-52. doi: 10.1007/s40719-024-00270-2
Declarations
Funding
No financing
Conflict of interest
None
Authorship contributions
Drafting – original draft: Edixon Chacón Guerrero, Rómulo Esteban Montilla.
Writing–review and editing: Edixon Chacón Guerrero, Rómulo Esteban Montilla.