

Abstract
Introduction: Fare-free public transport has been adopted in more than one hundred cities, yet its effects on ridership, mode shift and equity remain contested. This systematic review synthesized the available evidence. Methods: Following PRISMA 2020, Scopus, OpenAlex and Crossref were searched for studies published between 2013 and 2024. Twenty-five primary studies met the inclusion criteria and were assessed with RoB 2, ROBINS-I, CASP or the Newcastle-Ottawa Scale. Results: Fifteen studies measured ridership: increases ranged from 1.2% (Tallinn) and 7.5% (Stavanger) to 24% (Ningbo) and 75% (seniors, Chicago), with null effects among pupils and older adults in two studies. Eight studies examined mode shift: car-to-transit substitution was modest, and induced trips often replaced walking. Ten studies reported equity outcomes, with benefits for low-income and older users but no change in labour-force participation and negative school-attendance effects. Conclusions: Fare-free public transport reliably increases ridership, mainly by generating new trips and substituting active travel, while the evidence for car mode shift and equity gains is weak and context-dependent.
Keywords
fare-free public transport, public transportation, ridership, mode choice, transportation equity, systematic review
INTRODUCTION
Fares are among the policy instruments most frequently used to steer public transport demand. Meta-analyses of fare elasticities place the average short-run elasticity near -0.38, although reported values range widely, and long-run responses are systematically larger than short-run ones because travellers adjust their habits gradually.( 1)
Estimates derived from smartcard data confirm that the sensitivity of demand to price varies by time of day, by corridor and by user group, and that the response to a fare reduction is generally smaller than the response to a fare increase of the same magnitude.( 2)
The same literature shows that ridership responds more strongly to service quality and to the cost of car use than to fares alone, which implies that abolishing fares entirely is, in economic terms, a second-best instrument for attracting travellers who would otherwise drive.( 3)
These expectations coexist with persistent transport poverty in European and other urban regions, where the price of public transport remains a barrier to mobility for low-income households and where affordability is inseparable from access to jobs and services.( 4)
The theoretical case for free fares rests on the idea that a zero price is behaviourally distinct from a merely low price. Passengers do not simply subtract costs from benefits, and a free service is perceived as carrying a higher benefit than its monetary price would suggest, which implies that abolishing fares could raise demand by more than the usual elasticity estimates predict.( 5)
The case against free fares rests on the same elasticities: because demand responds more to car costs and service quality than to transit fares, the policy may generate trips that replace walking or cycling while leaving car traffic largely unchanged, and it does so at a substantial fiscal cost to the operator.( 6) Both positions are testable against the empirical record, which is the purpose of this review.
Beyond the aggregate demand response, the three outcome domains raise distinct questions. Ridership is the most direct and best measured outcome, because it can be read from passenger counts, and it is the outcome on which the fiscal case for the policy turns. Mode shift from cars is the most demanding test, because it requires a substitution of private motorized trips rather than a transfer of walking or cycling trips, and it is the outcome most relevant to congestion and air quality.( 7)
Equity is the most diffuse, because it spans affordability, access to services and the distribution of the subsidy between users and non-users, and it is the outcome that political advocates invoke most often.( 8) These distinctions structure the synthesis that follows.
Fare-free public transport, understood as the complete abolition of passenger fares, has been tested in more than one hundred cities, most of them in Europe, in forms that range from short promotional campaigns and single free lines to system-wide policies sustained for years.( 8)
The best-known case is Tallinn, which abolished fares for registered residents in 2013, and there is a longer tradition of small and medium-sized systems in France, Poland, Belgium, Germany and the United States.( 5)
The policy is justified in public debate by three claims: that it will raise ridership, that it will shift trips from private cars, and that it will improve equity by removing a financial barrier for the poorest users.( 9)
A related French literature has examined the same question through the lens of road congestion, asking whether free transport can relieve urban automobile pressure.( 7) The motivations behind these schemes differ. In Tallinn the stated goals included modal shift, the mobility of unemployed and low-income residents and an increase in resident registration for municipal tax purposes.( 10)
In many small systems the decision was driven by the small share of operating costs recovered from fares and by a political commitment to mobility as a right, rather than by an ex ante projection of demand effects.( 9) The scope of a scheme also shapes what can be expected of it: a free pass restricted to students or seniors can reach a defined group at modest cost, whereas a universal scheme reorders the entire financing of a network.( 9)
The available evidence has not resolved these claims. Early syntheses concluded that fare abolition increases ridership, often from a low base, but that only a small share of new trips replaces the private car, and that many systems abandoned the policy after operating costs rose.( 9)
Much of this evidence was descriptive, drew on small agencies, or was prepared by the operators themselves, which limits its transferability to larger systems.( 6) Recent geographic and political analyses have mapped the spread of fare-free transport and its dependence on local political dynamics, but they do not systematically extract and compare the empirical effects on the three outcomes that justify the policy.( 8,10)
The absence of a recent systematic synthesis is consequential because the policy continues to spread, and the diffusion documented a decade ago has been followed by renewed debate after the pandemic, when several cities used free fares as a recovery instrument.( 8)
This review addresses that gap. The objective was to synthesize the evidence on the effects of fare-free public transport schemes on ridership, mode shift from private cars and equity outcomes. The specific objectives were to quantify the direction and magnitude of reported ridership changes after the introduction of fare-free schemes, to describe the reported evidence on mode shift from cars toward public transport, and to characterize the reported equity outcomes across population groups.
METHODS
The review followed the PRISMA 2020 statement.( 11) A protocol specifying the objectives, eligibility criteria, search strategy and synthesis plan was prepared before the searches but was not registered in a public repository, and no amendment to the protocol was required during the review.
Studies were eligible if they evaluated a fare-free public transport intervention and reported at least one empirical outcome. The population comprised users of urban or regional public transport systems of any country, including general populations and specific groups such as older adults, students, employees or tourists.
The intervention was the complete abolition of passenger fares, either for an entire system or for a defined user group, including concessionary free travel; schemes that merely reduced a still-positive fare were excluded. The comparison was the previous fare-based arrangement, a control area or a control group without free travel. The outcomes were ridership or public transport use, mode shift from private cars, and equity, defined as distributional effects by income, age, gender or ethnicity, or as access, social participation, employment or education outcomes.
Eligible designs were randomized trials, quasi-experimental and observational studies, before-after evaluations, cross-sectional surveys and qualitative studies with empirical findings. Secondary reviews, simulations without observed outcomes, methodological papers without outcome data and commentary were excluded. The publication window was 2013 to 2024: the lower bound coincides with the first full year of the Tallinn scheme, the first full-scale modern case, and the upper bound follows the review specification. Only studies with an English title and abstract were considered.
Scopus was searched first because it indexes the transport journals in which most of this literature appears, followed by OpenAlex and Crossref for coverage of open-access and repository records. Semantic Scholar was used to retrieve the abstracts of records whose abstracts were not available from the three primary databases. The searches were restricted to records published between 2013 and 2024.
The primary Scopus query combined intervention terms with the publication window: TITLE-ABS-KEY("fare-free" OR "fare free" OR "zero-fare" OR "zero fare" OR "free public transport" OR "free public transit") AND PUBYEAR > 2012 AND PUBYEAR < 2025. Three further queries crossed the intervention terms with outcome terms. One query combined the intervention terms with ridership and patronage: TITLE-ABS-KEY("free public transport" OR "free public transit" OR "fare-free") AND TITLE-ABS-KEY(ridership OR patronage) AND PUBYEAR > 2012 AND PUBYEAR < 2025.
A second combined them with mode shift terms: TITLE-ABS-KEY("fare-free" OR "free public transport") AND TITLE-ABS-KEY("mode shift" OR "modal shift" OR "mode choice" OR car) AND PUBYEAR > 2012 AND PUBYEAR < 2025. A third combined free transit and free bus with effect terms: TITLE-ABS-KEY("free transit" OR "free bus") AND TITLE-ABS-KEY(ridership OR effect OR impact) AND PUBYEAR > 2012 AND PUBYEAR < 2025.
Two support queries addressed fare policy and transport equity for context in the Introduction and Discussion: TITLE-ABS-KEY(public transport AND ("fare policy" OR "fare reform" OR pricing) AND ridership) and TITLE-ABS-KEY("transport equity" OR "transit equity" OR "transport justice") AND TITLE-ABS-KEY(fare OR affordability), each restricted to the same window. The same intervention and outcome terms were translated to the query syntax of OpenAlex and Crossref.
Records were deduplicated within and across databases and screened in two stages. In the first stage, titles and abstracts were screened against the eligibility criteria, and records that clearly did not concern fare-free public transport were excluded. In the second stage, the full text or the full abstract of the remaining records was retrieved, and eligibility was decided with coded reasons, namely secondary study, modelling study without observed outcomes, methodological paper, insufficient outcome data or publication outside the review window.
Risk of bias was assessed with the tool appropriate to each design: RoB 2 for the randomized trial,( 12) ROBINS-I for non-randomized quantitative studies,( 13) the Newcastle-Ottawa Scale for cross-sectional studies( 14) and the CASP qualitative checklist for qualitative studies.( 15)
RoB 2 assessed bias arising from the randomization process, deviations from intended interventions, missing outcome data, outcome measurement and selective reporting. ROBINS-I assessed confounding, selection, classification of interventions, deviations, missing data, measurement of outcomes and selection of the reported result. Each study was rated as low, moderate or serious risk of bias, and a low rating was never assigned solely because information was missing.
Outcomes were heterogeneous in design, measure and setting, so a meta-analysis was not appropriate. Findings were synthesized narratively by outcome domain, and within each domain by the direction of the finding, so that the number of studies supporting each conclusion could be counted. Findings were not pooled because the outcome measures were not commensurable across designs.
RESULTS
Study selection
The searches identified 347 records from four databases, of which 104 were duplicates. Of the 243 records screened by title and abstract, 211 were excluded because the intervention or the outcome fell outside the scope of the review. Thirty-two reports were sought for retrieval, 2 could not be retrieved, and 30 were assessed for eligibility (Figure 1).
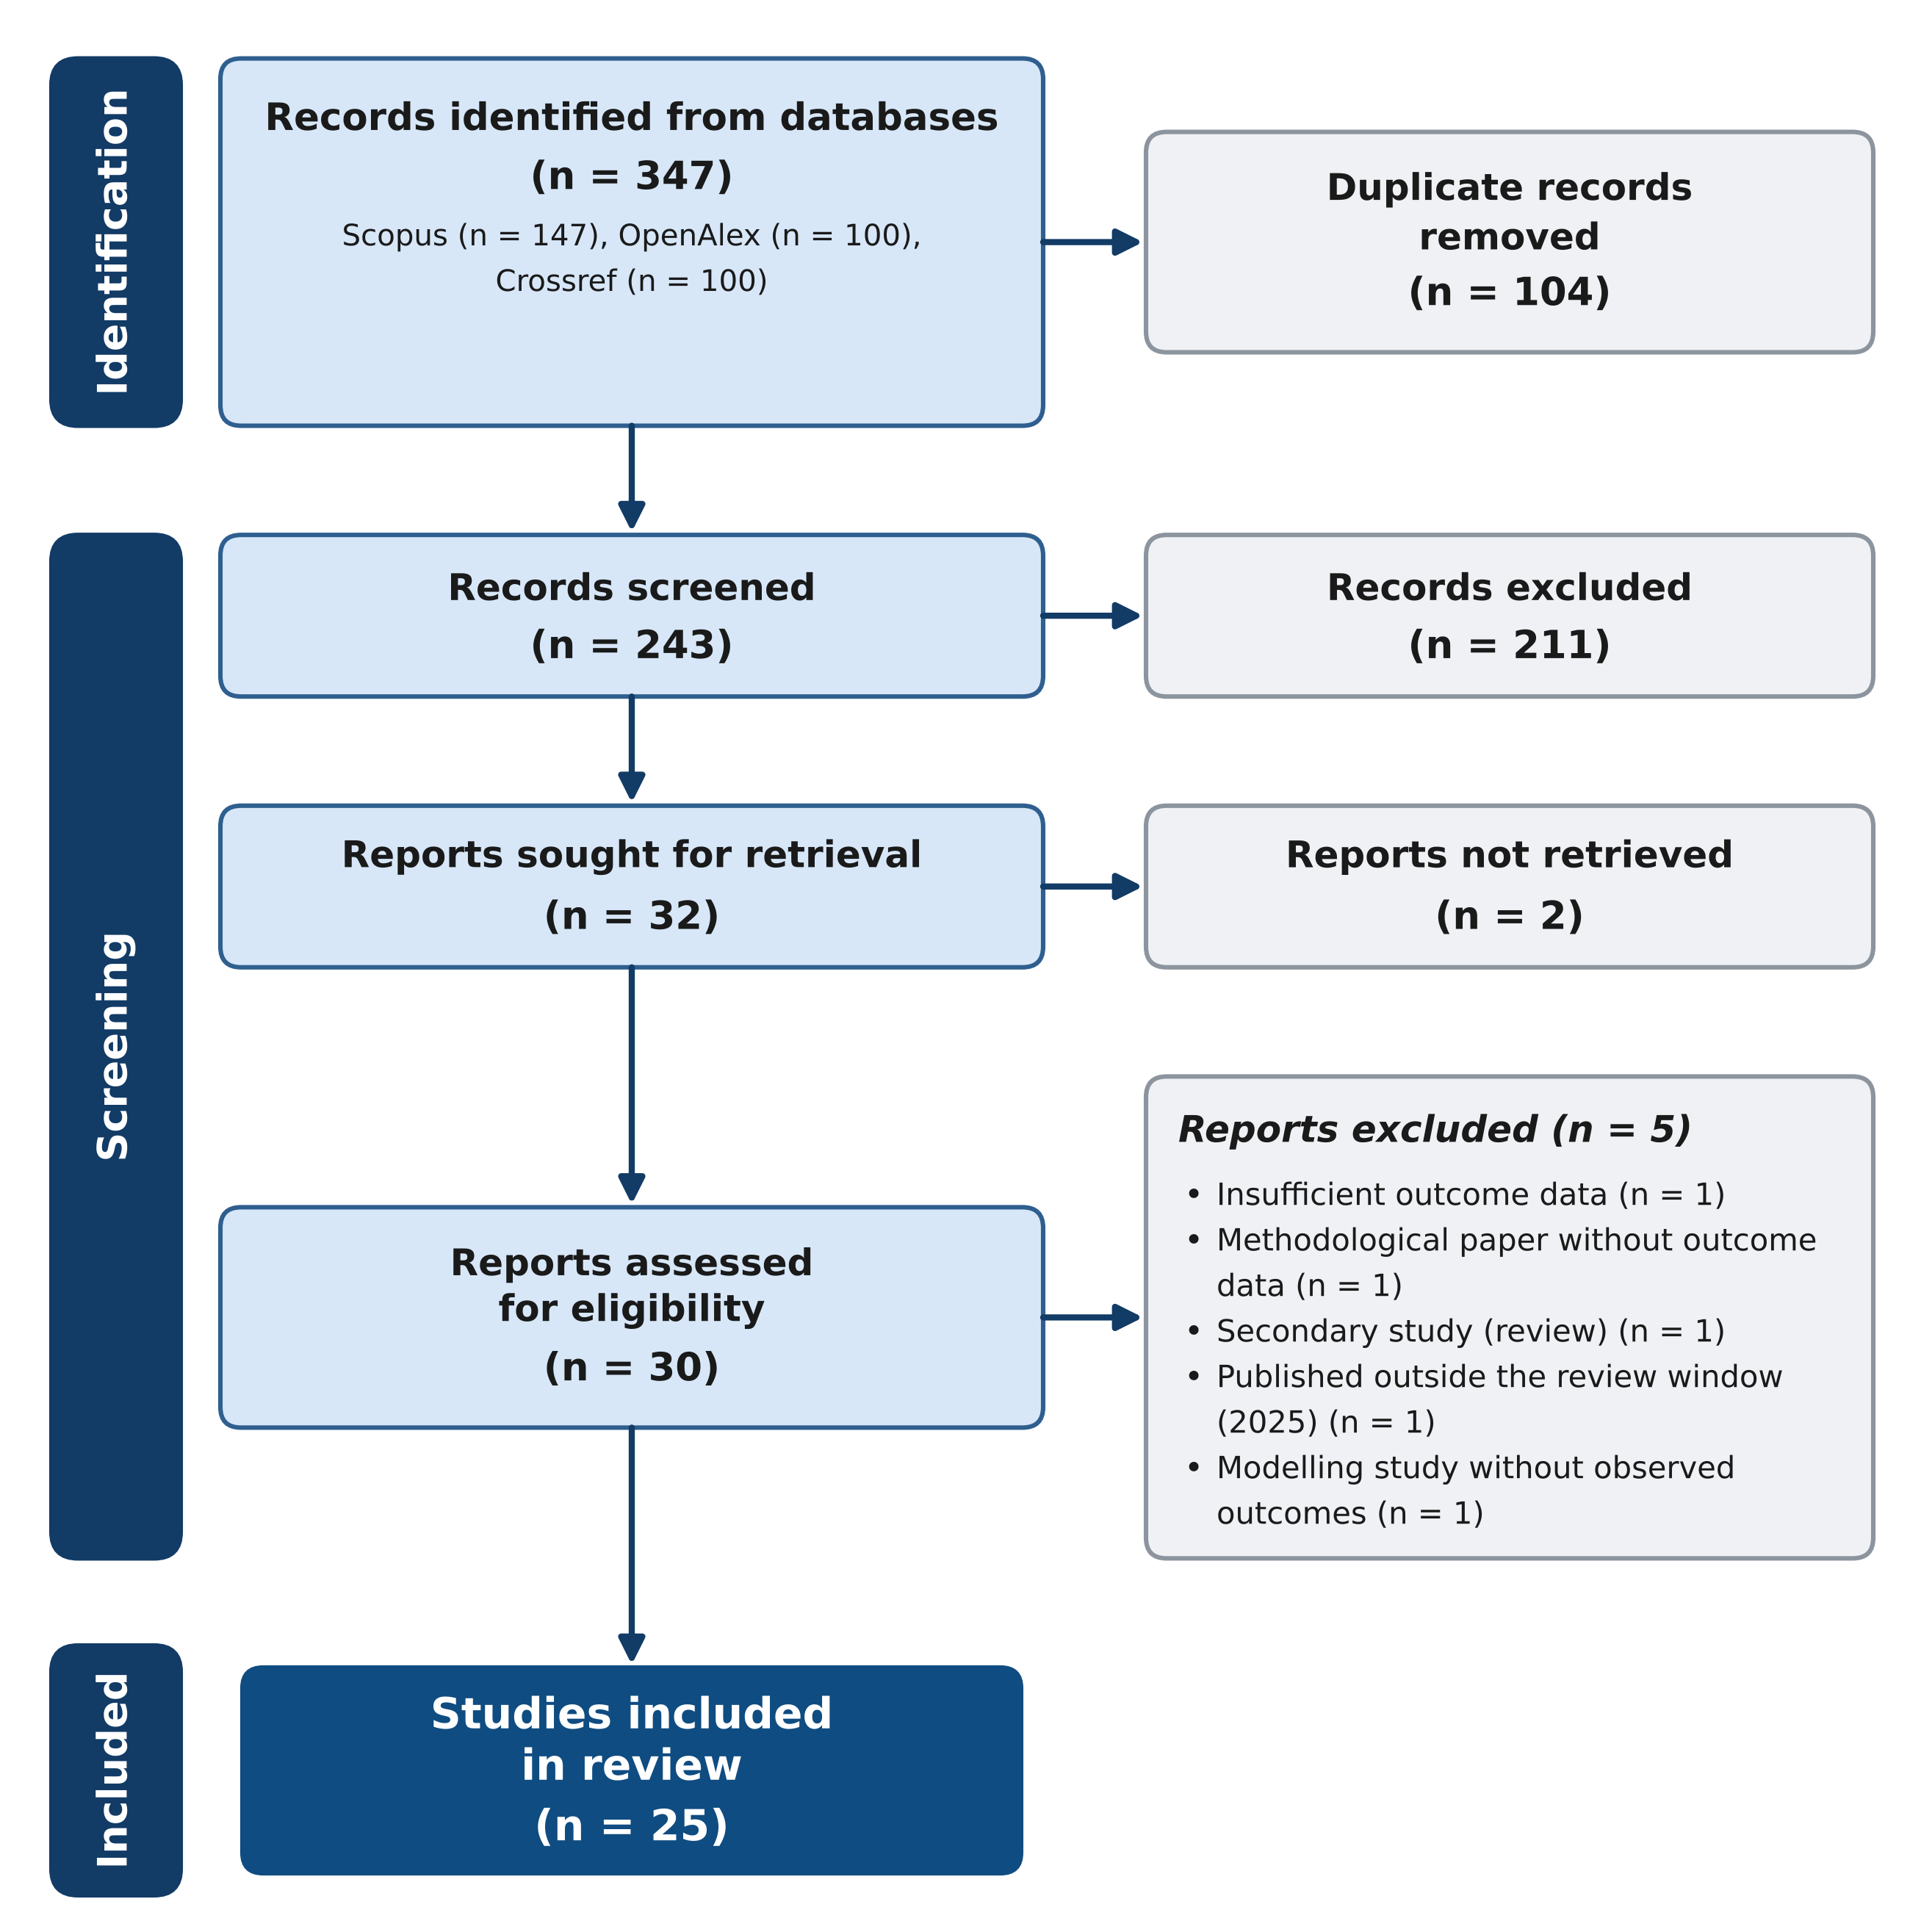
Figure 1. PRISMA 2020 flow diagram of study selection.
Five reports were excluded at this stage: one secondary review, one modelling study without observed outcomes, one methodological paper without outcome data, one study with insufficient outcome data and one study published after the review window. Scopus contributed 147 records, OpenAlex 100 and Crossref 100 before deduplication, and no additional records were identified through reference-list screening because a supplementary hand search was not part of the protocol. A total of 25 studies were included.
Study characteristics
Of the 25 included studies, 15 measured ridership or public transport use, 8 examined mode shift from private cars and 10 reported equity or distributional outcomes, and some contributed to more than one domain. The studies covered Europe, North America, Asia, Oceania and South America (Table 1).
Study | Country | Design | Population | Main finding | RoB |
|---|---|---|---|---|---|
Blättler et al., 2024(33) | Switzerland | Quasi-experimental survey | Overnight guests | Car-to-transit shift of 14.8 and 11.6 percentage points | Moderate |
Sträuli, 2024(25) | Estonia | Qualitative | Transport-dependent users | Documents care mobilities and equity limits of fare-free transport | Moderate |
Ofosu-Kwabe et al., 2024(34) | United States | Panel regression | Urban areas | Ridership increases; no labour-force or income-equality effect | Moderate |
Gregersen et al., 2024(28) | Norway | DiD, passenger counts | Residents of Stavanger | Boardings up 7.5% relative to control | Low |
Alousi-Jones and El-Geneidy, 2024(24) | Canada | Longitudinal survey | Older adults | No change in transit use; convenience improved | Serious |
Liu et al., 2023(35) | China | Two-wave survey, PSM | Tourists | Multimodality up; no bus share change; shift to informal transport | Moderate |
Rambaldini-Gooding et al., 2023(36) | Australia | Ethnography | Older adults | Free bus as caring place supporting well-being | Moderate |
Grzelec et al., 2023(37) | Poland | Before-after survey | Pupils | No effect on demand or travel behaviour | Serious |
Munoz et al., 2022(31) | United States | Synthetic control | K-12 students | Negative effects on attendance and absenteeism | Moderate |
Zeiske et al., 2021(32) | Netherlands | Field study | Commuters | Strong short-term intentions, weaker long-term | Serious |
Shin, 2021(23) | South Korea | RD | Older adults | More subway trips; vehicle ownership falls | Low |
Dai et al., 2021(30) | China | Synthetic control | Subway users | Null in Hangzhou; 24% in Ningbo; 2.3-fold in Xiamen | Moderate |
Cats, Susilo and Reimal, 2017(17) | Estonia | Before-after survey | Residents of Tallinn | Transit use up 14%; walking trips down; car share down | Serious |
Metaxatos, 2013(19) | United States | Before-after analysis | Seniors | Senior rides up about 75% | Serious |
Busch-Geertsema et al., 2021(38) | Germany | Two-wave survey | State employees | Transit commuting up; car use largely unchanged | Serious |
Gabaldón-Estevan et al., 2019(18) | Estonia | Qualitative | Stakeholders | Political interlinking shapes success and stability | Moderate |
Friman et al., 2019(26) | Sweden | Intervention survey | Residents | Transit use up; minor car reduction | Serious |
Cats, Reimal and Susilo, 2014(16) | Estonia | Macro evaluation | Transit users | Demand up 3%; 1.2 points attributed to fares | Moderate |
Wexler et al., 2021(29) | United States | DiD, fixed effects | High school students | Excused absences down 11.5% and 27.5% | Moderate |
Zhang et al., 2019(20) | China | Survey, nested logit | Older adults | Describes elderly travel under free bus programme | Serious |
Patterson et al., 2018(21) | England | Cross-sectional | Older adults | Black users hold passes most and gain most active travel | Serious |
Reinhard et al., 2018(22) | England | IV | Older adults | Transit use up 8%; depression and loneliness fall | Moderate |
Bull, Muñoz and Silva, 2020(27) | Chile | RCT | Workers | Overall travel up 12%; off-peak transit trips up 28% | Low |
Štraub, 2020(39) | Czechia | Surveys, interviews | Residents | Transit use up; requires complementary measures | Serious |
Inturri et al., 2020(40) | Italy | Case study survey | Students | Large reported impact on student behaviour | Serious |
Note: RoB = risk of bias. DiD = difference-in-differences; RD = regression discontinuity; RCT = randomized controlled trial; PSM = propensity score matching; IV = instrumental variables.
The largest single concentration was in Estonia, where three studies evaluated the Tallinn scheme,( 16-18) and a second cluster addressed free travel for older adults in England, South Korea, Canada, Australia, China and the United States.( 19-24)
The publication years spanned the whole window, from 2013 to 2024. By region, fourteen studies were conducted in Europe, five in North America, four in Asia, one in South America and one in Oceania, and no study examined a system in Africa. Reported sample sizes ranged from 22 interviewed users( 25) and 190 trial participants( 26) to 1,511 surveyed residents in Tallinn( 17) and 33,344 participants in the English National Travel Survey.( 21)
Twelve studies used quasi-experimental or controlled designs, including one randomized trial,( 27) difference-in-differences,( 28,29) regression discontinuity,( 23) synthetic control( 30,31) and instrumental variables.( 22)
Thirteen studies relied on before-after surveys, cross-sectional surveys or qualitative interviews without a control group. The schemes evaluated ranged from a two-week free pass in a randomized trial( 27) and a one-month free trial( 26) to the system-wide Tallinn policy maintained for years.( 17)
Most interventions were introduced as permanent entitlements for a specific group, whereas temporary schemes in Norway, the Netherlands and Sweden tested behavioural responses over a bounded period.( 26,28,32)
Risk of bias
Three studies were rated at low risk of bias: the randomized trial,( 27) the difference-in-differences evaluation with automatic passenger counts( 28) and the regression discontinuity study (Table 2).( 23)
Eleven studies were rated at moderate risk of bias, of which eight used quasi-experimental quantitative designs that adjusted for some but not all sources of confounding and three were qualitative studies assessed with the CASP checklist. Eleven studies were rated at serious risk of bias, mostly because they relied on before-after surveys without a control group or on cross-sectional self-report. No study was rated at critical risk. The main threats across the body of evidence were confounding from concurrent service changes, self-selection into free travel and reliance on stated intentions rather than observed behaviour.
Tool | Studies (n) | Low | Moderate | Serious |
|---|---|---|---|---|
RoB 2 | 1 | 1 | 0 | 0 |
ROBINS-I | 10 | 2 | 8 | 0 |
NOS | 1 | 0 | 0 | 1 |
CASP | 3 | 0 | 3 | 0 |
JBI | 10 | 0 | 0 | 10 |
Total | 25 | 3 | 11 | 11 |
Note: RoB 2 for randomized trials; ROBINS-I for non-randomized quantitative studies; NOS = Newcastle-Ottawa Scale; CASP for qualitative studies; JBI for descriptive surveys.
Ridership and public transport use
Of the 15 studies that measured ridership or public transport use, 11 reported an increase after the introduction of free travel. The flagship Tallinn evaluation found that public transport use rose by 14% and that the modal share of public transport increased from 55% to 63% almost one year after fares were abolished.( 17)
An earlier macro evaluation of the same scheme reported a smaller short-run increase of 3%, of which only 1.2 percentage points were attributed to fare abolition after controlling for concurrent service changes.( 16)
In Stavanger, a difference-in-differences design with automatic passenger counts estimated a 7.5% increase in daily boardings relative to the rest of the county.( 28) In a randomized trial in Santiago, a free pass raised overall travel by 12% and increased off-peak public transport trips by 28%.( 27)
A panel analysis of United States urban areas found that fare-free transit significantly increased ridership.( 34) In China, three post-pandemic policies produced mixed results: no significant change in Hangzhou, a 24% first-month increase in Ningbo and a 2.3-fold increase over five rest days in Xiamen.( 30)
In Tallinn the increase was uneven across groups: the public transport share of the 15 to 19 and 60 to 74 age groups and of very low-income residents rose by 21, 19 and 26 percentage points respectively, while the share of the highest-income group fell by 21 points.( 17) In smaller European systems, surveys reported increased public transport use in Frýdek-Místek and among students in Catania,( 39,40) and a one-month free trial in Sweden increased use with only a minor reduction in car use.( 26)
In 4 of the 15 ridership studies, the effect was null, negative or costly. Free fares produced no measurable change in demand or travel behaviour among pupils in Gdynia( 37) and no change in transit use among older adults in Montreal, where only perceived convenience improved.( 24) A free bus programme for older people in Beijing described welfare benefits without establishing a ridership increase.( 20)
Among seniors in Chicago, free rides attracted approximately 75% more senior trips, but at a direct cost of between 26.1 and 78.6 million United States dollars, which led the legislature to convert the programme into a means-tested one.( 19)
Mode shift from cars
Of the 8 studies that examined mode shift from private cars, 5 found only modest or partial substitution of car travel. The Tallinn survey found that the modal share of car trips fell while walking trips declined far more sharply, by 40%, which suggests that fare abolition absorbed walking trips at least as much as car trips.( 17)
A free ticket for German state employees increased public transport commuting substantially but left car use and availability largely unchanged.( 38) A one-month free transport trial in Sweden increased public transport use with only a minor reduction in car use.( 26)
Among commuters given a three-week free card in the Netherlands, intentions to use public transport were strong while the incentive was active but faded afterwards.( 32) The pattern of induced off-peak travel in the Santiago trial, where two-thirds of the new trips fell outside the peak, is consistent with the view that free fares generate travel previously suppressed by price rather than travel previously made by car.( 27)
In 3 of the 8 studies, the shift from cars was more clearly identified but remained context-specific. A fare-free offer for Swiss overnight guests produced a car-to-transit shift of 14.8 and 11.6 percentage points in two settings.( 33)
A regression discontinuity design in Seoul found that free subway eligibility increased subway trips, replaced some auto trips and significantly reduced household vehicle ownership among older adults.( 23)
A fare-free tourist bus in China increased multimodality but did not change the modal share of the free buses themselves, shifting travellers instead from taxis toward informal transport provided by local residents.( 35)
The Seoul result is notable because the reduction in vehicle ownership points to a longer-run substitution mechanism rather than a transient response.( 23)
Equity outcomes
Of the 10 studies that reported equity or distributional outcomes, 5 found gains for disadvantaged groups. The Tallinn evaluation found that the mobility of low-income and unemployed residents improved, that their public transport share rose by more than 20%, and that the share of residents making no trip at all fell from 18% to 13%, although employment prospects did not improve.( 17)
In England, eligibility for a free bus pass was associated with an 8% increase in public transport use and with reductions in depressive symptoms and loneliness and with more volunteering and social contact among older people.( 22)
Black older adults in England were more likely than White or South Asian older adults to hold a free bus pass and accumulated a larger share of their active travel through bus journeys.( 21)
In England the pass was associated with a 0.952-point reduction in depressive symptoms on the CES-D scale and with increased odds of volunteering and of regular contact with children and friends, alongside the 8% increase in public transport use.( 22)
Qualitative studies in Tallinn and in Wollongong described fare-free transport as a support for the daily care mobilities and the social well-being of transport-dependent and older users.( 25,36)
In 5 of the 10 equity studies, the distributional effects were absent, mixed or adverse. A panel analysis of United States cities found that fare-free transit did not increase labour-force participation or reduce income inequality.( 34)
Two evaluations of free student transit found negative effects on school attendance and chronic absenteeism in Florida,( 31) whereas a Minneapolis programme reduced excused absences by 11.5% and 27.5%.( 29)
In China, the perceived accessibility and equity gains of a free tourist bus depended on informal transport rather than on the free bus itself.(35) In Tallinn, interviews linked the stability of the scheme to the interlinking of local and national politics rather than to measurable social outcomes.(18)
Trip generation, substitution and satisfaction
The Tallinn surveys allowed a decomposition of the ridership increase into its sources. The average number of trips per person remained almost unchanged between 2012 and 2013, at 1.98 and 1.96 respectively, which indicates that the growth in public transport trips came mainly from substitution among modes rather than from a general rise in trip-making.( 17)
Car ownership fell from 0.307 to 0.273 cars per respondent, and the share of residents who stayed at home without making any trip fell from 18% to 13%, a change interpreted as a trip-generation effect among low-income and non-employed residents.( 17)
Satisfaction with public transport rose from 3.20 to 3.35 on a five-point scale, and the share of respondents who viewed the service as poor or very poor fell from 12.0% to 5.4%.( 17)
The earlier macro evaluation found that average passenger trip length decreased by 10%, consistent with a substitution of short walking trips by public transport.( 16)
Among travellers who increased their public transport use, 45% did so within the first week of the policy and a further 28% within the first month, which indicates that the response was rapid.( 17)
DISCUSSION
Of the 25 studies reviewed, the clearest and most consistent finding is that fare-free public transport increases ridership, while the evidence for a large shift from private cars and for distributional equity gains is weaker and more context-dependent. This conclusion holds when restricted to the three low-risk studies, which reported a 7.5% increase in boardings, a 12% rise in overall travel and a reduction in household vehicle ownership, but no evidence of a mass migration from cars.( 23,27,28)
The pattern therefore supports the economic expectation that zero fares stimulate demand mainly through new trips and through substitution from walking and cycling, not from the automobile.
By outcome, the level of evidence differs. For ridership the evidence is moderate: 11 of the 15 relevant studies reported increases, and the effect survived in two low-risk designs, although its size varied with the baseline. For mode shift the evidence is low to moderate: substitution from cars was identified in only 3 of the 8 relevant studies and was absent in the flagship Tallinn case once the concurrent fall in walking was taken into account.( 17)
For equity the evidence is low: the positive findings come mostly from observational and qualitative designs, the two strongest quantitative designs found null distributional effects, and one controlled study found an adverse effect.( 31,34) The consistency between studies is highest for ridership, where findings agree in direction even when they disagree in magnitude, and lowest for equity, where the direction of the effect depends on the group and on the design of the concession.( 41)
A behavioural reading of these results is that the zero price operates as a signal as much as a subsidy. The rapid first-week response in Tallinn and the strong short-term intentions in the Dutch field study suggest that free fares prompt immediate experimentation, while the fading intentions after the incentive is removed indicate that habit formation requires more than a temporary price cut.( 17,32)
The policy therefore appears to lower the threshold for trying public transport, but it does not by itself convert new riders into a durable shift away from the car.
The ridership findings are consistent with the earlier descriptive literature. Reviews of United States and European systems had already reported increases of 20% to 60% in small agencies and of 25% to 50% in the broader evidence base, with the caveat that many systems started from a low ridership base and expanded service at the same time.( 5,9)
The Tallinn estimate of 14%, and the smaller 1.2% effect isolated after controlling for service changes, are consistent with that literature once the high pre-existing transit share and the low pre-existing fares are taken into account.( 17)
The null results for pupils in Gdynia and for older adults in Montreal caution against treating these increases as universal, because the demand response depends on the group targeted and on whether a real financial barrier existed before the policy.( 24,37)
The mode shift evidence is the least favourable to the policy. Most included studies found that car use changed little, which aligns with the long-standing result that fares are a weaker lever on car use than service quality or car pricing.( 6)
The Brussels experience, in which free transport for students generated new trips mostly from walking and cycling, anticipated the same conclusion two decades earlier.( 3)
The Swiss tourist finding and the Seoul result show that car substitution can occur when the intervention removes a genuine cost and operates in a context of constrained parking or vehicle ownership, but these conditions are not present in every scheme.( 23,33)
A review of free transport and road congestion reached a comparable verdict, concluding that the automobile benefits of free transit are modest at best.( 7)
Compared with previous reviews, the present synthesis sharpens rather than overturns their conclusions. Narrative accounts emphasised the political appeal and the spread of fare-free transport but treated the outcome evidence as anecdotal.( 8,9)
The geographic and economic literature likewise warned that fare abolition was unlikely to deliver a large modal shift.( 5,6)
The contribution of this review is to attach counts and ratings to those claims: it shows that the ridership effect is real but modest once service changes are controlled, and that the equity effects are conditional on the design of the concession rather than intrinsic to the zero price.( 41,42)
The equity evidence is genuinely mixed. The English free bus pass is the most encouraging case, with quasi-experimental evidence that eligibility increased public transport use and reduced depressive symptoms and loneliness, and with larger uptake among Black older adults.( 21,22)
The Tallinn and Wollongong studies add qualitative support for the idea that fare abolition helps transport-dependent users.( 17,36)
Against this, the United States panel study found no effect on labour-force participation or income inequality, and the Florida student programme worsened attendance, which suggests that free fares can produce unintended behavioural consequences when they are not tied to a specific transport need.( 31,34)
Comparisons with related fare policies reinforce the point that the design of the concession, not the zero price itself, determines who benefits: flat and variable fare structures redistribute differently in Los Angeles,( 43) a metro fare increase in Beijing worsened equity for low-income commuters,( 44) a fare reform in Barcelona produced uneven distributional effects across the metropolitan region,( 42) and affordability remains the binding constraint for older people in Santiago.( 45)
Smartcard evidence on the equity of transport costs before and after a fare reform likewise shows that the distributional outcome depends on the structure of the concession rather than on its headline generosity.( 41)
Means-tested subsidies for low-income users, in contrast to universal free fares, have produced measurable increases in public transport use among the target group in an experimental setting.( 46)
Heterogeneity across studies arises from four sources. First, schemes differ in scope, from system-wide abolition in Tallinn to free travel for single groups such as students or seniors. Second, baseline conditions differ, because systems with high existing transit shares and low fares have little room to grow, whereas small systems show large percentage gains from a low base.( 9)
Third, outcome measurement differs, with automatic counts, household diaries and self-reported intentions capturing different stages of behavioural change.( 28,32)
Fourth, the policy often arrives together with service expansion, which makes the isolated fare effect small, as the Tallinn decomposition showed.( 16)
The randomized and quasi-experimental studies tend to report smaller and more precise effects than the before-after surveys, which is itself a warning against reading the larger percentage gains of the descriptive literature at face value.( 27,28)
These sources of heterogeneity, rather than any single effect size, explain why reported ridership changes range from null to 75%.
The applicability of these findings varies with context. The estimates transfer most directly to small and medium European systems with low baseline fares and high subsidy levels, the conditions that characterised the Tallinn and Polish cases.( 17,37)
They transfer least directly to large car-dependent metropolitan areas, where fares represent a small share of the generalized cost of car travel and the modal share of public transport is low, and to low-income countries, where informal transport often performs the functions that formal fare-free services would.( 8,35)
None of the included studies evaluated a universal scheme in a low-income country, which is a notable gap in the body of evidence.
A further consideration is the distributional character of the subsidy. Because fares are regressive relative to income, abolishing them benefits existing riders in proportion to their use, which can favour higher-income users unless eligibility is restricted; the Tallinn result, in which the highest-income group reduced its public transport share while the lowest-income groups increased theirs, shows that this need not happen in practice, but it is not guaranteed.( 17,42)
The means-tested alternative targets the benefit at those who face a genuine financial barrier and has experimental support.( 46) The choice between universal and targeted fare abolition is therefore not a technical detail but the main lever through which the equity objective is achieved.
Practice implications
For practice, the review suggests that fare-free transport should be adopted with realistic expectations about its effects. It is a reliable instrument for growing ridership and for improving the mobility of low-income and older users, but it is not an efficient instrument for cutting car traffic, and universal schemes risk subsidising trips that would have been made anyway. For policy design, the English and Chilean results indicate that targeting free travel at a specific population, and pairing it with complementary measures such as parking restraint or service improvement, delivers clearer benefits than a blanket abolition of fares.( 22,46)
On equity, the contrast between the universal English pass, which produced measurable social gains, and the unrestricted student programmes, which produced perverse attendance effects, points toward targeted design as the decisive factor.( 22,31)
For research, the field needs more controlled designs that isolate the fare effect from concurrent service changes and that report equity outcomes by income and by mode, because these are the questions on which the policy debate ultimately turns.( 27,28)
The fiscal dimension is inseparable from the ridership result: the Chicago and Tallinn cases show that free fares can be financed only through taxation or other revenue streams, and that the political and fiscal sustainability of the scheme depends on these arrangements.( 18,19)
The Tallinn case illustrates a financing path that is not available elsewhere: the scheme was partly underwritten by roughly 11,000 newly registered residents whose municipal income-tax contributions approximately replaced the lost fare revenue.( 17)
CONCLUSIONS
Fare-free public transport increases ridership in most of the schemes studied, with reported increases concentrated between 1.2% and 24% and with larger percentage gains in small or low-base systems, although this demand growth comes largely from new trips and from substitution of walking rather than from cars. The evidence for mode shift from private cars is weak, because car use changed little in most studies and only partial substitution was identified where fares removed a genuine cost. The evidence on equity is mixed, with benefits for low-income, older and transport-dependent users in some settings and no distributional gains or even adverse effects in others.
References
- 1 Guzman LA, Beltran C, Bonilla JA, Gomez Cardona S. BRT fare elasticities from smartcard data: Spatial and time-of-the-day differences. Transportation Research Part A: Policy and Practice. 2021;150:335-348. doi: 10.1016/j.tra.2021.06.018
- 2 Davis LW. Estimating the price elasticity of demand for subways: Evidence from Mexico. Regional Science and Urban Economics. 2021;87:103651. doi: 10.1016/j.regsciurbeco.2021.103651
- 3 De Witte A, Macharis C, Lannoy P, Polain C, Steenberghen T, Van de Walle S. The impact of “free” public transport: The case of Brussels. Transportation Research Part A: Policy and Practice. 2006;40(8):671-689. doi: 10.1016/j.tra.2005.12.008
- 4 Mattioli G. Transport poverty and car dependence: A European perspective. In: Advances in Transport Policy and Planning. Elsevier; 2021. p. 101-133. doi: 10.1016/bs.atpp.2021.06.004
- 5 Fearnley N. Free Fares Policies: Impact on Public Transport Mode Share and Other Transport Policy Goals. IJT. 2013;1(1):75-90. doi: 10.14257/ijt.2013.1.1.05
- 6 Storchmann K. Externalities by Automobiles and Fare-Free Transit in Germany — A Paradigm Shift?. JPT. 2003;6(4):89-105. doi: 10.5038/2375-0901.6.4.5
- 7 David Q. Gratuité des transports en commun et congestion routière : revue de la littérature et implications pour Paris. Revue d'économie politique. 2022;Vol. 132(3):421-452. doi: 10.3917/redp.323.0421
- 8 Kębłowski W. Why (not) abolish fares? Exploring the global geography of fare-free public transport. Transportation. 2020;47(6):2807-2835. doi: 10.1007/s11116-019-09986-6
- 9 Volinski J, Transit Cooperative Research Program, Transportation Research Board, National Academies of Sciences, Engineering, and Medicine. Implementation and Outcomes of Fare-Free Transit Systems. . 2012. doi: 10.17226/22753
- 10 Kȩbłowski W, Tuvikene T, Pikner T, Jauhiainen JS. Towards an urban political geography of transport: Unpacking the political and scalar dynamics of fare-free public transport in Tallinn, Estonia. Environment and Planning C: Politics and Space. 2019;37(6):967-984. doi: 10.1177/2399654418821107
- 11 Page MJ, McKenzie JE, Bossuyt PM, Boutron I, Hoffmann TC, Mulrow CD, et al. The PRISMA 2020 statement: an updated guideline for reporting systematic reviews. BMJ. 2021:n71. doi: 10.1136/bmj.n71
- 12 Sterne JAC, Savović J, Page MJ, Elbers RG, Blencowe NS, Boutron I, et al. RoB 2: a revised tool for assessing risk of bias in randomised trials. BMJ. 2019:l4898. doi: 10.1136/bmj.l4898
- 13 Sterne JA, Hernán MA, Reeves BC, Savović J, Berkman ND, Viswanathan M, et al. ROBINS-I: a tool for assessing risk of bias in non-randomised studies of interventions. BMJ. 2016:i4919. doi: 10.1136/bmj.i4919
- 14 Wells GA, Shea B, OConnell D, Peterson J, Welch V, Losos M, Tugwell P. The Newcastle-Ottawa Scale (NOS) for assessing the quality of nonrandomised studies in meta-analyses [Internet]. 2014. Available from: https://www.ohri.ca/programs/clinical_epidemiology/oxford.asp
- 15 Critical Appraisal Skills Programme. Critical Appraisal Skills Programme (CASP) checklists [Internet]. 2020. Available from: https://casp-uk.net/casp-tools-checklists/
- 16 Cats O, Reimal T, Susilo Y. Public Transport Pricing Policy. Transportation Research Record: Journal of the Transportation Research Board. 2014;2415(1):89-96. doi: 10.3141/2415-10
- 17 Cats O, Susilo YO, Reimal T. The prospects of fare-free public transport: evidence from Tallinn. Transportation. 2017;44(5):1083-1104. doi: 10.1007/s11116-016-9695-5
- 18 Gabaldón-Estevan D, Orru K, Kaufmann C, Orru H. Broader impacts of the fare-free public transportation system in Tallinn. International Journal of Urban Sustainable Development. 2019;11(3):332-345. doi: 10.1080/19463138.2019.1596114
- 19 Metaxatos P. Ridership and Revenue Implications of Free Fares for Seniors in Northeastern Illinois. JPT. 2013;16(4):131-150. doi: 10.5038/2375-0901.16.4.7
- 20 Zhang Y, Yao E, Zhang R, Xu H. Analysis of elderly people's travel behaviours during the morning peak hours in the context of the free bus programme in Beijing, China. Journal of Transport Geography. 2019;76:191-199. doi: 10.1016/j.jtrangeo.2019.04.002
- 21 Patterson R, Webb E, Mindell JS, Millett C, Laverty AA. Ethnic group differences in impacts of free bus passes in England: A national study. Journal of Transport & Health. 2018;11:1-14. doi: 10.1016/j.jth.2018.09.005
- 22 Reinhard E, Courtin E, van Lenthe FJ, Avendano M. Public transport policy, social engagement and mental health in older age: a quasi-experimental evaluation of free bus passes in England. J Epidemiol Community Health. 2018;72(5):361-368. doi: 10.1136/jech-2017-210038
- 23 Shin EJ. Exploring the causal impact of transit fare exemptions on older adults’ travel behavior: Evidence from the Seoul metropolitan area. Transportation Research Part A: Policy and Practice. 2021;149:319-338. doi: 10.1016/j.tra.2021.05.007
- 24 Alousi-Jones M, El-Geneidy A. If Transit is Free will Older Adults use it More? A Longitudinal Analysis. Findings. 2024;2024. doi: 10.32866/001c.93917
- 25 Sträuli L. Fare-free, not carefree: care mobilities in a fare-free public transport system in Tallinn. Mobilities. 2024;19(4):686-703. doi: 10.1080/17450101.2024.2328215
- 26 Friman M, Maier R, Olsson LE. Applying a motivational stage-based approach in order to study a temporary free public transport intervention. Transport Policy. 2019;81:173-183. doi: 10.1016/j.tranpol.2019.06.012
- 27 Bull O, Muñoz JC, Silva HE. The impact of fare-free public transport on travel behavior: Evidence from a randomized controlled trial. Regional Science and Urban Economics. 2021;86:103616. doi: 10.1016/j.regsciurbeco.2020.103616
- 28 Gregersen FA, Christiansen P, Fearnley N, Hartveit KL, Tveit AK. The Behavioral Impact of Free Public Transport in Stavanger, Norway. Findings. 2024;2024. doi: 10.32866/001c.127735
- 29 Wexler N, Ryan G, Das K, Fan Y. Free Transit Passes and School Attendance among High School Students. Transportation Research Record: Journal of the Transportation Research Board. 2021;2675(8):135-147. doi: 10.1177/0361198121996360
- 30 Dai J, Liu Z, Li R. Improving the subway attraction for the post-COVID-19 era: The role of fare-free public transport policy. Transport Policy. 2021;103:21-30. doi: 10.1016/j.tranpol.2021.01.007
- 31 Munoz EG, Sandoval HH. The Impacts of Fare-Free Bus Programs on Educational Outcomes of K–12 Students. Journal of Human Capital. 2022;16(4):556-584. doi: 10.1086/721376
- 32 Zeiske N, van der Werff E, Steg L. The effects of a financial incentive on motives and intentions to commute to work with public transport in the short and long term. Journal of Environmental Psychology. 2021;78:101718. doi: 10.1016/j.jenvp.2021.101718
- 33 Blättler K, Wallimann H, von Arx W. Free public transport to the destination: A causal analysis of tourists’ travel mode choice. Transportation Research Part A: Policy and Practice. 2024;187:104166. doi: 10.1016/j.tra.2024.104166
- 34 Ofosu-Kwabe K, Lim SH, Malalgoda N. Does fare-free transit increase labor-force participation and reduce income inequality?. Journal of Public Transportation. 2024;26:100095. doi: 10.1016/j.jpubtr.2024.100095
- 35 Liu Q, Liu Z, An Z, Zhao P, Zhao D. A modal shift due to a free within-destination tourist bus scheme: Multimodality and transport equity implications. Research in Transportation Business & Management. 2023;48:100863. doi: 10.1016/j.rtbm.2022.100863
- 36 Rambaldini‐Gooding D, Molloy L, Parrish A, Strahilevitz M, Clarke R, Perez P. Free public transport and older people: An ethnographic study of an Australian bus service. Australas J Ageing. 2023;42(2):409-416. doi: 10.1111/ajag.13158
- 37 GRZELEC K, HEBEL K, HELBIN M, KOŁODZIEJSKI H, WYSZOMIRSKI O. FREE FARE PUBLIC TRANSPORT AS A DETERMINATE ON PUPILS TRAVEL BEHAVIOR AND PREFERENCES IN THEIR DAILY TRAVELS TOWARDS SUSTAINABLE MOBILITY – THE CASE OF GDYNIA (POLAND). SJSUTST. 2023;121:89-106. doi: 10.20858/sjsutst.2023.121.7
- 38 Busch-Geertsema A, Lanzendorf M, Klinner N. Making public transport irresistible? The introduction of a free public transport ticket for state employees and its effects on mode use. Transport Policy. 2021;106:249-261. doi: 10.1016/j.tranpol.2021.04.007
- 39 Štraub D. The Effects of Fare-Free Public Transport: A Lesson from Frýdek-Místek (Czechia). Sustainability. 2020;12(21):9111. doi: 10.3390/su12219111
- 40 Inturri G, Fiore S, Ignaccolo M, Caprì S, Pira ML. “You study, you travel free”: when mobility management strategies meet social objectives. Transportation Research Procedia. 2020;45:193-200. doi: 10.1016/j.trpro.2020.03.007
- 41 Wang S, Liu Y, Corcoran J. Equity of public transport costs before and after a fare policy reform: An empirical evaluation using smartcard data. Transportation Research Part A: Policy and Practice. 2021;144:104-118. doi: 10.1016/j.tra.2020.12.010
- 42 Matas A, Raymond JL, Ruiz A. Economic and distributional effects of different fare schemes: Evidence from the Metropolitan Region of Barcelona. Transportation Research Part A: Policy and Practice. 2020;138:1-14. doi: 10.1016/j.tra.2020.05.014
- 43 Brown AE. Fair fares? How flat and variable fares affect transit equity in Los Angeles. Case Studies on Transport Policy. 2018;6(4):765-773. doi: 10.1016/j.cstp.2018.09.011
- 44 Zhao P, Zhang Y. The effects of metro fare increase on transport equity: New evidence from Beijing. Transport Policy. 2019;74:73-83. doi: 10.1016/j.tranpol.2018.11.009
- 45 Vecchio G, Tiznado-Aitken I, Castillo B, Steiniger S. Fair transport policies for older people: accessibility and affordability of public transport in Santiago, Chile. Transportation. 2024;51(2):689-715. doi: 10.1007/s11116-022-10346-0
- 46 Brough R, Freedman M, Phillips DC. Experimental evidence on the effects of means-tested public transportation subsidies on travel behavior. Regional Science and Urban Economics. 2022;96:103803. doi: 10.1016/j.regsciurbeco.2022.103803
Declarations
Funding
No financing
Conflict of interest
None
Authorship contributions
Drafting – original draft: Patrón Gandara Teresa Abigail, Lilian del Carmen López, Lusby Depablos-Machado.
Writing–review and editing: Patrón Gandara Teresa Abigail, Lilian del Carmen López, Lusby Depablos-Machado.