

Abstract
Introduction: Cycling offers health and environmental benefits, yet the risk of injury in traffic discourages its uptake, and the safety effects of physically separated bicycle lanes relative to painted lanes or mixed traffic remain contested. Methods: This systematic review followed PRISMA 2020. Scopus, OpenAlex, Crossref, PubMed and Semantic Scholar were searched for comparative studies published between 2013 and 2024. Results: From 714 records, 13 studies were included. Physically separated facilities were associated with lower injury or crash risk than mixed traffic or no facility, with adjusted odds ratios from 0.05 to 0.60, equivalent to 40 to 95 percent lower. Painted lanes showed intermediate risk, and intersections and non-orthogonal geometry were associated with higher risk. Conclusions: Physically separated bicycle lanes are associated with lower cyclist injury risk than painted lanes and mixed traffic. The evidence is observational and heterogeneous, and stronger designs with exposure control are needed.
Keywords
bicycling, environment design, traffic accidents, wounds and injuries, cycling infrastructure, systematic review
INTRODUCTION
Bicycling is promoted in transport and health policy because it combines physical activity with low emissions and low space consumption, yet the mode carries a documented injury burden that discourages its uptake in cities where cycling is still marginal.(1,2) Cyclists are overrepresented among traffic deaths relative to their mode share in most high-income countries, and the injury rate per kilometre travelled remains higher for cycling than for driving, which sustains the perception that the mode is unsafe.(3,4)
The perceived and objective risk of collision with motor vehicles is repeatedly identified as the strongest deterrent to cycling, and the excess risk concentrates where cyclists share space with faster and heavier traffic on major urban roads.(3,4) This pattern explains why the provision of dedicated infrastructure, and above all physical separation from motor vehicles, has become the central instrument of cycling safety policy in the cities that have increased cycling while reducing cyclist casualties.(5,6)
The policy relevance is heightened by the pace of implementation: protected lanes are now built faster than the evaluation literature accumulates, so cities frequently commit to a design standard on the strength of evidence generated in different traffic cultures and for different facility geometries.(7)
In that policy context, the protected bicycle lane, a facility in which a kerb, parked vehicles or a planted buffer separates cyclists from moving traffic, has spread rapidly across North America and Europe over the past decade, and its safety performance is now the decisive question for transport planners choosing among facility types.
The available syntheses converge on the observation that bicycle-specific infrastructure is associated with lower injury risk than mixed traffic, but they diverge regarding the magnitude of the protection and, for some facility types, even its direction.(8,9)
Earlier reviews could draw on few studies that controlled for cycling exposure, which weakens the interpretation of route-level risk estimates and leaves open the possibility that protected facilities simply concentrate existing riders rather than reduce risk per kilometre travelled.(3,10)
Primary studies published after those reviews, including case-crossover analyses in Canada and the United Kingdom and before-after evaluations of North American cycle tracks, reported protective effects of separation but with estimates that range widely across designs, outcome sources and settings.(11-13)
A critical review of the safety impacts of bicycle infrastructure concluded that the field remains fragmented across exposure definitions, outcome sources and study designs, which limits what planners can infer about protected lanes in particular.(7)
Reviews also differ in scope: some cover all cycling infrastructure without isolating separation, others focus on a single country or a single outcome source, and none of the recent syntheses treats the protected-versus-painted comparison as its central question.(9,14)
A further gap is the comparator itself: painted lanes and mixed traffic are often treated as a single reference condition even though they pose different risks, so the specific advantage of separation over paint is rarely isolated, and this is the gap that the present review addresses directly.
The objective of this review was to synthesize comparative studies published between 2013 and 2024 that relate cyclist injury or crash risk to physically separated bicycle lanes, painted bicycle lanes and mixed traffic.
The review question follows the PECO format: among cyclists in urban settings, are physically separated bicycle lanes associated with lower injury risk than painted lanes or mixed traffic? The evidence is organized around four thematic axes that structure the results and the discussion: separation versus mixed traffic, separation versus painted lanes, intersections and street design, and network-level built environment effects. Each axis closes with the number of studies that support it, so that the breadth of evidence behind each conclusion can be weighed separately rather than treating the review as a single undifferentiated vote count.
METHODS
The review followed the PRISMA 2020 statement for reporting.(15) Eligibility followed the PECO framework. The population comprised cyclists of any age riding in urban or metropolitan settings. The exposure was a physically separated or protected bicycle facility, understood as a cycle track, a kerb-separated lane or a parking-protected lane with a physical barrier between cyclists and motor traffic. The comparators were painted or buffered bicycle lanes and mixed traffic without a dedicated facility.
The outcome was any cyclist injury, collision or crash expressed as a rate, an odds ratio, a risk ratio or a severity measure. Eligible designs were observational studies with a comparative or exposure-controlled component: case-crossover, case-control, cohort, cross-sectional and before-after studies. Records published between 2013 and 2024 in English were eligible, and peer-reviewed journal articles and academic reports were both admissible. The window was fixed to the years 2013 through 2024 to match the target volume, and studies published after 2024 were not eligible even when retrieved incidentally during the searches. Studies reporting only conflicts or surrogate events without an injury or crash were treated as outside the outcome criterion. Simulation studies, studies of perceived safety alone and studies without an injury or crash outcome were excluded.
Searches were conducted in Scopus, OpenAlex, Crossref, PubMed and Semantic Scholar, restricted to records published between 2013 and 2024. Scopus was searched first with field-restricted queries, and the remaining databases were searched for coverage, because the field spans transport engineering, injury epidemiology and public health.
The core strategy combined terms for separated cycling facilities with terms for injury outcomes. The Scopus query was TITLE-ABS-KEY("protected bike lane" OR "protected bicycle lane" OR "cycle track" OR "separated bicycle lane" OR "segregated cycle lane") AND TITLE-ABS-KEY("injury" OR "crash" OR "collision" OR "safety") AND PUBYEAR > 2012 AND PUBYEAR < 2025.
Three further Scopus queries were run for the core set: one combining facility terms such as bicycle lane, bike lane, cycle lane and cycleway with injury terms and separation terms; one combining cycling or bicycle infrastructure with injury, crash, safety or risk terms; and one combining bicyclist or cyclist with injury risk, crash risk or crash rates and infrastructure, route type, facility type or road environment terms.
In OpenAlex, Crossref and Semantic Scholar the queries combined protected bicycle lane, cycle track and separated bicycle lane with injury, crash and safety, and in PubMed a MeSH-style query combined bicycling, injuries and environment design with bicycle lane and cycle track. Support searches combined cycling safety, bicycle safety and cyclist safety with infrastructure, environment and design, and combined Vision Zero and road safety with cycling and active transport. Each Scopus query was recorded with its date and result count, and the same terms were adapted to the syntax of the other sources.
Records were deduplicated across sources and screened by title and abstract. Duplicates were identified by matching DOIs and, when DOIs were absent, by normalized title and first author.
Decisions at title and abstract were made against the explicit PECO criteria, and any record that met the population and outcome criteria even partially was retained for full-text review. Borderline records were carried forward to full text rather than excluded for lack of information. Records judged potentially eligible proceeded to full-text assessment, which was limited to reports available in open access or through institutional repositories. Full-text exclusions were coded by exposure, outcome, design, language or duplicate report, and the counts at each stage were recorded to construct the PRISMA flow diagram.
For each included study a single reviewer extracted the study identifier, country and city, study design, sample size and population characteristics, the exposure and comparator definitions, the outcome definition and data source, and the main estimate with its confidence interval, plausibility interval or standard error where reported. Data were taken from the full text where available and cross-checked against the abstract.
No imputation of missing estimates was performed, and estimates were transcribed as reported rather than recomputed. Extraction was recorded in a structured table, and the risk-of-bias ratings were kept alongside the extracted estimates so that each conclusion in the synthesis could be traced to its source study. Screening decisions, retrieval outcomes and the final inclusion set were kept in a workflow file that also generated the flow diagram counts, which were computed from the recorded decisions rather than adjusted by hand.
Risk of bias was appraised with domains adapted from ROBINS-I for non-randomized studies of interventions:(16) control for cycling exposure, outcome ascertainment, and design-related confounding. Control for exposure was judged adequate when cycling volumes or modelled routes entered the analysis; outcome ascertainment was judged by the data source, with hospital and trauma records preferred over police records because police data under-report single-bicycle crashes; and design-related confounding was judged by whether the design removed stable personal or route-selection confounding.
Each study was rated as low, moderate or high concern overall, and ratings were assigned only when the reported methods supported them. Ratings were not lowered when information was absent; a study with no usable exposure measure was rated high concern on that domain rather than given the benefit of the doubt.
Because designs, exposure definitions and outcome measures differed across studies, a narrative synthesis organized by thematic axis was performed. The four axes were defined before synthesis and correspond to the comparisons in the PECO question. Within each axis the direction and range of the reported estimates were described, and the number of studies supporting each conclusion was counted from the extraction table.
The synthesis therefore reports, for each axis, the number of supporting studies and the range of their main estimates, and it distinguishes studies that controlled for exposure from those that did not, because the exposure-controlled studies carry more weight in the narrative than the ecological and descriptive ones. Meta-analysis was not undertaken; pooling route-level odds ratios with network-level frequency models and severity analyses would not produce an interpretable estimate, and the reported measures of uncertainty were not compatible across designs.
RESULTS
Study selection
Database searches identified 714 records, of which 169 duplicates were removed and 545 records were screened by title and abstract. Scopus contributed 385 records, OpenAlex 110, PubMed 99, Crossref 60 and Semantic Scholar 60. After excluding 493 records at title and abstract, 52 reports were sought for retrieval; 38 reports were not retrievable in open access, most because the full text sat behind a publisher paywall.
The records excluded at title and abstract were predominantly studies of perceived safety, behaviour or simulation, and studies of other road users or other modes, which the eligibility criteria removed because they did not report an injury or crash outcome for cyclists. Of the 14 reports assessed for eligibility, 1 was excluded because the exposure did not correspond to a separated facility, leaving 13 studies included in the synthesis (Figure 1).
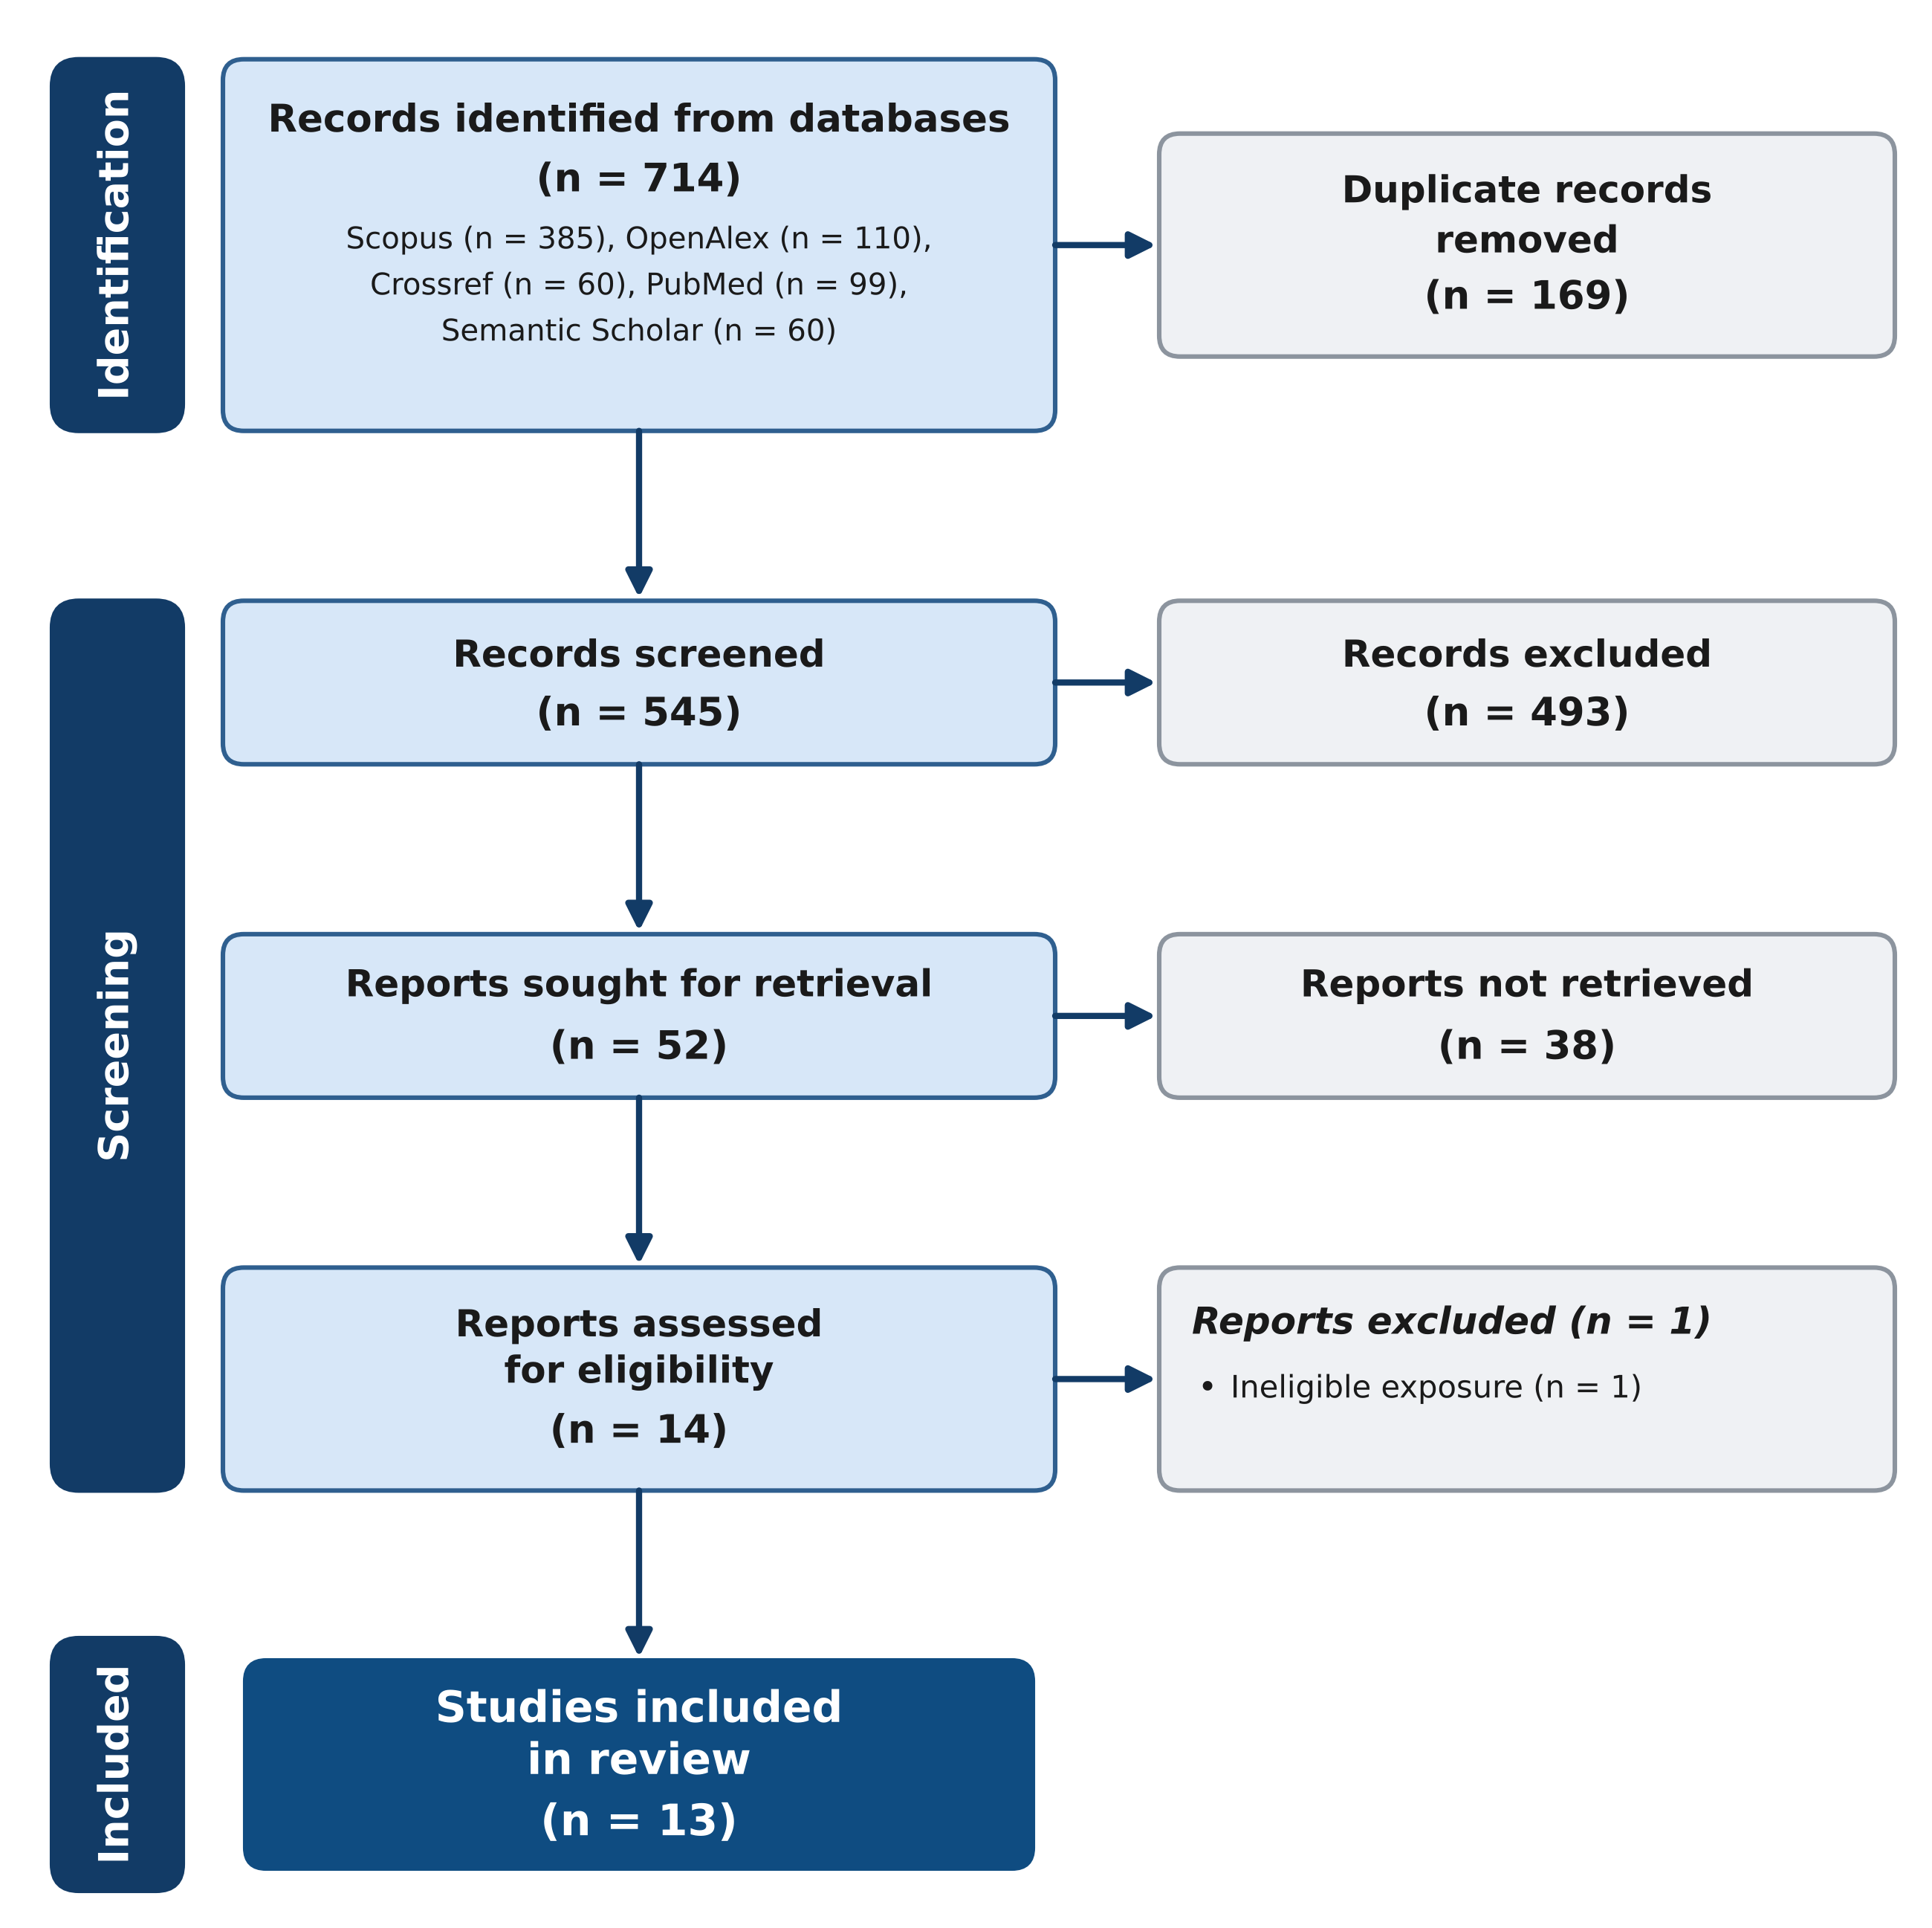
Figure 1. PRISMA 2020 flow diagram of study selection.
Characteristics of included studies
The included studies were conducted in six countries across North America, Europe and Oceania.(17-29)
Designs comprised two case-crossover studies,(18,19) one case-control study,(20) two ecological crash frequency models,(21,26) one risk translation modelling study,(24) and seven cross-sectional or regression analyses of crash and injury records.(17,22,23,25,27-29)
Four studies relied on police-reported collisions,(19,20,23,28) two used hospital or emergency department records,(18,29) one combined ambulance and police records,(17) and the remainder used crash registries, trauma data or modelled combinations of secondary sources.(21,22,24-27)
Five studies controlled directly for cycling exposure through counts, modelled routes or a case-crossover structure. Sample sizes ranged from 683 injured cyclists in the Canadian severity studies to 7088 crashes in the San Francisco Bay Area, and the two Copenhagen models analysed 5349 cyclist-motorist collisions across the region. The studies are summarized in (Table 1).
Study | Country | Design | Exposure | Outcome | Main estimate |
|---|---|---|---|---|---|
van Petegem et al. 2021 | Netherlands | Cross-sectional network crash model | Cycle tracks vs cycle lanes vs mixed traffic | Bicycle crashes | 50-60% fewer crashes on cycle tracks |
Harris et al. 2013 | Canada | Case-crossover | Cycle tracks, local streets, major streets | Bicycling injury | aOR 0.05 (0.01-0.59) cycle tracks |
Adams and Aldred 2020 | United Kingdom | Case-crossover | Protected vs advisory lanes vs none | Injury odds | 40-65% lower with protection |
Williams et al. 2018 | New Zealand | Case-control | On-road cycle lanes, driveways, intersections | Bicycle-motor vehicle crash | Lower risk with cycle lanes |
Prato et al. 2016 | Denmark | Ecological Poisson-lognormal | Infrastructure and land use | Collision frequency | Paths safer, suburban benefit |
Teschke et al. 2014 | Canada | Cross-sectional descriptive | 14 route types | Crash circumstances | Motor vehicle collisions on major streets |
Asgarzadeh et al. 2016 | United States | Cross-sectional log-binomial | Intersection and street design | Injury severity | RR 1.37 non-orthogonal intersections |
Thompson et al. 2021 | Canada | Risk translation modelling | Separated cycle tracks | Preventable injuries | 152.9 injuries prevented |
Cripton et al. 2015 | Canada | Cross-sectional logistic | Route and crash characteristics | Injury severity | Motor vehicle collision raised severity |
Kaplan and Prato 2015 | Denmark | Joint frequency-severity model | Infrastructure and land use | Crash frequency and severity | Paths increase safety |
Tao et al. 2021 | United States | Safety performance functions | Exposure inclusion | Crash risk prediction | Exposure improves fit |
Barajas 2018 | United States | Cross-sectional by group | Built environment | Crash frequency | Infrastructure did not reduce minority crashes |
Goerke et al. 2020 | United States | Retrospective cohort | Citywide bike lane miles | Injury severity | Lower ISS with more lane miles |
Note: aOR = adjusted odds ratio; RR = risk ratio; ISS = injury severity score.
Risk of bias
Risk of bias varied across designs. The two case-crossover studies carried low concern because each injured cyclist served as his or her own control, which removes stable personal confounding such as age, experience and habitual route preference.(18,19)
The ecological and cross-sectional studies carried moderate to high concern, mainly because cycling exposure was approximated or absent and because outcome ascertainment relied on police records that under-report single-bicycle crashes and low-severity events.(21,22,26-28)
Three studies were rated high concern overall on account of a descriptive design, a modelling exercise without an empirical comparison arm, or ecologic exposure assignment.(22,24,28) No study was rated low concern across all three domains simultaneously, and the ratings are summarized per study (Table 2).
Study | Exposure control | Outcome ascertainment | Design-related confounding | Overall |
|---|---|---|---|---|
van Petegem et al. 2021 | Low | Low | Mod | Mod |
Harris et al. 2013 | Low | Low | Low | Low |
Adams and Aldred 2020 | Mod | Mod | Low | Mod |
Williams et al. 2018 | High | Mod | Mod | Mod |
Prato et al. 2016 | Low | Mod | Mod | Mod |
Teschke et al. 2014 | Mod | High | High | High |
Asgarzadeh et al. 2016 | High | Mod | Mod | Mod |
Thompson et al. 2021 | Mod | High | High | High |
Cripton et al. 2015 | Mod | High | Mod | Mod |
Kaplan and Prato 2015 | Low | Mod | Mod | Mod |
Tao et al. 2021 | Low | Mod | Mod | Mod |
Barajas 2018 | Mod | Mod | High | High |
Goerke et al. 2020 | High | Low | Mod | Mod |
Note: Ratings reflect concern of bias. Low = low concern; Mod = moderate; High = high concern.
Separated facilities versus mixed traffic
The available evidence converges on a protective association between physical separation and injury or crash risk when cyclists are compared with mixed traffic on major roads. A network analysis of distributor roads in Amsterdam found 50 to 60 percent fewer bicycle crashes on roads with cycle tracks than on roads with cycle lanes, after controlling for kilometres travelled by bicycle and by motor vehicle, and it used ambulance records so that single-bicycle crashes that police data miss were retained in the outcome.(17)
The same analysis identified two risk factors that accompany separation and can be mitigated in design: curbside parking was associated with roughly twice the crash likelihood and tram tracks with a factor between 1.7 and 2.(17)
A case-crossover study in Vancouver and Toronto estimated that cycle tracks at non-intersection locations carried an adjusted odds ratio of 0.05 for injury relative to major streets without bicycle infrastructure, and that local streets with diverters that reduce motor traffic carried an adjusted odds ratio of 0.04, while downhill grades increased risk at both intersection and non-intersection locations.(18)
In London, protected cycle infrastructure reduced the odds of injury by 40 to 65 percent during the morning commute relative to no infrastructure, whereas advisory lanes increased the odds by 34 percent, in an analysis of 2876 injury points and 5754 control points drawn from police records restricted to weekday morning utility trips.(19)
Of those injury points, 2494 were classified as slight injuries, 375 as serious and 7 as fatal, and the analysis was confined to weekday collisions between 7 and 10 in the morning so that the route prediction algorithm would reflect utility trips.(19)
A modelling study applied these relative risks to a Toronto corridor and estimated that fully separated cycle tracks would prevent roughly 153 injuries and 0.9 fatalities over ten years at current ridership, with plausible intervals from 61 to 213 injuries.(24)
Consistent with the route-level estimates, a retrospective cohort in Minneapolis found that each additional mile of bike lane in the city was associated with a lower injury severity score among admitted cyclists and with lower odds of severe head injury, although the exposure was assigned ecologically across the city rather than at the crash site and mortality did not change.(29)
Across the 5 studies in this axis, the direction of the association was uniform and the magnitude ranged from a 40 percent to a 95 percent reduction in injury or crash odds.
Separated versus painted lanes
The evidence diverges regarding the advantage of separated facilities over painted lanes, and the divergence tracks the exposure definition used in each study. The Amsterdam analysis estimated 50 to 60 percent fewer crashes on cycle tracks than on marked cycle lanes, and it is the only included study to compare the two facility types directly with complete control for both cycling and motorized exposure.(17)
The London case-crossover reported the complementary finding that protected infrastructure lowered injury odds while advisory painted lanes raised them by 34 percent, implying a large gap between separation and paint rather than a continuous gradient.(19)
The case-crossover study in Vancouver and Toronto found cycle tracks protective and painted lanes on major streets not clearly distinguishable from no infrastructure at non-intersection locations, which suggests that paint alone does not reproduce the protection of separation.(18)
A descriptive analysis of route types in the same cities documented that collisions with motor vehicles, including doorings, were overrepresented on major streets with parked cars, which is the configuration that a painted lane does not resolve because the lane itself remains inside the door zone, and it showed that the crash circumstances themselves differ by route type.(22)
A case-control study in Christchurch found on-road cycle lanes associated with lower crash odds than sites without them across all four of its route-selection models, although it did not isolate physically separated facilities from painted ones, and it identified driveways and intersections as features that increased crash odds, which places that study between the painted-lane and the intersection axes.(20)
Across the 5 studies, separation was never found to be less safe than a painted lane, and three of the five studies quantified a meaningful protective margin for the separated facility.
Intersections and street design
The included studies agree that intersections concentrate cyclist injury risk and that the design of the intersection modifies the protective effect of the approach infrastructure. The case-crossover analysis reported that cycle tracks were protective away from intersections but that traffic circles on local streets raised injury risk markedly with an adjusted odds ratio of 7.98, and that motor vehicle speeds below 30 kilometres per hour reduced risk with an adjusted odds ratio of 0.52.(18)
A study of bicycle-motor vehicle crashes in New York City found that non-orthogonal intersections carried a risk ratio of 1.37 for severe injury relative to orthogonal intersections, and that non-intersection street segments carried a risk ratio of 1.31, while crashes involving a truck or bus were about twice as likely to be severe and street width was not significantly associated with severity.(23)
An analysis of injury severity in Toronto and Vancouver identified collision with a motor vehicle and higher vehicle speeds as the factors most consistently associated with more severe injuries across four severity metrics, which the authors interpreted as an argument for separating cyclists at and near intersections.(25)
Among the 683 injured adults in that dataset, 528 did not continue their trip by bicycle, 251 were transported by ambulance and 60 were admitted to hospital, and the severity pattern was consistent across the four metrics.(25)
A joint frequency and severity model for the Copenhagen region similarly emphasized that intersection design, and not only the approach treatment, conditions cyclist safety across the network, and it reported that the most severe crashes benefit most from higher cyclist numbers.(26)
Across the 4 studies, the evidence is consistent that intersection geometry and turning movements can offset the protection gained on separated mid-block segments.
Network, built environment and exposure effects
Irrespective of the facility type studied, the network-level studies converge on the conclusion that infrastructure effects are contingent on exposure, land use and urban context. An ecological model of cyclist-motorist collisions in the Copenhagen region confirmed a safety-in-numbers pattern and found that bicycle paths increased safety most in suburban areas where the speed differential between cyclists and motorists is largest.(21)
That model was estimated over 269 traffic zones and controlled for bicycle and motorized exposure, which allowed it to separate the effect of paths from the effect of the volume that the paths themselves attract.(21)
The companion severity model added that the most severe crashes benefit most from increases in cyclist numbers, which links aggregate exposure to injury severity rather than only to crash frequency.(26)
In Minneapolis, safety performance functions that incorporated pedestrian and bicycle exposure changed the spatial distribution of predicted high-risk locations, including the share located in low-income and racially concentrated areas, and improved model validity and goodness of fit relative to models without exposure.(27)
The Minneapolis findings carry a further implication for evaluation: without exposure terms, the ranking of high-risk locations changes, which means that infrastructure benefits measured without exposure can be attributed to the wrong places.(27)
In parallel, an analysis of the San Francisco Bay Area found that high poverty and high land-use intensity were associated with more crashes overall, while bicycle infrastructure and low-traffic streets did not reduce crash frequency among Black and Hispanic cyclists, a divergence from the route-level evidence that documents the role of neighbourhood context and historical disparities in who benefits from facilities.(28)
Across the 4 studies, infrastructure was protective or neutral depending on exposure and equity context, and none of the studies supported a claim that facilities alone equalize risk across population groups (Table 3).
Thematic axis | Studies (n) | Direction of evidence | Range of reported estimates |
|---|---|---|---|
Separated facilities versus mixed traffic | 5 | Consistently protective | aOR 0.04 to 0.60 |
Separated versus painted lanes | 5 | Protective or neutral | 50-60% fewer crashes; advisory lanes 34% higher |
Intersections and street design | 4 | Elevated risk at intersections | RR 1.31 to 1.37; aOR 7.98 traffic circles |
Network and built environment effects | 4 | Context dependent | Direction only |
Note: aOR = adjusted odds ratio; RR = risk ratio.
DISCUSSION
The principal implication of the synthesized evidence is that physical separation is the infrastructure attribute most consistently associated with lower cyclist injury risk, and that the margin of protection is largest exactly where cyclists otherwise share the carriageway with motorized traffic.
The association is coherent across route-level and network-level studies, across countries with very different cycling cultures, and across designs that vary from self-controlled case-crossover analyses to ecological frequency models, which reduces the likelihood that the finding is an artifact of a single method or setting. The policy corollary is that replacing mixed traffic or painted lanes with physically separated cycle tracks on major urban roads is supported by the available evidence, while the protection granted at mid-block locations does not extend automatically through intersections, where design remains decisive.
The protective estimates in this review are consistent with earlier studies that preceded the 2013 window and were therefore used only as context. The case-crossover analysis of Vancouver and Toronto reported that cycle tracks carried about one ninth of the injury risk of major streets, an estimate close in direction to the odds ratio of 0.05 reproduced in the present set.(11)
A street-level comparison in Montreal found lower injury risk on cycle tracks than on the street, and a review of urban cycle track safety reached the same qualitative conclusion from a much thinner evidence base.(8,30)
The Cochrane review of cycling infrastructure concluded that the field lacked studies with adequate exposure control, a gap that the Amsterdam analysis and the two case-crossover studies in this review have since begun to fill.(9,17-19)
There are also discrepancies that require explanation. The Cochrane review and some early North American reports were unable to demonstrate a clear benefit of bicycle lanes, whereas the exposure-controlled studies in this review find painted lanes either intermediate or not distinguishable from no infrastructure.(9,18,19)
The most plausible source of the discrepancy is the treatment of exposure: studies that fail to control for where and how much people cycle conflate the attraction of riders to a facility with the risk that the facility confers, a bias that the Minneapolis safety performance functions document directly.(27)
A further discrepancy concerns intersections, where early reviews reported mixed effects of cycle tracks, and the included studies resolve this by separating mid-block protection from intersection risk.(7,8) The United States evaluation of protected bike lanes adds the nuance that not all protected lanes perform alike, because crash risk varied by design features and intersection treatment rather than by the presence of a barrier alone, which cautions against treating protected lanes as a homogeneous category.(31)
The United States cycle track studies illustrate the same point: crash rates on American cycle tracks were higher at intersections than mid-block, which mirrors the intersection finding of the present review and explains why early before-after evaluations without exposure control produced null or mixed results.(12)
The on-road lane-type analysis adds that buffered and protected designs are not interchangeable with conventional paint, and that risk varies with roadway characteristics, a conclusion the Amsterdam and London studies quantify directly.(13,17,19)
Apart from these points, the field agrees that severity, and not only crash frequency, responds to separation, as the Copenhagen and Toronto severity analyses indicate.(25,26)
A second convergent finding concerns severity rather than frequency. The two Canadian severity analyses and the Minneapolis cohort all report that the same exposure that lowers crash frequency also lowers the severity of the injuries that do occur, which matters for hospital burden even when the crash count is unchanged.(25,29)
This finding aligns with the Copenhagen severity model, which found that the most severe crashes benefit most from higher cyclist numbers, and it strengthens the case for separation because it implies that the intervention acts on the mechanism of injury rather than only on the probability of a collision.(26)
Plausible mechanisms explain the observed pattern. Separation removes the two interactions that dominate serious cyclist injuries, the overtaking conflict and the door-zone conflict, and it reduces the speed differential at the point where a conflict would occur, which the Amsterdam and Canadian analyses identify as the operative variables.(17,18,25)
At intersections the same mechanisms weaken because turning movements re-establish the crossing conflict that the barrier suppresses mid-block, which is consistent with the elevated estimates for non-orthogonal geometry and traffic circles.(18,23)
The safety-in-numbers pattern provides a complementary mechanism at the network scale, because higher cycling volumes reduce the per-rider collision rate and the most severe crashes benefit most, as the Copenhagen models and the earlier volume-risk literature report.(21,26,32)
A related mechanism is route substitution: protected facilities attract riders away from busier roads, so part of the measured benefit may reflect the change in where cycling occurs rather than the physical barrier alone, which the case-crossover designs mitigate by sampling controls from each rider's own route.(18,19)
The mechanisms are not mutually exclusive, and their relative contribution probably differs between settings: in cycling-dominant cities the safety-in-numbers effect dominates, whereas in car-dominant cities the protective effect of the barrier itself is the more visible margin, which would reconcile the larger relative reductions reported in North American and British studies with the smaller absolute risk differences observed in Dutch and Danish networks.(17-19,21)
Heterogeneity across the included studies has three identifiable sources. The first is the outcome source: police records capture collisions with motor vehicles well but under-report single-bicycle crashes and low-severity events, and hospital and trauma registries measure severity rather than incidence, so the same facility can appear protective in one source and neutral in another.(14,33,34)
The second is the level of analysis: route-level studies estimate risk conditional on a chosen route, whereas network and zone-level studies estimate frequency and are vulnerable to the aggregation and exposure problems that single-bicycle crash reviews describe.(21,35)
The third is the comparator, because painted lanes, advisory lanes and mixed traffic are not interchangeable categories, and two included studies quantify that advisory paint differs from full separation by a factor of about two in injury odds.(17,19)
Design heterogeneity also constrains the summary: the case-crossover studies estimate the within-rider change in risk attributable to the route environment, the ecological models estimate area-level frequency, and the severity analyses condition on having crashed, so the three quantities are related but not identical, and a single pooled estimate would blend them illegitimately.(18,21,25)
This is why the synthesis reports direction and range per axis rather than a combined number, and why the range from a 40 to a 95 percent reduction should be read as a bracket of estimates, not as a confidence interval around one true value. The direction of every exposure-controlled estimate nonetheless points the same way, which is the more informative summary given the measurement differences. These sources of heterogeneity do not invalidate the protective finding, but they explain why a single pooled estimate would misrepresent the evidence.
The thematic axes are related rather than independent, and the relations explain the remaining disagreements in the literature. The separation axis and the intersection axis interact: the benefit of a cycle track measured at mid-block is diluted when the route passes through a non-orthogonal or signalized intersection, which is why the Amsterdam and Vancouver estimates of separation are lower than a naive comparison of cycle track against major street would suggest.(17,18,23)
The network axis qualifies the equity claim that often accompanies infrastructure investment, because facilities that reduce risk for riders who already use them do not automatically reduce risk in the neighbourhoods that need them most, a point made independently for the San Francisco Bay Area and for Canadian census cohorts.(28,36)
The built-environment evidence around bike-share stations reinforces the same conclusion, because crash risk there tracks street context as much as the presence of a facility.(37)
The exposure axis is the common thread: wherever cycling volume was modelled or measured, the estimated effect of infrastructure changed materially, which indicates that future evaluations must treat exposure as a design requirement and not as an optional adjustment.(10,27,32)
The review has strengths that temper its limitations. The search combined five databases, and the core studies all controlled for cycling exposure through counts, modelled routes or self-controlled designs, which addresses the weakness that earlier reviews identified as decisive. The included studies span six countries and both cycling-dominant and car-dominant settings, so the protective association is not confined to one national context, and the thematic organization makes the comparison between separated and painted facilities explicit rather than buried in a pooled estimate.
The inclusion of both route-level and network-level designs also allows the review to show where the two levels agree and where they diverge, which a single-level review would not detect. Finally, the review records the direction and range of estimates rather than a single pooled figure, which preserves the uncertainty that the heterogeneous designs imply.
The implications for practice follow directly from the axes. Cities that aim to reduce cyclist injury risk should prioritize physically separated facilities on high-speed, high-volume roads, extend the separation design through intersections, and pair infrastructure with speed management on the surrounding network, which the European evidence on 30 kilometre per hour zones supports as a complementary measure.(38,39)
The equity evidence cautions against treating mileage of new lanes as a sufficient indicator of safety benefit, because the distribution of infrastructure across neighbourhoods and rider groups conditions who receives the protection, and planning practice can respond by locating protected facilities where crash and injury concentration is highest and by pairing them with the exposure monitoring that the Minneapolis work shows is necessary to know whether the intervention reached the intended riders.(27,28,36,40)
For research, the priority is exposure-controlled evaluation of protected lanes against painted lanes, a comparison that only one included study performed with complete counts, together with standardized reporting of effect estimates to enable future meta-analysis.(17,41)
Standardized reporting would also allow the severity and frequency effects to be combined into a single estimate of injury burden, which the current literature reports separately. Individual-level safety measures such as helmets have been reviewed extensively and remain relevant, but they do not substitute for the environmental separation that the route-level evidence associates with lower risk.(42,43)
Three research questions follow from the gaps: whether the protective margin of separation over paint persists once mode shift and route substitution are accounted for; whether the intersection penalty can be reduced by protected intersection designs that are only beginning to be evaluated; and whether infrastructure reduces injury risk in the populations and neighbourhoods that currently bear the highest crash burden, which the equity evidence suggests is not automatic.(18,28,36)
The wider literature on cycling cities adds the observation that safety and ridership rise together, which suggests that the protective association documented here may strengthen as networks mature and the safety-in-numbers effect operates at city scale.(1,6,44)
CONCLUSIONS
Physically separated bicycle lanes are associated with lower cyclist injury risk than painted lanes and mixed traffic, with the largest and most consistent reductions observed against mixed traffic on major roads, and with intersections remaining the locations where the protection of separation is most easily lost. The comparison between separated and painted facilities rests on few exposure-controlled studies and indicates an intermediate, less consistent position for paint.
The evidence is observational, heterogeneous across outcome sources and levels of analysis, and unevenly distributed across countries and population groups, so the conclusions are provisional rather than definitive and should be read as support for a direction of infrastructure policy, not as a precise effect size. Until exposure-matched prospective evidence accumulates, the direction of the association, rather than its exact magnitude, should guide facility selection. Stronger evidence requires prospective exposure-matched designs, linked injury records and standardized reporting of separated, painted and mixed traffic conditions.
References
- 1 Pucher J, Buehler R. Safer Cycling Through Improved Infrastructure. Am J Public Health. 2016;106(12):2089-2091. doi: 10.2105/ajph.2016.303507
- 2 Wegman F, Zhang F, Dijkstra A. How to make more cycling good for road safety?. Accident Analysis & Prevention. 2012;44(1):19-29. doi: 10.1016/j.aap.2010.11.010
- 3 Reynolds CC, Harris MA, Teschke K, Cripton PA, Winters M. The impact of transportation infrastructure on bicycling injuries and crashes: a review of the literature. Environ Health. 2009;8(1):47. doi: 10.1186/1476-069x-8-47
- 4 Buehler R, Pucher J. Cycling to work in 90 large American cities: new evidence on the role of bike paths and lanes. Transportation. 2012;39(2):409-432. doi: 10.1007/s11116-011-9355-8
- 5 Pucher J, Buehler R. Making Cycling Irresistible: Lessons from The Netherlands, Denmark and Germany. Transport Reviews. 2008;28(4):495-528. doi: 10.1080/01441640701806612
- 6 Schepers P, Twisk D, Fishman E, Fyhri A, Jensen A. The Dutch road to a high level of cycling safety. Safety Science. 2017;92:264-273. doi: 10.1016/j.ssci.2015.06.005
- 7 DiGioia J, Watkins KE, Xu Y, Rodgers M, Guensler R. Safety impacts of bicycle infrastructure: A critical review. Journal of Safety Research. 2017;61:105-119. doi: 10.1016/j.jsr.2017.02.015
- 8 Thomas B, DeRobertis M. The safety of urban cycle tracks: A review of the literature. Accident Analysis & Prevention. 2013;52:219-227. doi: 10.1016/j.aap.2012.12.017
- 9 Mulvaney CA, Smith S, Watson MC, Parkin J, Coupland C, Miller P, et al. Cycling infrastructure for reducing cycling injuries in cyclists. Cochrane Database Syst Rev. 2015;2015(12):CD010415. doi: 10.1002/14651858.cd010415.pub2
- 10 Elvik R. The non-linearity of risk and the promotion of environmentally sustainable transport. Accident Analysis & Prevention. 2009;41(4):849-855. doi: 10.1016/j.aap.2009.04.009
- 11 Teschke K, Harris MA, Reynolds CCO, Winters M, Babul S, Chipman M, et al. Route Infrastructure and the Risk of Injuries to Bicyclists: A Case-Crossover Study. Am J Public Health. 2012;102(12):2336-2343. doi: 10.2105/ajph.2012.300762
- 12 Lusk AC, Morency P, Miranda-Moreno LF, Willett WC, Dennerlein JT. Bicycle Guidelines and Crash Rates on Cycle Tracks in the United States. Am J Public Health. 2013;103(7):1240-1248. doi: 10.2105/ajph.2012.301043
- 13 Morrison CN, Thompson J, Kondo MC, Beck B. On-road bicycle lane types, roadway characteristics, and risks for bicycle crashes. Accident Analysis & Prevention. 2019;123:123-131. doi: 10.1016/j.aap.2018.11.017
- 14 Salmon PM, Naughton M, Hulme A, McLean S. Bicycle crash contributory factors: A systematic review. Safety Science. 2022;145:105511. doi: 10.1016/j.ssci.2021.105511
- 15 Page MJ, McKenzie JE, Bossuyt PM, Boutron I, Hoffmann TC, Mulrow CD, et al. The PRISMA 2020 statement: an updated guideline for reporting systematic reviews. BMJ. 2021:n71. doi: 10.1136/bmj.n71
- 16 Sterne JA, Hernán MA, Reeves BC, Savović J, Berkman ND, Viswanathan M, et al. ROBINS-I: a tool for assessing risk of bias in non-randomised studies of interventions. BMJ. 2016:i4919. doi: 10.1136/bmj.i4919
- 17 van Petegem JH, Schepers P, Wijlhuizen GJ. The safety of physically separated cycle tracks compared to marked cycle lanes and mixed traffic conditions in Amsterdam. European Journal of Transport and Infrastructure Research. 2021;21(3):19-37. doi: 10.18757/ejtir.2021.21.3.5283
- 18 Harris MA, Reynolds CCO, Winters M, Cripton PA, Shen H, Chipman ML, et al. Comparing the effects of infrastructure on bicycling injury at intersections and non-intersections using a case–crossover design. Inj Prev. 2013;19(5):303-310. doi: 10.1136/injuryprev-2012-040561
- 19 Adams T, Aldred R. Cycling Injury Risk in London: Impacts of Road Characteristics and Infrastructure. Findings. 2020;2020. doi: 10.32866/001c.18226
- 20 Williams T, Doscher C, Page S. Spatial characteristics of bicycle–motor vehicle crashes in Christchurch, New Zealand: A case-control approach. JTLU. 2018;11(1):849-864. doi: 10.5198/jtlu.2018.1147
- 21 Prato CG, Kaplan S, Rasmussen TK, Hels T. Infrastructure and spatial effects on the frequency of cyclist-motorist collisions in the Copenhagen Region. Journal of Transportation Safety & Security. 2016;8(4):346-360. doi: 10.1080/19439962.2015.1055414
- 22 Teschke K, Frendo T, Shen H, Harris MA, Reynolds CC, Cripton PA, et al. Bicycling crash circumstances vary by route type: a cross-sectional analysis. BMC Public Health. 2014;14(1):1205. doi: 10.1186/1471-2458-14-1205
- 23 Asgarzadeh M, Verma S, Mekary RA, Courtney TK, Christiani DC. The role of intersection and street design on severity of bicycle-motor vehicle crashes. Inj Prev. 2017;23(3):179-185. doi: 10.1136/injuryprev-2016-042045
- 24 Thompson C, Branion-Calles M, Harris A. Translating risk to preventable burden by estimating numbers of bicycling injuries preventable by separated infrastructure on a Toronto, Ontario corridor. UTJPH. 2021;2(1). doi: 10.33137/utjph.v2i1.35209
- 25 Cripton PA, Shen H, Brubacher JR, Chipman M, Friedman SM, Harris MA, et al. Severity of urban cycling injuries and the relationship with personal, trip, route and crash characteristics: analyses using four severity metrics. BMJ Open. 2015;5(1):e006654. doi: 10.1136/bmjopen-2014-006654
- 26 Kaplan S, Giacomo Prato C. A Spatial Analysis of Land Use and Network Effects on Frequency and Severity of Cyclist–Motorist Crashes in the Copenhagen Region. Traffic Injury Prevention. 2015;16(7):724-731. doi: 10.1080/15389588.2014.1003818
- 27 Tao T, Lindsey G, Cao J, Wang J. The effects of pedestrian and bicycle exposure on crash risk in Minneapolis. JTLU. 2021;14(1):1187-1208. doi: 10.5198/jtlu.2021.1980
- 28 Barajas JM. Not all crashes are created equal: Associations between the built environment and disparities in bicycle collisions. JTLU. 2018;11(1). doi: 10.5198/jtlu.2018.1145
- 29 Goerke D, Zolfaghari E, Marek AP, Endorf FW, Nygaard RM. Incidence and Profile of Severe Cycling Injuries After Bikeway Infrastructure Changes. J Community Health. 2020;45(3):542-549. doi: 10.1007/s10900-019-00773-z
- 30 Lusk AC, Furth PG, Morency P, Miranda-Moreno LF, Willett WC, Dennerlein JT. Risk of injury for bicycling on cycle tracks versus in the street. Inj Prev. 2011;17(2):131-135. doi: 10.1136/ip.2010.028696
- 31 Cicchino JB, McCarthy ML, Newgard CD, Wall SP, DiMaggio CJ, Kulie PE, et al. Not all protected bike lanes are the same: Infrastructure and risk of cyclist collisions and falls leading to emergency department visits in three U.S. cities. Accident Analysis & Prevention. 2020;141:105490. doi: 10.1016/j.aap.2020.105490
- 32 Jacobsen PL. Safety in numbers: more walkers and bicyclists, safer walking and bicycling. Inj Prev. 2003;9(3):205-209. doi: 10.1136/ip.9.3.205
- 33 Kjærgaard K, Lauritsen J. Variation in traffic injury settings—same implication of hospital and police-based traffic injury data?. Journal of Transport & Health. 2024;36:101782. doi: 10.1016/j.jth.2024.101782
- 34 Wei W, Li N, Qiu C, Liang Z, Ma Z. Analysis of bicycle crash characteristics and typical scenarios in France: A descriptive epidemiology and clustering approach. Travel Behaviour and Society. 2024;36:100778. doi: 10.1016/j.tbs.2024.100778
- 35 Utriainen R, O’Hern S, Pöllänen M. Review on single-bicycle crashes in the recent scientific literature. Transport Reviews. 2023;43(2):159-177. doi: 10.1080/01441647.2022.2055674
- 36 Branion-Calles M, Winters M, Rothman L, Harris MA. Risk Factors and Inequities in Transportation Injury and Mortality in the Canadian Census Health and Environment Cohorts (CanCHECs). Epidemiology. 2024;35(2):252-262. doi: 10.1097/ede.0000000000001696
- 37 Jeon J, Woo A. The effects of built environments on bicycle accidents around bike-sharing program stations using street view images and deep learning techniques: The moderating role of streetscape features. Journal of Transport Geography. 2024;121:103992. doi: 10.1016/j.jtrangeo.2024.103992
- 38 Yannis G, Michelaraki E. Review of City-Wide 30 km/h Speed Limit Benefits in Europe. Sustainability. 2024;16(11):4382. doi: 10.3390/su16114382
- 39 Ekmekci M, Dadashzadeh N, Woods L. Assessing the impact of low-speed limit zones' policy implications on cyclist safety: Evidence from the UK. Transport Policy. 2024;152:29-39. doi: 10.1016/j.tranpol.2024.04.014
- 40 Batomen B, Macpherson A, Lewis J, Howard A, Ruth Saunders N, Richmond S, et al. Vulnerable road user injury trends following the COVID-19 pandemic in Toronto, Canada: An interrupted time series analysis. Journal of Safety Research. 2024;89:152-159. doi: 10.1016/j.jsr.2024.02.007
- 41 da Silva PHV, Bezerra BS. A meta-analysis of safety countermeasures for vulnerable users on urban roads. Transportation Research Procedia. 2024;78:452-459. doi: 10.1016/j.trpro.2024.02.057
- 42 Hoye A. Recommend or mandate? A systematic review and meta-analysis of the effects of mandatory bicycle helmet legislation. Accident Analysis & Prevention. 2018;120:239-249. doi: 10.1016/j.aap.2018.08.001
- 43 Kazemzadeh K, Laureshyn A, Winslott Hiselius L, Ronchi E. Expanding the Scope of the Bicycle Level-of-Service Concept: A Review of the Literature. Sustainability. 2020;12(7):2944. doi: 10.3390/su12072944
- 44 Marshall WE, Ferenchak NN. Why cities with high bicycling rates are safer for all road users. Journal of Transport & Health. 2019;13:100539. doi: 10.1016/j.jth.2019.03.004
Declarations
Funding
No financing
Conflict of interest
None
Authorship contributions
Drafting – original draft: Pedro Chanel Sosa-Abreu, Rubi Lorena Portillo Apodaca.
Writing–review and editing: Pedro Chanel Sosa-Abreu, Rubi Lorena Portillo Apodaca.