

Abstract
Introduction: Electric bicycles have become a common component of station-based bike-share systems, but multi-year, system-level evidence on their share of trips, distance and speed remains scarce. Methods: We analyzed 19,851,054 trip records published monthly by Capital Bikeshare, Washington, DC, between January 2018 and December 2023. Electric share, trip distance and speed were computed from April 2020 to December 2023, when the rideable_type field became available, while member and casual ridership covered the full period. Results: Electric bicycles accounted for 21.7% of 12,372,553 trips recorded between April 2020 and December 2023. The monthly electric share rose from 0% in April 2020 to 50.4% in December 2023. Electric trips were longer, with a median distance of 1.85 km versus 1.48 km (mean difference 0.49 km, 95% CI 0.49-0.49), and faster, with a median speed of 11.99 km/h versus 8.96 km/h (mean difference 3.22 km/h, 95% CI 3.21-3.23). The member share fell from 78.8% in 2018 to 58.8% in 2022 and recovered to 63.0% in 2023. Conclusions: Electric bicycle trips expanded from a negligible share of ridership to half of monthly trips by December 2023 and consistently covered longer distances at higher speeds than non-electric trips.
Keywords
bicycle sharing, electric bicycle, micromobility, travel behavior, trip distance, urban mobility
INTRODUCTION
Electric bicycles combine pedal power with electric assistance and reduce the effort required for longer, faster or hillier journeys. Fishman and Cherry(1) reviewed the first decade of research on the mode and documented its shift from a niche product toward a mainstream transport option, a transition driven by falling battery costs and rising urban congestion.
Station-based bike-share operators began adding electric bicycles to their fleets during the late 2010s, a change intended to widen the reach of shared cycling, to attract riders who would otherwise drive, and to raise trip speeds and distances.(1,2)
Trip distance and speed matter for three reasons: they determine the energy and health benefits of a ride, they shape how the mode substitutes for car travel, and they condition the design of lanes and stations. Electrification has since become a central feature of shared micromobility policy, because electric fleets promise larger carbon and car-replacement benefits than conventional fleets.(3,4)
Because these systems publish trip-level records openly, they offer a direct and complete way to measure how electrification changed ridership at the scale of a whole network. Capital Bikeshare, the station-based system serving Washington, DC and its Virginia and Maryland suburbs, is one of the largest such systems in the United States and has been examined as a benchmark for utilization and demand dynamics.(5)
Comparisons between conventional and electric bike-share schemes in several cities show that the two vehicle types tend to serve different trips, which makes the distinction between them analytically relevant.(6)
The system spans a dense central city and lower-density suburban counties in Virginia and Maryland, and its public files cover the conventional-only years and the electric years in one continuous series. The open monthly files therefore allow the electric share, the distance and the speed of trips to be reconstructed year by year without sampling or survey instruments.
The evidence on how electric trips differ from conventional trips is growing but still fragmentary. Li et al.(7) found that dockless shared e-bikes covered longer distances and reached higher speeds than shared conventional bikes.
Xie et al.(8) reported that e-bike usage in New York City differed from regular bike usage in distance, duration and speed, and Yang et al.(9) identified separate use patterns for e-bikes and conventional bicycles in the Richmond, Virginia system.
Shared electric bicycles in Chicago also showed distinctive spatiotemporal patterns and carbon implications,(10) and field measurements confirm that electric bicycles operate at higher speeds than conventional bicycles on the same infrastructure.(11)
In station-based systems specifically, the open question is whether electric assistance lengthens trips enough to justify the added cost and weight of the electric fleet, and whether it raises the operating speed of the network as a whole.
What remains less documented is the multi-year trajectory of electrification within a single station-based system. Most available studies are cross-sectional, cover dockless fleets, or observe a single season or year, and meta-analytic work on shared micromobility has concentrated on the determinants of ridership rather than on the trajectory of electric share over time.(12)
The introduction of e-bikes has been linked to changes in overall bike-share usage,(13) and member and casual riders are known to respond differently to system changes and to disruptions such as the pandemic.(14,15)
Mode interactions complicate the picture further, because the arrival of one micromobility service can reshape demand for another.(16)
The Washington case is also well suited to separating the pandemic effect from the electrification effect, because the electric ramp began in the same months as the pandemic disruption, and both forces acted on the same trip records. The present analysis treats the trajectory descriptively, without attempting to attribute each monthly change to a single cause.
The aim of this study was to describe the evolution of electric bicycle use, defined by the share of trips, trip distance and speed, and of member versus casual ridership, in Capital Bikeshare between 2018 and 2023. We hypothesized that the electric share rose over the period and that electric trips were longer and faster than non-electric trips.
METHODS
Design and period
Retrospective longitudinal analysis of routine trip-level administrative records published by Capital Bikeshare, a station-based bike-share system serving the Washington, DC metropolitan area. Records covered January 2018 through December 2023. The proposed window was retained in full for total ridership and for member versus casual use, and it was adjusted for the electric-specific outcomes because the open data identify electric bicycles only from April 2020, when the rideable_type field replaced the legacy schema.
Electric share, trip distance and speed were therefore computed from April 2020 to December 2023. The study followed the STROBE recommendations for observational studies and the RECORD extension for routinely collected data. The design is descriptive and observational, and no causal interpretation of the association between vehicle type and trip characteristics is intended beyond the descriptive comparison of two vehicle types within one system.
Data source
Monthly trip files were downloaded automatically, without login, from the Capital Bikeshare system data repository.(17) Seventy-two files were retrieved, one per month from January 2018 to December 2023, from the public Amazon S3 storage of the system, using the stable monthly naming convention of the repository, and every file was validated as downloadable before analysis.
The compressed monthly archives ranged from about 3 to 18 megabytes and each contained a single comma-separated trip table. Files from January 2018 to March 2020 follow a legacy schema with the fields duration, start and end date, start and end station, bike number and member type. Files from April 2020 onward follow a modern schema with ride_id, rideable_type, started_at, ended_at, station identifiers and coordinates, and member_casual.
The transition between the two schemas is a change in the published data format rather than a behavioral change, and it defines the earliest month in which electric bicycles can be separated from conventional ones. The records are aggregated and anonymized at source and contain no personal identifiers.
Variables and processing
The rideable_type field was classified into electric bicycles (electric_bike) and non-electric bicycles, which combined the classic_bike and docked_bike labels used by the operator for conventional pedal bicycles. The member_casual field and the legacy member type field were classified into members and casual riders. Trip distance in kilometers was computed as the haversine distance between the start and end station coordinates, that is, the great-circle distance over the mean Earth radius of 6371 km. Trip duration in minutes was computed as the difference between the end and start timestamps, and trip speed in kilometers per hour was computed as distance divided by duration.
Coordinates were required to fall within the service area bounds of 38.4 to 39.4 degrees latitude and -77.7 to -76.6 degrees longitude. Records with missing coordinates or coordinates outside those bounds were excluded from the distance and speed outcomes, and records with a computed distance above 150 km, a duration of zero or above 1440 minutes, or a speed above 60 km/h were treated as data errors and excluded.
Speed was computed only for trips with a distance of at least 0.05 km, so that station round trips with near-zero distance did not enter the speed distribution. A trip was defined as a single rider record between a start and an end station, and the published files contain rider trips only, not the operator rebalancing movements that relocate bicycles without a rider. The coordinate precision of the modern schema is sufficient for station-level distance calculation, and no trip-level geolocation beyond the start and end stations is available in the public files.
Data quality
Every record in the modern schema carried one of the three operator labels, so no trip was lost to an unclassified bicycle type. Records with missing coordinates or implausible timestamps were removed only from the affected distance and speed outcomes, while the counts reported for trip volume and shares used the complete file contents.
The two schemas were handled with separate parsers, and the monthly series was checked for continuity across the 72 files before aggregation; the two schema periods join without any gap between March 2020 and April 2020. No imputation was performed, and missing values were handled by restriction to the relevant outcome. The exclusion thresholds and the definitions of the analytic variables were fixed in a written protocol before the analysis and were not revised after the results were examined, so the cleaning rules did not adapt to the observed distributions.
Statistical analysis
Trips were aggregated by calendar month and year. The electric share was defined as the number of electric trips divided by the number of electric and non-electric trips, and the member share as the number of member trips divided by the number of member and casual trips. The annual electric share for 2020 refers to April through December 2020. Because trip distance and speed are right-skewed, they were summarized with the median and interquartile range, and the mean and standard deviation were added for comparability with previous studies.
The mean difference between electric and non-electric trips was estimated with its 95% confidence interval using a normal approximation, which is appropriate for samples of this size. Turning points were defined as the first month in which the monthly electric share reached 10%, 25% and 50%, so that the trajectory could be described with concrete calendar dates rather than with vague qualifiers.
Monthly aggregation was used because it preserves the temporal resolution needed to identify turning points while smoothing day-to-day noise, and no seasonal adjustment was applied because the aim was a descriptive trajectory rather than a causal decomposition. As a sensitivity analysis, the pooled electric share was also computed for 2021 through 2023, excluding the first partial year of electrification.
A significance level of 0.05 was used, and effect sizes with confidence intervals were reported rather than p values alone. The RECORD checklist was applied to the routine data elements: the source population, the period and the eligibility of records are stated, the code lists for the bicycle-type and user-type variables are described, and the cleaning rules that transform raw records into the analytic set are listed.
RESULTS
Trip volume and user mix from 2018 to 2023
Between January 2018 and December 2023 the system recorded 19,851,054 trips (Table 1). Annual volume moved from 3,542,684 trips in 2018 to 3,398,417 in 2019, declined to 2,215,956 in 2020, and then rose from 2,749,881 in 2021 through 3,476,782 in 2022 to 4,467,334 in 2023, the highest annual volume of the period.
The year 2020 was the only year below 3 million trips. The 2018 volume of 3,542,684 trips remained the highest single-year volume until 2023 surpassed it. Monthly volume ranged from 74,513 trips in April 2020 to 491,084 trips in October 2023. The member share rose from 78.8% in 2018 to 87.0% in 2019, declined to 62.6% in 2020, reached its lowest annual value of 58.8% in 2022, and recovered to 63.0% in 2023.
The member share fell below 50% in June 2020, reaching 45.7%, and it peaked at 94.6% in January 2020. Over the whole period 13,629,548 trips were made by members and 6,221,506 by casual riders. Monthly volume followed a seasonal pattern with summer peaks in most years, a pattern that was interrupted in 2020 and re-established from 2021 onward. The monthly pattern of trip volume and member share moved together with the pandemic disruption and its aftermath (Figure 1).
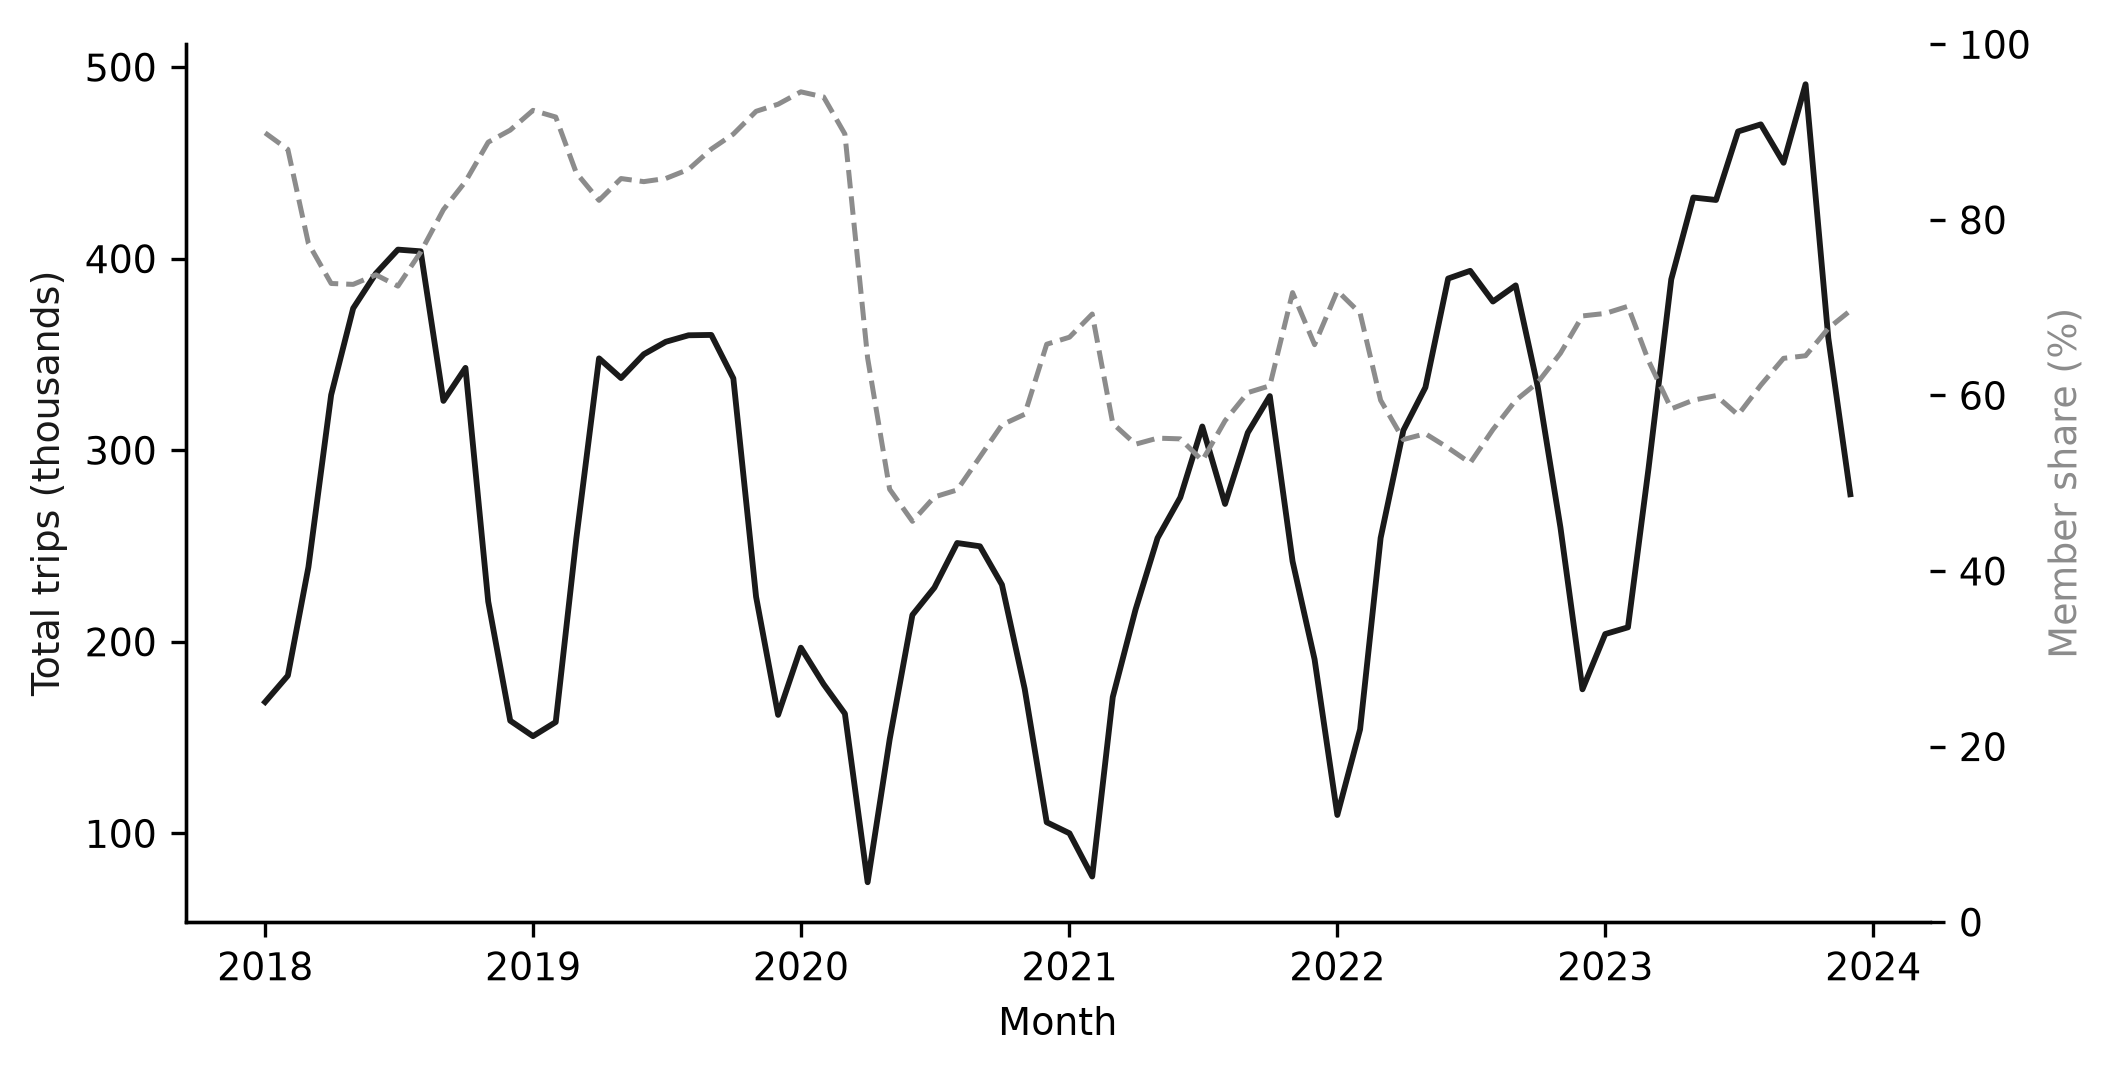
Figure 1. Monthly trip volume and member share, Capital Bikeshare, January 2018 to December 2023.
Note: Solid line shows total trips on the left axis; dashed line shows member share on the right axis.Electric bicycle share from April 2020 to December 2023
Between April 2020 and December 2023 the system recorded 12,372,553 trips, of which 2,683,227 were made on electric bicycles, an overall electric share of 21.7% (Table 2). The first electric trips appeared in June 2020. The monthly electric share rose from 0% in April 2020 to 50.4% in December 2023, passing 10% in August 2020, 25% in December 2020 and 50% in December 2023 (Figure 2).
The annual electric share rose from 14.2% in 2020 to 19.0% in 2021, declined to 15.0% in 2022, and accelerated to 31.3% in 2023 (Table 1). Electric trip counts moved in the same direction, from 239,076 in 2020 to 522,810 in 2021, then 520,965 in 2022, before rising to 1,400,376 in 2023. The 1,400,376 electric trips recorded in 2023 exceeded the 1,282,851 electric trips recorded across 2020, 2021 and 2022 combined. When the partial first year was excluded, the pooled electric share for 2021 through 2023 was 22.9%, based on 2,444,151 electric trips. The monthly series was not monotonic: the share moved within a narrower band through 2021 and 2022 before the 2023 acceleration.
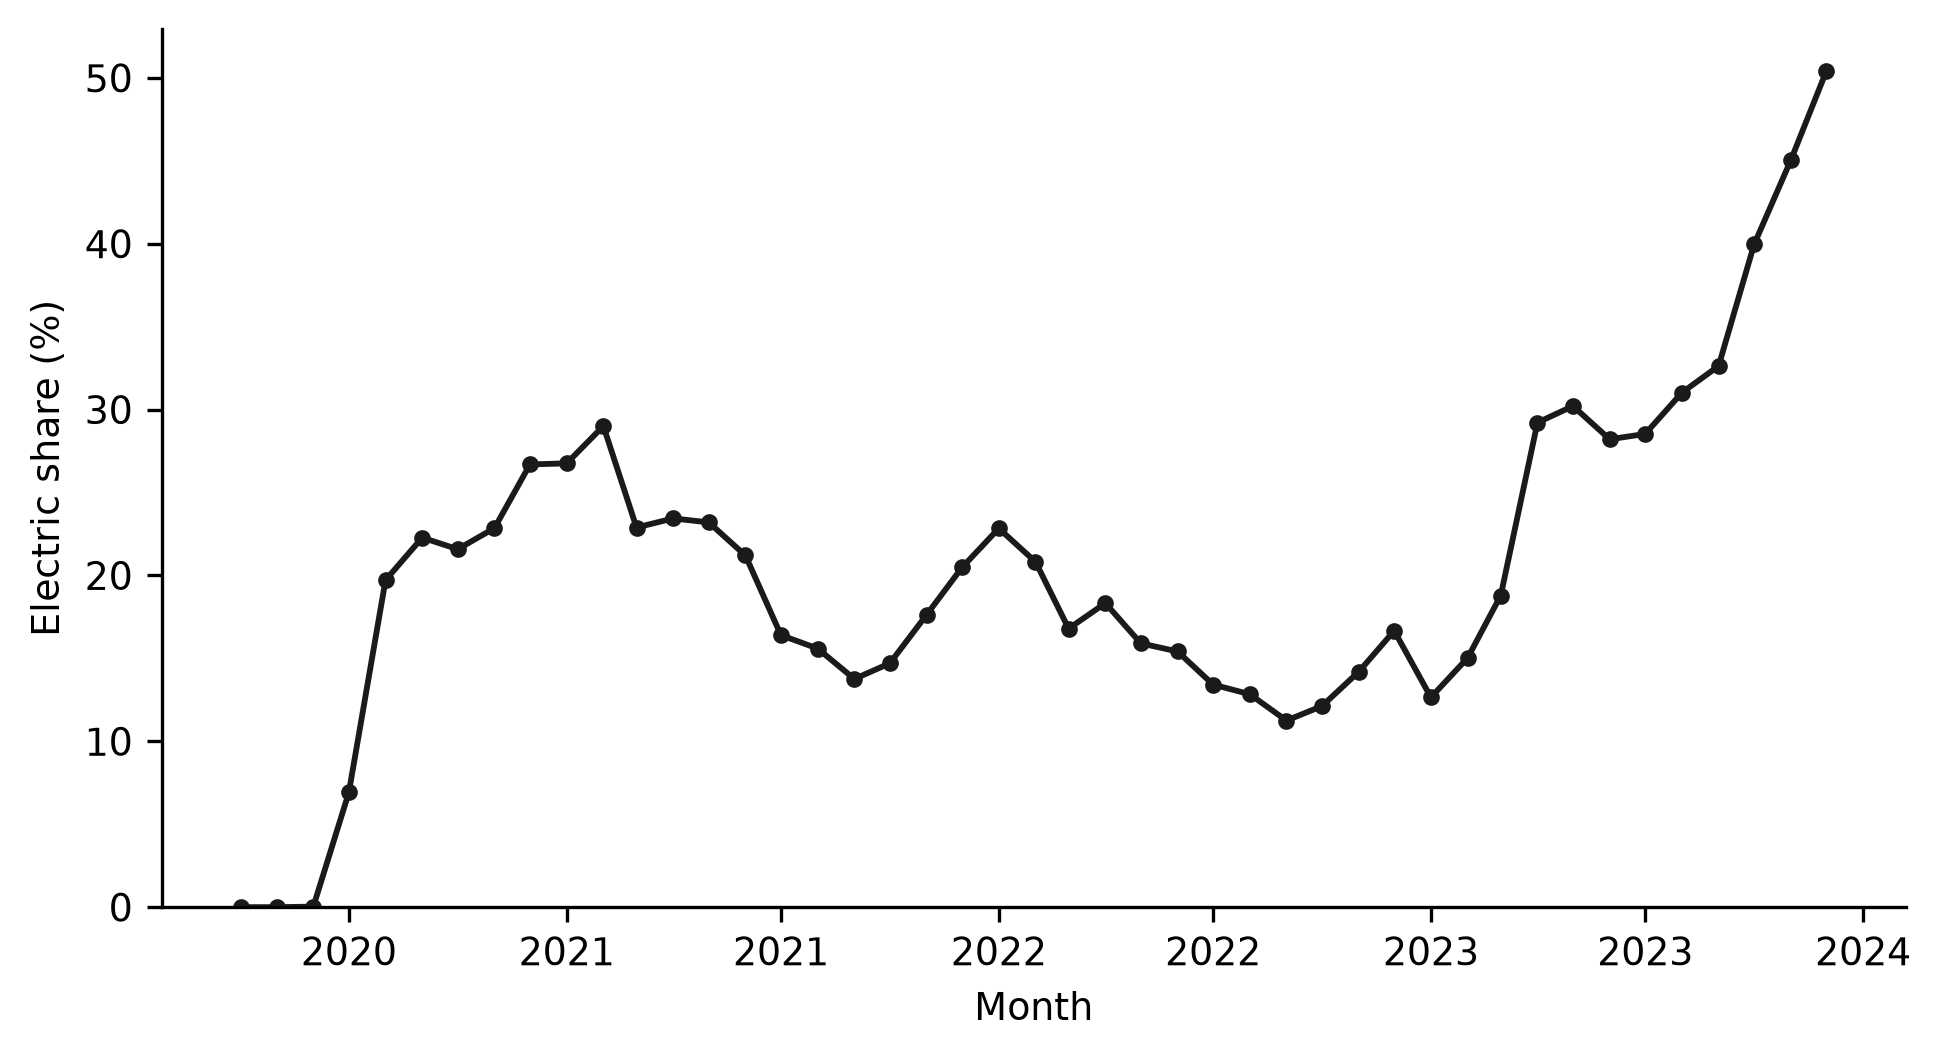
Figure 2. Monthly share of electric bicycle trips, Capital Bikeshare, April 2020 to December 2023.
Note: Share computed as electric trips divided by electric and non-electric trips per month.Trip distance and speed by bicycle type from 2020 to 2023
Electric trips were longer than non-electric trips between April 2020 and December 2023 (Table 2). The median distance was 1.85 km for electric bicycles and 1.48 km for non-electric bicycles, with interquartile ranges of 0.99 to 3.09 km and 0.85 to 2.38 km. The mean distance was 2.26 km versus 1.77 km, with standard deviations of 1.88 km and 1.40 km, a mean difference of 0.49 km (95% CI 0.49-0.49).
Electric trips were also faster: the median speed was 11.99 km/h versus 8.96 km/h, with interquartile ranges of 8.64 to 15.17 km/h and 6.49 to 11.14 km/h, and the mean speed was 11.92 km/h versus 8.70 km/h, a mean difference of 3.22 km/h (95% CI 3.21-3.23). Between 2020 and 2023 the median distance of electric trips declined from 2.12 km to 1.73 km, while the median distance of non-electric trips moved from 1.53 km to 1.43 km, and the median speed of electric trips rose from 11.35 km/h to 12.14 km/h (Figure 3). The median speed of non-electric trips changed little over the same years, moving from 8.84 km/h to 9.05 km/h (Table 1).

Figure 3. Monthly median trip distance by bicycle type, Capital Bikeshare, April 2020 to December 2023.
Note: Median haversine distance between start and end station for electric and non-electric trips.Electric bicycle use by membership status from 2020 to 2023
The member share of electric trips was 59.4%, close to the 59.7% recorded for non-electric trips (Table 2). Of the 2,683,227 electric trips, 1,592,561 were made by members and 1,090,666 by casual riders, so members supplied the larger part of electric ridership.
Characteristic | Electric bicycle | Non-electric bicycle | All trips |
|---|---|---|---|
Trips (n) | 2,683,227 | 9,689,326 | 12,372,553 |
Share of trips (%) | 21.7 | 78.3 | 100.0 |
Median distance (P25-P75), km | 1.85 (0.99-3.09) | 1.48 (0.85-2.38) | 1.54 (0.87-2.52) |
Mean distance ± SD, km | 2.26 ± 1.88 | 1.77 ± 1.40 | 1.88 ± 1.53 |
Median speed (P25-P75), km/h | 11.99 (8.64-15.17) | 8.96 (6.49-11.14) | 9.41 (6.80-11.92) |
Mean speed ± SD, km/h | 11.92 ± 5.42 | 8.70 ± 3.64 | 9.39 ± 4.30 |
Member share (%) | 59.4 | 59.7 | 59.7 |
Note: SD = standard deviation; P25-P75 = interquartile range. Distance and speed computed for trips with valid start and end coordinates; speed additionally excludes trips shorter than 0.05 km or longer than 24 hours.
Year | Total trips (n) | Member share (%) | Electric share (%) | Median distance electric (km) | Median distance non-electric (km) | Median speed electric (km/h) | Median speed non-electric (km/h) |
|---|---|---|---|---|---|---|---|
2018 | 3,542,684 | 78.8 | NR | NR | NR | NR | NR |
2019 | 3,398,417 | 87.0 | NR | NR | NR | NR | NR |
2020 | 2,215,956 | 62.6 | 14.2 | 2.1 | 1.5 | 11.3 | 8.8 |
2021 | 2,749,881 | 59.4 | 19.0 | 2.1 | 1.5 | 11.7 | 8.9 |
2022 | 3,476,782 | 58.8 | 15.0 | 1.9 | 1.5 | 12.1 | 8.9 |
2023 | 4,467,334 | 63.0 | 31.3 | 1.7 | 1.4 | 12.1 | 9.1 |
Note: NR = not recorded; the rideable_type field was introduced in April 2020. Electric share and median distance and speed for 2020 refer to April to December 2020. Medians computed from geolocated trips.
DISCUSSION
The aim of this study was to trace how electric bicycle use evolved within a single station-based bike-share system over six years. The results describe a three-phase trajectory: a negligible electric share through the first half of 2020, a rapid ramp to about a quarter of trips by December 2020, and a slower phase that dipped in 2022 before accelerating to half of monthly trips by December 2023.
Electric trips were consistently longer and faster than non-electric trips, and the user mix shifted toward casual riders after the pandemic onset. Taken together, the trajectory indicates that electrification changed the geometry of shared cycling, and that its pace was set by fleet, pricing and external disruptions as much as by the technology itself.
The contribution is empirical rather than theoretical: the study quantifies the full trajectory with a reproducible pipeline and situates it against the estimates available for other systems. Each of the three objectives, the electric share, the distance and speed contrast, and the member-casual evolution, is addressed below in turn and then compared with the corresponding literature.
The expansion of the electric share is consistent with reports from other systems, although the pace and the baseline differ. Li et al.(13) associated the introduction of e-bike sharing with a rise in overall bike-share usage, and Julio and Monzon(18) described a successful long-term e-bike-sharing system in which electrification became a key driver of ridership. In Chicago, shared electric bike trips formed a large and growing share of micromobility activity,(10) and in New York City e-bikes changed the distance and duration profile of the fleet.(8)
The Washington pattern differed in one respect: the electric share declined between 2021 and 2022 even as total trips grew, a dip that reflects a stable electric trip count alongside a growing conventional fleet rather than a retreat of electrification itself.
National evidence from the Netherlands shows strong e-bike growth from a different baseline,(4) and comparative studies likewise find that the spatiotemporal patterns of e-bike sharing diverge from those of conventional bike sharing.(19,20)
Dockless e-bike-share in Sacramento expanded partly through substitution from other modes rather than through new demand alone.(21)
This body of evidence suggests that the saturation point of the electric share depends on the local fleet, geography and market rather than on a universal ceiling. The contrast between the annual electric share and the December 2023 peak also shows that point-in-time snapshots can overstate the average level of electrification across a whole year, which is a useful caution when single-month estimates are compared between cities.
The station-based comparators in New York, Chicago and Richmond reached different electric shares under different fleet policies, which supports the same reading: electrification is a local operating decision before it is a global trend.(8-10)
The distance and speed findings agree with comparisons made in dockless and station-based settings. Li et al.(7) reported that shared e-bikes covered longer distances than shared conventional bikes, and Yang et al.(9) found that e-bike users in Richmond concentrated their trips differently from conventional users.
The higher speed of electric trips is consistent with field measurements of operating speed, in which e-bikes run faster than conventional bicycles on the same infrastructure.(11)
The observed decline in the median electric trip distance between 2020 and 2023 is plausible as the mode generalized from early adopters, who may have used it for longer cross-city trips, to a broader ridership, a pattern that mirrors the maturation described for e-bike-sharing demand.(22,23)
Spatial and efficiency analyses likewise show that electric and conventional link flows respond to different urban determinants and that electric fleet utilization follows its own spatial logic.(24,25)
Because the station network, the pricing and the fleet were common to both vehicle types, the residual difference in distance and speed can be attributed to the electric assistance itself rather than to the service context. The higher operating speed of electric bicycles also has infrastructure implications, since faster shared riders share lanes and paths with slower conventional cyclists.(11)
The difference in distance was modest in absolute terms but large relative to the short median trip of the network, which is consistent with the view that electric assistance is most valuable for trips at the upper end of the bike-share distance range.
The station-based setting may also explain why the distance advantage was more modest than the differences reported for dockless fleets. Dockless shared e-bikes operate in larger service zones and are often used for longer point-to-point trips, whereas station-based trips are constrained by the spacing of stations and by the need to dock.(7)
The presence of competing micromobility services matters as well: the arrival of e-scooters reshaped conventional bike-share demand in Chicago,(16) and similar competition could have moderated electric ridership in Washington during the study period. Comparisons of conventional and electric schemes in other cities likewise caution that the vehicle-type contrast is entangled with the service model and the local market.(6)
The shift in the user mix followed the pandemic rather than electrification itself. The member share fell from 87.0% in 2019 to 58.8% in 2022 and recovered only partially by 2023, and electric and non-electric trips had nearly identical member shares.
Wang et al.(15) documented that members and casual users in New York City follow different usage patterns, and membership status moderated the pandemic response of bike-share systems across US cities.(14)
Subscription and casual customers also differ in their sensitivity to weather and pricing.(26,27) For Washington specifically, Kalambay and Pulugurtha(28) described a before-after change in ridership after the outbreak, and the pandemic reshaped the monthly pattern of usage in the region.(29)
The near-identical member share of electric and non-electric trips is notable because it implies that electrification did not, by itself, tilt the system toward one user group; the user composition changed because of the pandemic and only later stabilized. Differences between subscribers and casual riders in Boston, where the two groups responded to the same service conditions with different trip frequencies, reinforce the point that user type is a distinct axis of behavior from vehicle type.(27)
The pre-2020 baseline shows a heavily subscription-based system, with member shares of 78.8% in 2018 and 87.0% in 2019. Because the decline in that share unfolded in the same months as the pandemic and the electric ramp, the trip data alone cannot separate the two influences; the near-identical member share of electric and non-electric trips is the cleaner evidence that vehicle type was not the driver of the user-mix change. The similarity of the two member shares also matters for equity assessments, because it implies that electrification did not create a distinct, more privileged user profile within the system.
Several mechanisms can explain the trajectory. Fleet decisions by the operator, including the share of electric bicycles deployed and their battery range, set the ceiling for electric ridership.(2,13)
Pricing and membership rules influence who uses electric bicycles, and Fukushige et al.(21) showed that e-bike-share can draw trips from walking, transit and private bicycles rather than only adding new demand.
Weather sensitivity and transit disruptions also modulate demand in this system,(30,31) which may explain part of the 2022 dip independently of fleet composition. Optimizing the placement and rebalancing of electric fleets is itself a determinant of realized demand,(32) and adoption and segmentation studies identify cost, infrastructure and user profiles as the barriers and levers that operators control.(33,34)
The timing of the first electric trips in June 2020 also means that the ramp coincided with the pandemic recovery, so part of the early electric growth may have absorbed trips that would otherwise have been taken on conventional bicycles or on transit.
Battery range and the reliability of charging further constrain how many electric trips a fleet can serve in a day, and operators that expand charging or battery-swapping capacity raise the effective ceiling on electric ridership.(2,32) The 2022 dip is therefore best read as an operational plateau in the electric fleet rather than as a fall in rider preference for electric bicycles.
This study has strengths that follow from its design. It used the complete trip history of a large station-based system over six years, with a reproducible open-data pipeline and no sampling, which gives exact counts and narrow confidence intervals for the distance and speed differences. The station-based setting also keeps the comparison between electric and non-electric trips within one network and one pricing structure, and the sensitivity analysis showed that excluding the partial first year did not change the overall picture.
The six-year window also spans both data schemas, which allowed the member-share trajectory to be anchored to the conventional-only years before electrification. The use of published system data makes the estimates independently reproducible by other researchers, and the monthly indicators computed here, electric share, trip distance and speed, can be produced for any station-based system that publishes equivalent open files.
The main limitation is that electric bicycles cannot be identified before April 2020 because the legacy schema lacks a bicycle-type field, so the pre-2020 electric era is not captured and the trajectory begins after the first electric deployment. Second, distance is the straight-line separation between stations, which underestimates the traveled route and cannot distinguish detours, and speed inherits that same approximation; the values are therefore lower bounds for traveled distance and route speed.
Third, the records contain no rider-level covariates, so age, income and trip purpose cannot be examined, and causal claims are not warranted. Fourth, the findings describe a single US system and may not transfer to dockless fleets or to cities with different topography and pricing. Each limitation suggests a remedy: earlier operator records or other systems could extend the series backward, GPS-based traces would refine route distance and speed, and linked surveys would add rider characteristics to the trip-level evidence. Replicating the same monthly indicators in other station-based systems with open data would show how much of the Washington trajectory reflects local conditions.
For operators and public agencies, the results support three practical points. Electrification can raise both the share of trips on shared bicycles and their average speed, which strengthens the case for electric fleets in hilly or spread-out networks. The member-casual mix and the 2022 dip also show that fleet composition alone does not determine ridership, so capacity, pricing and reliability decisions should accompany any electric expansion.
Because electric trips are longer and faster, the equity, health and carbon benefits of electrification concentrate in the networks where those trips replace motorized travel and extend active travel distance.(35-38)
Monitoring the electric share month by month, as this study does, gives operators a simple leading indicator of whether their electrification strategy is translating into use. For researchers, the same indicators provide a common yardstick for comparing electrification across systems, which would otherwise be measured with incompatible definitions and time windows. Because the electric and non-electric user profiles were similar, policies that subsidize access or membership are unlikely to redistribute electric benefits toward a single user group by themselves.
CONCLUSIONS
Electric bicycle use in Capital Bikeshare grew from a negligible share in early 2020 to half of monthly trips by December 2023, with an early ramp, a 2022 dip and a 2023 acceleration. Electric trips were longer and faster than non-electric trips throughout the period, although the distance advantage narrowed as electrification generalized. The annual electric share remained below the December peak, which indicates that the growth was concentrated in the later months of the series.
Member and casual ridership shifted during the pandemic and recovered only partially, while electric and non-electric trips attracted similar member shares. The trajectory shows that electrification changed the geometry of shared cycling, and that its pace depended on fleet, pricing and external disruptions as much as on the technology itself. Operators that monitor the monthly electric share can use the same indicators to judge whether their electrification decisions are translating into use.
References
- 1 Fishman E, Cherry C. E-bikes in the Mainstream: Reviewing a Decade of Research. Transport Reviews. 2016;36(1):72-91. doi: 10.1080/01441647.2015.1069907
- 2 Kontar W, Ahn S, Hicks A. Electric bicycles sharing: opportunities and environmental impacts. Environ Res: Infrastruct Sustain. 2022;2(3):035006. doi: 10.1088/2634-4505/ac7c8b
- 3 Tozluoğlu Ç, Liao Y, Sprei F. Potential of e-bikes to replace passenger car trips and reduce greenhouse gas emissions. Journal of Cycling and Micromobility Research. 2024;2:100043. doi: 10.1016/j.jcmr.2024.100043
- 4 Huang B(, Wüst H, de Haas M. Assessing the E-bike trends and impact on sustainable mobility: A national-level study in the Netherlands. Journal of Cycling and Micromobility Research. 2024;2:100027. doi: 10.1016/j.jcmr.2024.100027
- 5 Sadeghvaziri E, Javid R, Constantin N. Analyzing the Influential Factors and Dynamics of Bikeshare Utilization in Washington, DC. International Conference on Transportation and Development 2024. 2024:304-313. doi: 10.1061/9780784485521.028
- 6 Budd L, Ison S. Conventional and electric Bike Share Schemes (BSS) and urban mobility. Transportation Planning and Technology. 2024;47(6):831-833. doi: 10.1080/03081060.2024.2371181
- 7 Li Q, Zhang E, Luca D, Fuerst F. The travel pattern difference in dockless micro-mobility: Shared e-bikes versus shared bikes. Transportation Research Part D: Transport and Environment. 2024;130:104179. doi: 10.1016/j.trd.2024.104179
- 8 Xie Y, Smart M, Noland RB. Powering bikeshare in New York City: does the usage of e-bikes differ from regular bikes?. Transportation Planning and Technology. 2024;47(6):875-902. doi: 10.1080/03081060.2024.2341301
- 9 Yang Y, Sloate E, Khadem N, Chavis C, Frías-Martínez V. Comparing e-bike and conventional bicycle use patterns in a public bike share system: A case study of Richmond, VA. Journal of Cycling and Micromobility Research. 2024;2:100023. doi: 10.1016/j.jcmr.2024.100023
- 10 Xie J, Xiao Z. Spatiotemporal Patterns and Carbon Emissions of Shared-Electric-Bike Trips in Chicago. J geovis spat anal. 2024;8(1):13. doi: 10.1007/s41651-024-00171-7
- 11 Hassanpour A, Bigazzi A. Operating speed distributions in off-street cycling facilities by vehicle type and motorization. Journal of Cycling and Micromobility Research. 2024;2:100021. doi: 10.1016/j.jcmr.2024.100021
- 12 Ghaffar A, Hyland M, Saphores JD. Meta-analysis of shared micromobility ridership determinants. Transportation Research Part D: Transport and Environment. 2023;121:103847. doi: 10.1016/j.trd.2023.103847
- 13 Li Q, Luca D, Fuerst F, Wei Z. Success in tandem? The impact of the introduction of e-bike sharing on bike sharing usage. Research in Transportation Economics. 2024;107:101476. doi: 10.1016/j.retrec.2024.101476
- 14 Vo T, Barbour N, Palaio L, Maness M. Impacts of the COVID-19 Pandemic on Bikeshare Usage by Rider Membership Status Across Selected U.S. Cities. Transportation Research Record: Journal of the Transportation Research Board. 2023;2677(4):547-561. doi: 10.1177/03611981221131542
- 15 Wang K, Yan X, Zhu Z, Chen X(. Understanding bike-sharing usage patterns of members and casual users: A case study in New York City. Travel Behaviour and Society. 2024;36:100793. doi: 10.1016/j.tbs.2024.100793
- 16 Yang H, Huo J, Bao Y, Li X, Yang L, Cherry CR. Impact of e-scooter sharing on bike sharing in Chicago. Transportation Research Part A: Policy and Practice. 2021;154:23-36. doi: 10.1016/j.tra.2021.09.012
- 17 Capital Bikeshare. Capital Bikeshare trip history data [Internet]. 2024. Available from: https://capitalbikeshare.com/system-data
- 18 Julio R, Monzon A. Long term assessment of a successful e-bike-sharing system. Key drivers and impact on travel behaviour. Case Studies on Transport Policy. 2022;10(2):1299-1313. doi: 10.1016/j.cstp.2022.04.019
- 19 Chen Y, Xu S, Du M, Ma H, Wang S, Li F. COMPARING THE SPATIOTEMPORAL TRAVEL PATTERNS AND INFLUENCING FACTORS OF BIKE SHARING AND E-BIKE SHARING SYSTEMS. Int Arch Photogramm Remote Sens Spatial Inf Sci. 2023;XLVIII-1/W2-2023(1/W2-2023):339-345. doi: 10.5194/isprs-archives-xlviii-1-w2-2023-339-2023
- 20 Grau-Escolano J, Bassolas A, Vicens J. Cycling into the workshop: e-bike and m-bike mobility patterns for predictive maintenance in Barcelona’s bike-sharing system. EPJ Data Sci. 2024;13(1):48. doi: 10.1140/epjds/s13688-024-00486-x
- 21 Fukushige T, Fitch DT, Handy S. Factors influencing dock-less E-bike-share mode substitution: Evidence from Sacramento, California. Transportation Research Part D: Transport and Environment. 2021;99:102990. doi: 10.1016/j.trd.2021.102990
- 22 Zhang Z, Krishnakumari P, Schulte F, van Oort N. Improving the service of E-bike sharing by demand pattern analysis: A data-driven approach. Research in Transportation Economics. 2023;101:101340. doi: 10.1016/j.retrec.2023.101340
- 23 Schnieder M. Ebike Sharing vs. Bike Sharing: Demand Prediction Using Deep Neural Networks and Random Forests. Sustainability. 2023;15(18):13898. doi: 10.3390/su151813898
- 24 Jin ST, Sui DZ. A comparative analysis of the spatial determinants of e-bike and e-scooter sharing link flows. Journal of Transport Geography. 2024;119:103959. doi: 10.1016/j.jtrangeo.2024.103959
- 25 Shi Z, Wang J, Liu K, Liu Y, He M. Exploring the usage efficiency of electric bike-sharing from a spatial–temporal perspective. Transportation Research Part D: Transport and Environment. 2024;129:104139. doi: 10.1016/j.trd.2024.104139
- 26 Sinha RK. Subscription and casual customers’ differential sensitivity to meteorological characteristics. Journal of Retailing and Consumer Services. 2021;62:102663. doi: 10.1016/j.jretconser.2021.102663
- 27 Jiang L, Yang H, Zheng R, Huo J. The difference between customers and subscribers in Boston tourists using shared bicycles under COVID-19: Trip frequency and its determinants. 2021 6th International Conference on Transportation Information and Safety (ICTIS). 2021:300-305. doi: 10.1109/ictis54573.2021.9798632
- 28 Kalambay P, Pulugurtha SS. A before-after impact assessment of COVID-19 outbreak on bike-sharing ridership in Washington, DC. Urban, Planning and Transport Research. 2022;10(1):181-203. doi: 10.1080/21650020.2022.2077820
- 29 Wang H, Noland R. Changes in the Pattern of Bikeshare Usage due to the COVID-19 Pandemic. Findings. 2021;2021. doi: 10.32866/001c.18728
- 30 Kumar D. Meteorological barriers to bike rental demands: A case of Washington D.C. using NCA approach. Case Studies on Transport Policy. 2021;9(2):830-841. doi: 10.1016/j.cstp.2021.04.002
- 31 Jia J, Zhang H, Shi B. Exploring Bike-Sharing Behavior Affected by Public Transportation Disruption: Case of Washington, DC, Metro Shutdown. J Transp Eng, Part A: Systems. 2021;147(3):04020163. doi: 10.1061/jtepbs.0000495
- 32 Hosseini K, Stefaniec A, O'Mahony M, Caulfield B. Optimising shared electric mobility hubs: Insights from performance analysis and factors influencing riding demand. Case Studies on Transport Policy. 2023;13:101052. doi: 10.1016/j.cstp.2023.101052
- 33 Zabiulla M, Sahu PK, Bandhu Majumdar B. Exploring the Factors Influencing Electric Bicycle Adoption: A Survey Among Future Adopters in India. Transportation Research Record: Journal of the Transportation Research Board. 2024;2678(8):700-715. doi: 10.1177/03611981231220565
- 34 Mohiuddin H, Fitch-Polse DT, Handy SL. Examining market segmentation to increase bike-share use and enhance equity: The case of the greater Sacramento region. Transport Policy. 2024;145:279-290. doi: 10.1016/j.tranpol.2023.10.021
- 35 Dill J, Ma J, McNeil N, Broach J, MacArthur J. Factors influencing bike share among underserved populations: Evidence from three U.S. cities. Transportation Research Part D: Transport and Environment. 2022;112:103471. doi: 10.1016/j.trd.2022.103471
- 36 Hosseini K, Pramod Choudhari T, Stefaniec A, O’Mahony M, Caulfield B. E-bike to the future: Scalability, emission-saving, and eco-efficiency assessment of shared electric mobility hubs. Transportation Research Part D: Transport and Environment. 2024;133:104275. doi: 10.1016/j.trd.2024.104275
- 37 Yin A, Chen X, Behrendt F, Morris A, Liu X. How electric bikes reduce car use: A dual-mode ownership perspective. Transportation Research Part D: Transport and Environment. 2024;133:104304. doi: 10.1016/j.trd.2024.104304
- 38 Bini R, Collins B, Hunter J, Hunter N, McVicar J, Gordon B, et al. Associations between e-bike travel distance and changes in health. Journal of Transport and Health. 2024;39:101925. doi: 10.1016/j.jth.2024.101925
Declarations
Funding
No financing
Conflict of interest
None
Authorship contributions
Drafting – original draft: Manuel Iván Tostado Ramírez, Yasniel Sánchez Suárez, Rolando Eslava Zapata.
Writing–review and editing: Manuel Iván Tostado Ramírez, Yasniel Sánchez Suárez, Rolando Eslava Zapata.