

Abstract
Introduction: The COVID-19 pandemic collapsed public transit ridership in the United States, and recovery has been partial and uneven across the sector. Methods: Monthly unlinked passenger trips of every active Federal Transit Administration full reporter were obtained from the National Transit Database Complete Monthly Ridership dataset for 2019 to 2024 and aggregated by year, transit mode, agency size class and Federal Transit Administration region, with 2024 ridership expressed as a percentage of the 2019 baseline. Results: National ridership fell from 9,537.4 million trips in 2019 to a trough of 156.8 million in April 2020 and reached 7,552.9 million in 2024, a recovery of 79.2%. Recovery ranged across modes from 52.6% for commuter bus to 97.7% for demand response and 109.4% for bus rapid transit; bus recovered to 83.7% and heavy rail to 74.9%. Small agencies recovered to 91.6% and large agencies to 78.6%. Recovery ranged from 69.7% in the Great Lakes to 88.1% in the South Central region. Conclusions: Recovery was incomplete and markedly uneven, with rail and commuter-oriented modes and the largest agencies lagging while demand-responsive services and small agencies recovered most fully.
Keywords
public transportation, transit ridership, COVID-19, pandemic, transit agencies, urban mobility
INTRODUCTION
Public transit carried 9,537.4 million unlinked passenger trips in the United States in 2019, a volume concentrated in motor bus and heavy rail services that connect workers to central business districts and provide mobility to households without a car. Bus and heavy rail together supplied the large majority of those trips, while commuter rail, light rail and a set of smaller modes served narrower travel markets.
Because those two modes dominated the national total, their trajectories largely determined the national trajectory. The sector is also an instrument of social policy, because its riders are disproportionately low-income, people of color and people without access to an automobile, and because transit sustains the dense labor markets in which large cities are most productive. These social functions make the question of how quickly, and for whom, transit demand returns after a disruption a matter of both mobility policy and transport equity.
Ridership had already eroded during the 2010s, before the pandemic, when growth in private vehicle use and ride-hailing services, the suburbanization of jobs and housing, and declining service reliability were associated with sustained losses in several large systems.(1,2)
Longitudinal evidence across twenty-five North American cities attributed ridership growth primarily to service supply and fare policy, both of which tightened before the pandemic,(3) and transportation network companies displaced a measurable share of transit trips during the same period.(4) Scholars warned during those years that the sector faced a structural challenge to its traditional commute-oriented business model,(5) and peer-group comparisons showed that agencies of different sizes faced different ridership conditions.(6)
The COVID-19 pandemic interrupted this trajectory abruptly. Nationwide transit demand in the United States collapsed in the spring of 2020 as stay-at-home orders took effect, with system-level analyses documenting declines of more than seventy percent in the earliest weeks.(7)
Agencies responded with reduced service, rear-door boarding and enhanced cleaning, measures intended to limit contagion rather than to sustain patronage.(8)
Travel surveys confirmed that ridership losses were concentrated among higher-income, white-collar commuters able to telework, while lower-income riders continued to depend on transit for essential trips.(9)
Aggregated studies of the pandemic period estimated that public transit ridership fell more sharply and recovered more slowly than private car travel, a pattern explained by fear of contagion and by the withdrawal of a large share of commute demand.(10)
Recovery after the acute phase has been partial and unequal. Retrospective analyses of United States ridership through 2022 found national volumes still far below pre-pandemic levels, with recovery varying across systems and modes.(11,12)
Historical reviews of disruptive events indicate that transit ridership typically needs years to return to its prior trend after a shock, and the pandemic appears to follow that pattern.(13)
Mode-use evidence indicated that commuter rail and heavy rail lagged bus ridership, a pattern attributed to the persistence of remote work in office-oriented labor markets.(14,15)
Geographic evidence indicated that recovery also varied sharply across United States regions, with some metropolitan areas recovering far faster than others.(16) Shifting attitudes toward car ownership among former riders suggested that part of the loss may become permanent even as fear recedes.(17)
The incomplete recovery carries practical consequences: transit agencies faced a fiscal cliff as federal pandemic relief expired, and the size of the persistent ridership gap determines the scale of service that state and local governments can sustain.
Most of this evidence is drawn from single systems, individual modes or restricted regional samples, and no census-level comparison has quantified recovery simultaneously by transit mode, agency size and region through 2024. These three axes matter because they structure both the pre-pandemic ridership base and the pandemic shock.
Mode separates commute-oriented rail from neighborhood bus and paratransit service, agency size separates large legacy systems from smaller operators with different ridership composition, and region captures differences in employment structure and reopening policy across the country.
The objective of this study was to quantify the uneven recovery of public transit ridership in the United States by transit mode, agency size and region between 2019 and 2024, using the complete monthly ridership records of the Federal Transit Administration. We hypothesized that rail and commuter-oriented modes and the largest agencies would show slower and less complete recovery, whereas demand-responsive services and small agencies would recover more fully.
METHODS
Study design and period
This was a longitudinal ecological analysis of administrative records covering January 2019 through January 2024. The unit of observation was the agency, mode, type of service and month. Reporting followed the RECORD extension for studies conducted using routinely collected administrative data.(18)
Data source
The primary source was the Complete Monthly Ridership (with Adjustments and Estimates) dataset of the Federal Transit Administration National Transit Database, published on data.transportation.gov.(19)
The National Transit Database is the federal census of United States transit agencies, and its monthly module is completed by agencies that operate fixed-route or demand-responsive service in urbanized areas. The Complete Monthly Ridership dataset reports, for each agency, mode, type of service and month, the number of unlinked passenger trips, vehicles operated in maximum service, vehicle revenue miles and vehicle revenue hours, and it applies estimates and adjustments to incomplete reporting months.
This dataset was chosen over the companion Monthly Modal Time Series because it adds the Federal Transit Administration region and state fields that the regional contrast requires, while still carrying the fleet measure needed to construct agency size classes. Because the file is cumulative, it contains records from 2002 onward, and only the records from 2019 through 2024 were analyzed.
The dataset is a United States government work in the public domain, which permits unrestricted redistribution and reproduction of the figures derived from it. The download used the portal's open application programming interface, which requires no authentication, and the full file was retrieved as a single comma-separated export that can be reproduced from the public endpoint cited above. No linkage between datasets was performed, and the RECORD items on data source, access and processing are reported in this section.(18)
Three filters were applied before analysis. Records outside calendar years 2019 to 2024 were removed. Reporter types other than full reporters, namely reduced asset, small systems, rural, building and separate service reporters, were excluded because they follow annual rather than monthly reporting schedules and would compromise monthly comparability. Records marked inactive were also removed, so that only services operating in a given month contributed to that month's ridership. After these filters, the analysis included 83,830 agency, mode, type of service and month observations from 526 agencies and 18 modes.
Variables
The outcome was the annual sum of unlinked passenger trips, the standard National Transit Database measure of ridership that counts each boarding of a transit vehicle, with transfers counted as separate boardings. Transit mode was recorded with the National Transit Database mode codes and grouped into eleven named categories using the two-letter codes: motor bus (MB), heavy rail (HR), commuter rail (CR), light rail (LR), bus rapid transit (RB), commuter bus (CB), trolleybus (TB), streetcar (SR), demand response (DR), vanpool (VP) and ferryboat (FB).
The remaining minor modes, defined as monorail, cable car, hybrid rail, aerial tramway, inclined plane, Alaska Railroad and publico, were collapsed into an other-modes group because each represented less than one percent of 2019 ridership. Type of service, which distinguishes directly operated service from purchased transportation, was not used as a separate dimension because ridership is reported by mode regardless of the operating arrangement.
Agency size was defined as each agency's mean monthly vehicles operated in maximum service during 2019, summed across modes, a measure of the fleet an agency fields at peak service. Agencies were divided into terciles of this measure among the 475 agencies reporting in 2019, yielding small (35 vehicles or fewer), medium (92 vehicles or fewer) and large (more than 92 vehicles) classes.
Terciles were preferred over fixed thresholds because the fleet size distribution is heavily skewed, with a small number of very large rail and bus agencies dominating the right tail, and terciles ensure three classes of comparable agency count. Terciles also avoid imposing arbitrary fleet thresholds that may not correspond to any meaningful operational distinction.
Size was fixed at 2019 values so that the classification could not be influenced by service cuts made during the recovery period. The 51 agencies that entered the full reporter file after 2019 had no 2019 fleet measure and were excluded from the size-class analysis only, while remaining in the mode and region analyses.
Region was the ten-region administrative field of the Federal Transit Administration, which assigns each agency to one of ten regions covering the United States: New England, New York-New Jersey, Mid-Atlantic, Southeast, Great Lakes, South Central, Midwest, Mountain-Plains, West and Pacific Northwest. These regions group states and metropolitan areas for federal oversight, and they were used because they are the standard administrative geography for transit planning and funding.
Statistical analysis
Records were aggregated in three steps. First, monthly observations were summed within each agency, mode, type of service and month after the filters were applied. Second, annual totals were computed by summing the twelve months of 2019 and the twelve months of 2024. Third, these annual totals were collapsed to the mode, size class and region strata. The monthly national series used in the trajectory figure was computed by summing all included observations within each calendar month.
Annual unlinked passenger trips were summed for 2019 and for 2024, and the primary recovery measure was computed as the 2024 total divided by the 2019 total and expressed as a percentage. The depth of the 2020 collapse was computed as the minimum monthly ridership of the series divided by the mean monthly ridership of 2019. Contrasts across modes, size classes and regions are reported as absolute values in millions of trips followed by the relative recovery percentage, in line with the comparative design of the study. Differences between strata are expressed in percentage points.
Because the analysis covers the full census of active full reporters rather than a sample, estimates are not subject to sampling error and confidence intervals were not reported. This design follows the logic of descriptive census comparisons: the quantities of interest are population parameters of the reporting universe, and the appropriate summary is the recovery ratio and its differences across strata rather than an inferential test against a null hypothesis. Two sensitivity analyses repeated the national recovery estimate, first on a balanced panel of the 470 agencies that reported in both 2019 and 2024 and second on fixed-route modes only, excluding demand response and vanpool, which serve specialized trip purposes. All processing used Python with the pandas and matplotlib libraries, and figures were produced in grayscale at 300 dots per inch. The analysis script is deterministic and re-runnable from the downloaded file, and the results were reproduced by running it twice with identical outputs.
Ethical considerations
Only public, anonymized administrative data were used. The records contain no individual-level information, and no linkage to personal identifiers was attempted. The study did not involve human participants and required no ethics approval.
RESULTS
National trajectory and depth of the 2020 collapse
Unlinked passenger trips fell from 9,537.4 million in 2019 to 4,451.4 million in 2020, 46.7% of the 2019 level, and the national total remained below the 2019 baseline in every subsequent year (Figure 1).
The absolute volumes were 4,627.0 million in 2021, 5,990.0 million in 2022 and 6,904.2 million in 2023, an index of 48.5%, 62.8% and 72.4% of the 2019 level, respectively. By 2024 ridership had returned to 7,552.9 million trips, 79.2% of the 2019 baseline. The trough occurred in April 2020, when 156.8 million trips were recorded, 19.7% of the 2019 monthly mean.
Ridership recovered partially through the second half of 2020 as restrictions eased, but the 2020 annual total remained at 46.7% of 2019, and the recovery then flattened through 2021 before accelerating in 2022. Restricting the sample to the 470 agencies that reported in both 2019 and 2024 changed the estimate only slightly, to 78.9%, and excluding demand response and vanpool left the fixed-route recovery at 79.0%.
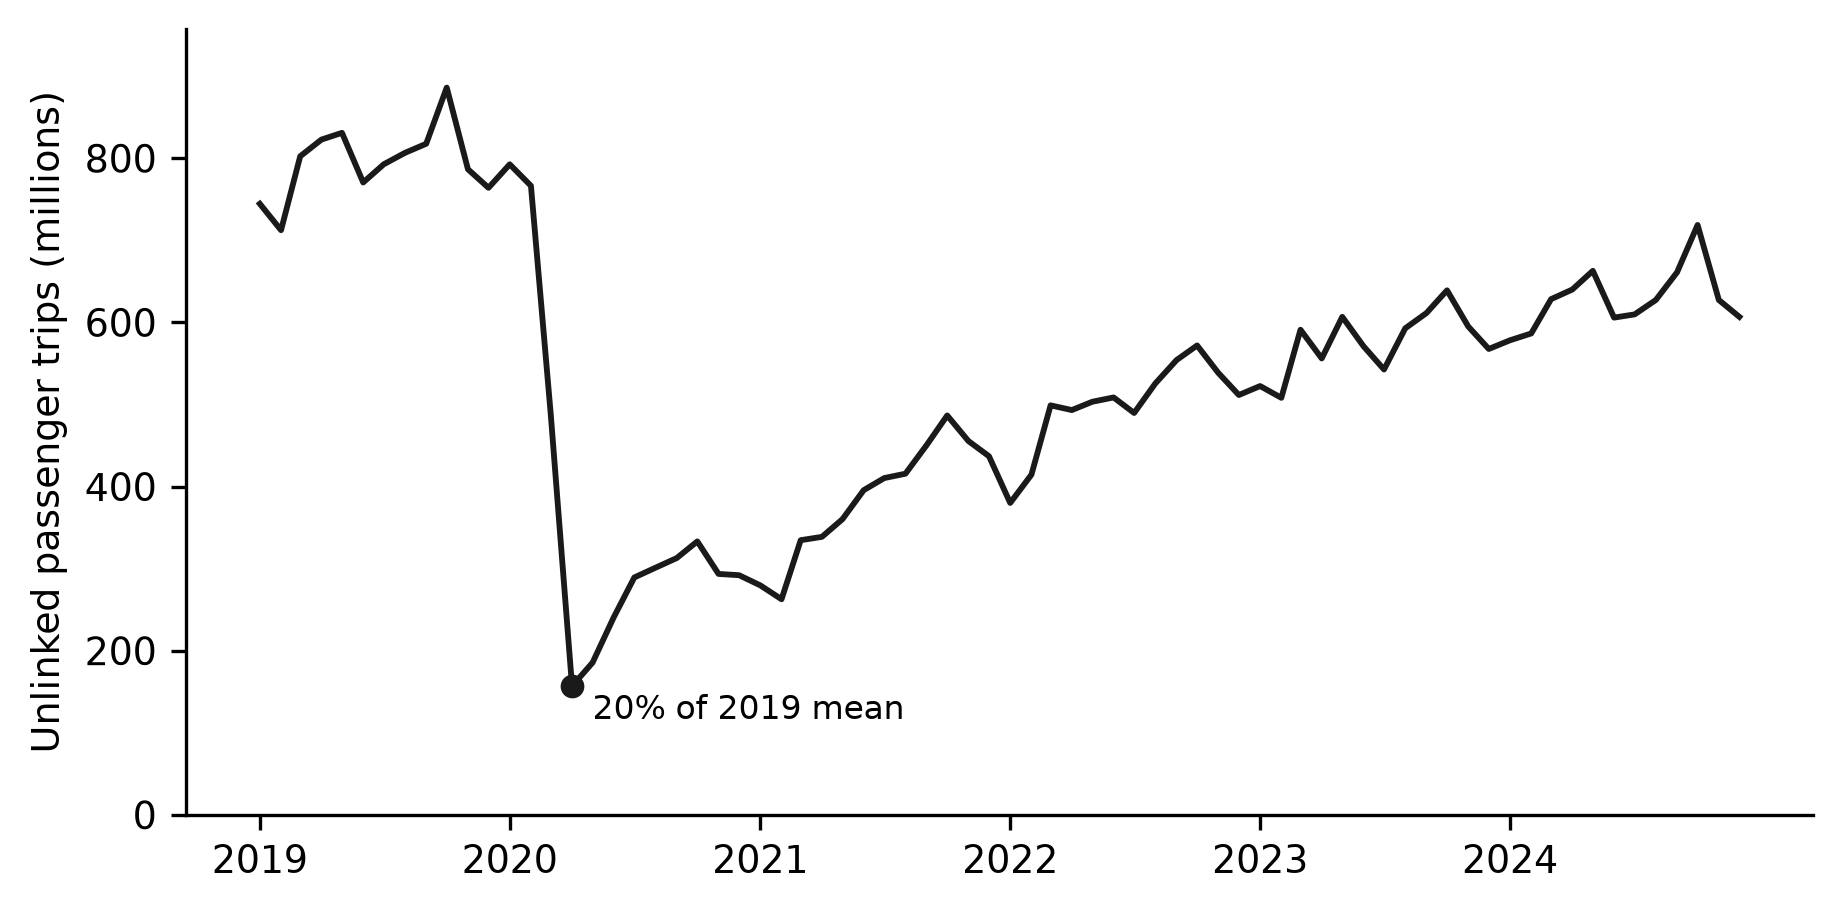
Figure 1. Monthly unlinked passenger trips in the United States.
Note: The point marks the April 2020 trough, expressed as a percentage of the 2019 monthly mean.Recovery by transit mode
Recovery by mode ranged from 52.6% for commuter bus to 97.7% for demand response and 109.4% for bus rapid transit (Table 1) (Figure 2). Bus ridership fell from 4,297.6 million trips in 2019 to 3,596.9 million in 2024 and recovered to 83.7%, whereas heavy rail fell from 3,804.4 million to 2,849.8 million trips and reached 74.9%, a gap of 8.8 percentage points.
Commuter rail fell from 505.1 million to 371.0 million trips and recovered to 73.4%, and light rail fell from 446.2 million to 326.1 million trips and recovered to 73.1%. Commuter bus fell from 60.0 million to 31.5 million trips and reached 52.6%, the largest relative loss of any fixed-route mode. By contrast, demand response recovered to 97.7% and bus rapid transit exceeded its 2019 baseline at 109.4%, the only fixed-route modes to regain or surpass their pre-pandemic volumes. Trolleybus recovered to 87.8%, streetcar to 84.4%, ferryboat to 89.8% and vanpool to 72.5%, and the residual other-modes group recovered to 57.0%. The other-modes group was dominated by publico service in Puerto Rico, which contracted sharply after 2019.
Mode | UPT 2019 (millions) | UPT 2024 (millions) | Change (millions) | Recovery (%) |
|---|---|---|---|---|
Bus | 4297.6 | 3596.9 | -700.7 | 83.7 |
Heavy rail | 3804.4 | 2849.8 | -954.6 | 74.9 |
Commuter rail | 505.1 | 371.0 | -134.1 | 73.4 |
Light rail | 446.2 | 326.1 | -120.1 | 73.1 |
Bus rapid transit | 63.6 | 69.6 | 6.0 | 109.4 |
Commuter bus | 60.0 | 31.5 | -28.5 | 52.6 |
Trolleybus | 73.7 | 64.7 | -9.0 | 87.8 |
Streetcar | 45.4 | 38.3 | -7.1 | 84.4 |
Demand response | 92.8 | 90.7 | -2.1 | 97.7 |
Vanpool | 31.3 | 22.7 | -8.6 | 72.5 |
Ferryboat | 75.7 | 68.0 | -7.7 | 89.8 |
Other modes | 41.6 | 23.7 | -17.9 | 57.0 |
Note: UPT = unlinked passenger trips; recovery = 2024 UPT / 2019 UPT x 100.
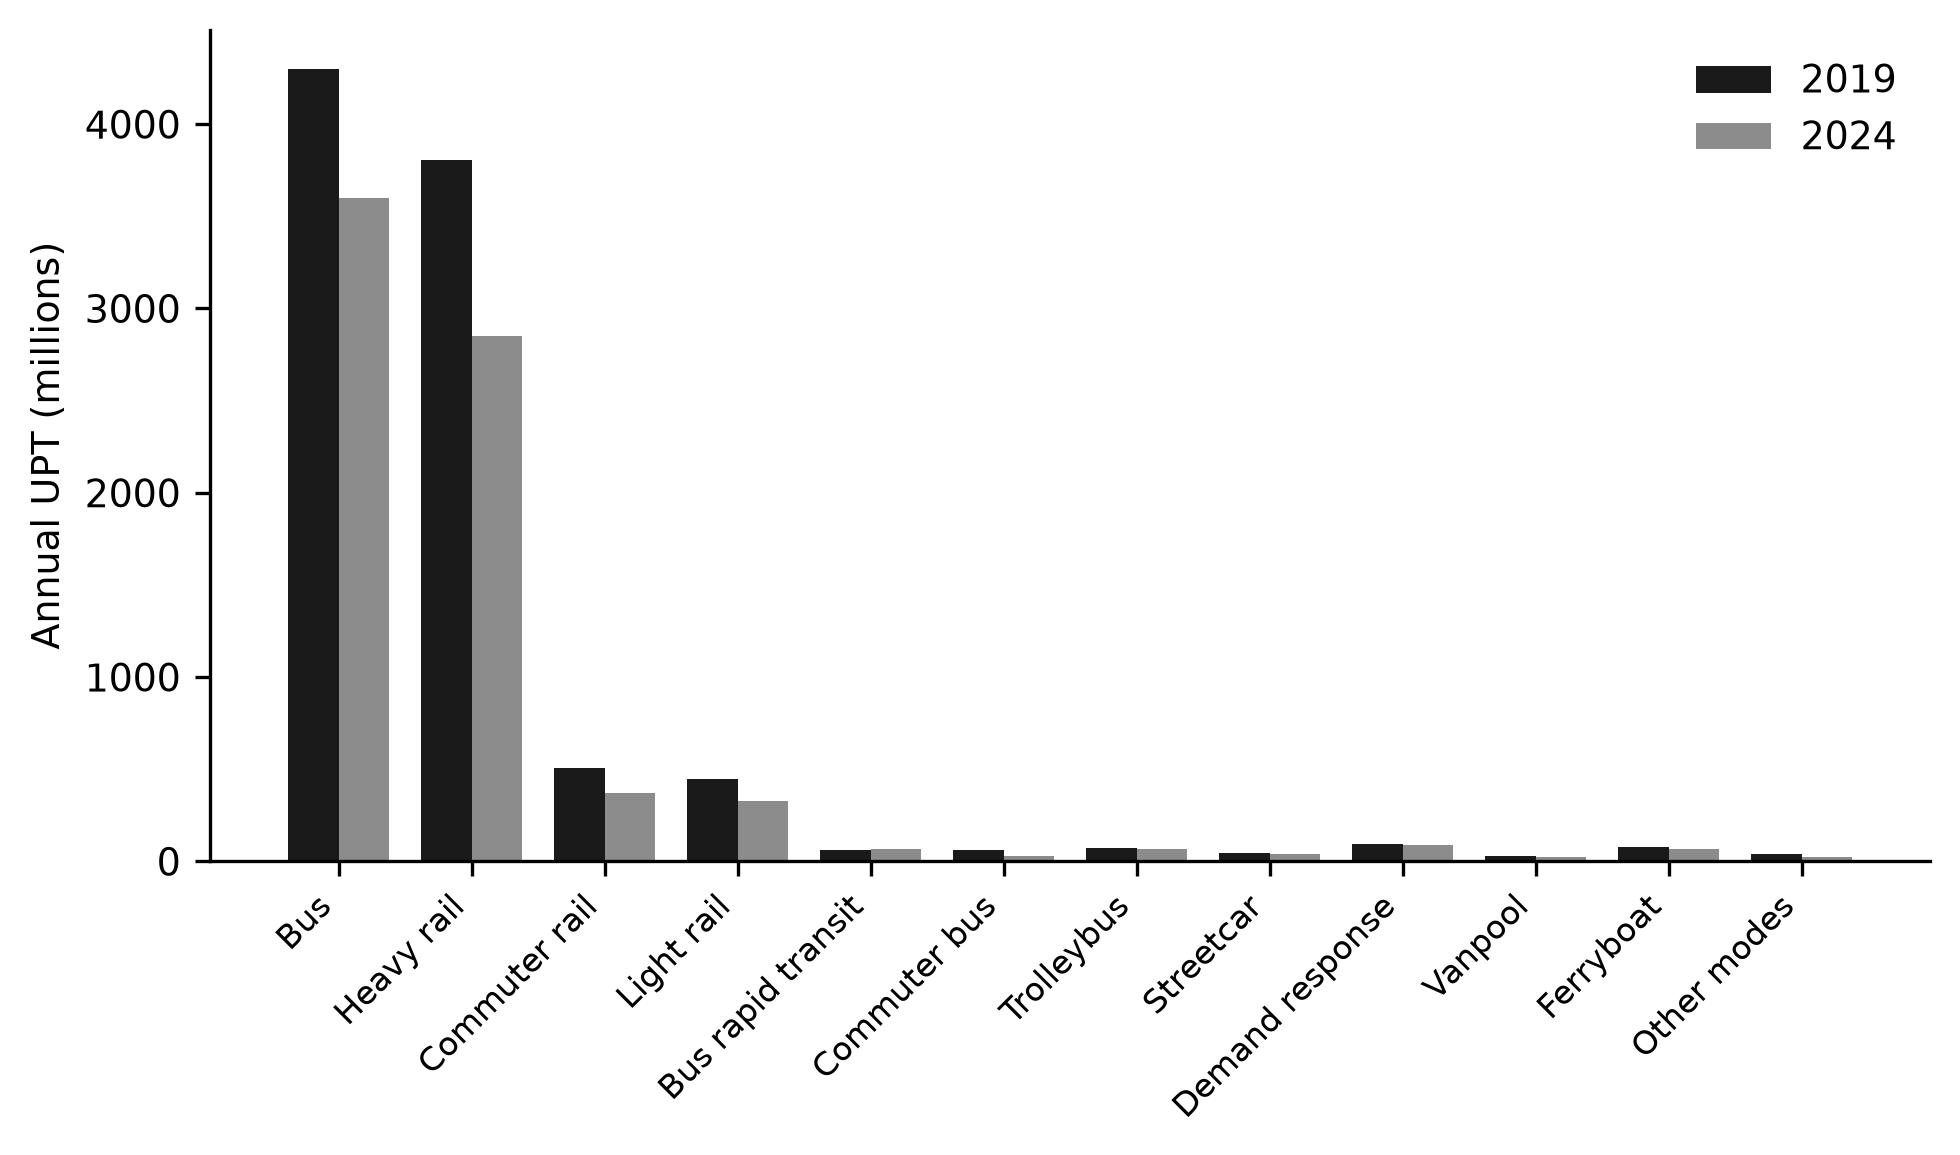
Figure 2. Annual unlinked passenger trips by transit mode in 2019 and 2024.
Note: UPT = unlinked passenger trips.Recovery by agency size class
Small agencies recovered to 91.6% of their 2019 ridership, 13.0 percentage points above the 78.6% of large agencies, whereas medium-sized agencies recovered to 79.6% (Table 2). The three classes contained 159, 158 and 158 agencies, respectively, so the size classes were balanced in agency count even though their ridership volumes differed by two orders of magnitude. Large agencies carried 9,013.8 of the 9,537.4 million national trips in 2019 and 7,082.2 million in 2024, so their recovery dominated the national aggregate. The absolute loss of large agencies was also the largest of the three classes, whereas small agencies fell from 185.3 to 169.7 million trips and medium agencies from 338.3 to 269.1 million trips over the same period. Large agencies operated most of the heavy and commuter rail ridership, while the small class consisted mainly of bus and demand response services.
Size class | Agencies (n) | UPT 2019 (millions) | UPT 2024 (millions) | Change (millions) | Recovery (%) |
|---|---|---|---|---|---|
Small | 159 | 185.3 | 169.7 | -15.6 | 91.6 |
Medium | 158 | 338.3 | 269.1 | -69.1 | 79.6 |
Large | 158 | 9013.8 | 7082.2 | -1931.6 | 78.6 |
Note: Size classes are terciles of each agency's mean 2019 monthly vehicles operated in maximum service (VOMS): small <= 35 vehicles, medium 36-92, large >= 93. Agencies without 2019 data (n = 51) are excluded.
Recovery by region
Recovery by Federal Transit Administration region ranged from 69.7% in the Great Lakes to 88.1% in the South Central, a spread of 18.4 percentage points (Table 3) (Figure 3). The New York-New Jersey region, the largest ridership market in 2019, recovered to 83.7%, above the national figure, and the South Central region recorded the strongest recovery at 88.1%.
The New York-New Jersey and West regions together carried more than half of national 2019 ridership, so their outcomes weighed heavily on the national aggregate. The remaining regions each carried less than one tenth of the national total, yet their recovery rates spanned nearly the full observed range. New England recovered to 76.0%, the Mid-Atlantic to 75.0%, the Southeast to 75.1% and the Midwest to 77.6%. The Mountain-Plains recovered to 71.3%, the West to 77.4% and the Pacific Northwest to 73.2%, whereas the Great Lakes region, at 69.7%, recorded the lowest recovery among the ten regions.
FTA region | Agencies (n) | UPT 2019 (millions) | UPT 2024 (millions) | Change (millions) | Recovery (%) |
|---|---|---|---|---|---|
New England | 37 | 453.6 | 344.6 | -109.1 | 76.0 |
New York-New Jersey | 35 | 4361.0 | 3651.3 | -709.7 | 83.7 |
Mid-Atlantic | 50 | 963.4 | 722.1 | -241.3 | 75.0 |
Southeast | 81 | 504.1 | 378.5 | -125.6 | 75.1 |
Great Lakes | 80 | 923.1 | 643.6 | -279.6 | 69.7 |
South Central | 37 | 303.7 | 267.7 | -36.0 | 88.1 |
Midwest | 21 | 81.8 | 63.4 | -18.3 | 77.6 |
Mountain-Plains | 13 | 163.1 | 116.3 | -46.8 | 71.3 |
West | 91 | 1439.3 | 1113.4 | -325.8 | 77.4 |
Pacific Northwest | 30 | 344.2 | 251.9 | -92.3 | 73.2 |
Note: FTA = Federal Transit Administration; recovery = 2024 UPT / 2019 UPT x 100. Agencies are counted in the region where they reported in 2019.

Figure 3. Recovery ratio of transit ridership by Federal Transit Administration region, 2024 versus 2019.
Note: Recovery = 2024 unlinked passenger trips / 2019 unlinked passenger trips x 100. The dashed line marks the 2019 baseline (100%).DISCUSSION
Contrary to the expectation that transit demand would converge toward its pre-pandemic baseline as economic activity resumed, the census data show a persistent shortfall of roughly one fifth in 2024 and systematic differences across modes, agency sizes and regions.
Recovery was least complete where the 2019 ridership base depended most on downtown commuting, and most complete where service is demand-responsive or serves smaller, less office-oriented markets. The shortfall was not uniform: the spread across modes exceeded fifty percentage points and the spread across regions approached twenty, so a single national recovery figure hides most of the variation.
The mode gradient reproduces, at national scale, the bus-versus-rail split reported in single-system and mode-specific studies. Bus ridership recovered to 83.7% while heavy rail reached 74.9%, consistent with nationwide bus analyses that attributed most of the pandemic loss to mediating factors such as employment, service and infection risk rather than to the mode itself.(20)
The deeper losses in commuter rail and commuter bus match evidence that remote work removed a large share of peak-period, office-bound trips.(14,15) Longitudinal elasticity estimates suggest that ridership became more responsive to service levels after the pandemic, so agencies that cut service during the crisis may have amplified their own losses.(21)
Reviews of the pandemic mobility literature converge on the same gradient, in which rail and commute-oriented services are the most exposed.(22)
Bus rapid transit was the only fixed-route mode to exceed its 2019 baseline: ridership rose from 63.6 million to 69.6 million trips, a result consistent with evidence that service expansion drives ridership gains even when other modes are contracting,(3) and it suggests that bus-priority investment may be more resilient to the telework shock than rail extensions.(14)
The persistence of telework is the most plausible mechanism for the commuter-mode lag. Machine learning analyses of United States travel data identified telework as the strongest single correlate of the transit decline,(15) and stated-preference evidence from commuters in Melbourne documented durable expectations of reduced commuting after the pandemic.(23)
Small and medium cities in Massachusetts showed the same coupling, in which work-from-home intensity predicted whether residents retained transit use.(24)
Panel evidence from Montréal found that the riders who left transit were precisely those whose commute became remote,(25) and focus groups with essential workers described returning to transit out of necessity rather than choice.(26)
Mode-share analyses further warn that the trips shed by transit did not disappear but shifted toward private driving, a substitution that risks entrenching car dependence.(27)
The size gradient ran in the opposite direction to the mode gradient and was quantitatively larger. Small agencies recovered to 91.6%, 13.0 percentage points above large agencies, echoing earlier peer-group work that found ridership determinants differ systematically by agency scale.(6)
Agency surveys in California and nationwide described large operators as more exposed to downtown office demand and to harder service and fare trade-offs during the pandemic, while smaller operators benefited from more stable demand bases.(28,29)
The pattern also mirrors segmentation evidence that the crisis hardened a divide between choice riders and captive riders, the latter concentrated in the agencies that lost the least.(30)
International evidence shows the same uneven shape, which suggests the finding is not an artifact of United States institutions. Bus ridership loss and recovery in Spanish cities displayed the same spatiotemporal unevenness within metropolitan areas,(31) and analyses of Lyon described a slower return in the central business district than in peripheral neighborhoods.(32)
The contrast between agency sizes also has a fiscal dimension. Large agencies depend on fare revenue to fund a larger share of their operating budgets, so a slower ridership recovery translated directly into budget pressure, and surveys of United States transit systems during the pandemic documented the resulting fare and service dilemmas.(28,29)
Smaller agencies, by contrast, often serve captive demand through contracted services whose ridership is less sensitive to the commuter cycle, which insulated them from the sharpest revenue shocks. This fiscal channel means the ridership divide observed here could widen over time if revenue shortfalls force further service cuts at the largest systems, a risk consistent with elasticity estimates showing stronger post-pandemic ridership responses to service reductions.(21)
Regional differences were as wide as the mode differences. The Great Lakes region, at 69.7%, lagged the South Central region, at 88.1%, consistent with regional analyses in California and seven United States regions that tied recovery to employment structure and policy responses.(16,33)
City-level studies in New York, Chicago, Austin and King County found neighborhood-level disparities shaped by income, race and the spatial distribution of essential work.(34-37)
Single-system and cross-city evidence from Lyon, the San Francisco Bay Area and the Bay Area Rapid Transit system showed the same uneven loss and recovery within metropolitan areas.(32,38,39)
Boston's auto-dominated mobility patterns also complicated a return to transit after the pandemic.(40)
The near-complete recovery of demand response, at 97.7%, and the resilience of small agencies point to the role of riders with few alternatives. Essential workers and transit-dependent households sustained ridership through the pandemic and returned more quickly than discretionary riders.(9,41)
This interpretation is reinforced by resilience analyses showing that ridership losses were smallest where dependence on transit was highest,(42,43) and by panel evidence that the riders most likely to abandon transit were those with a car available.(44) Time-series studies caution that recovery speed varies across systems, so national averages conceal substantial local dispersion.(45)
These findings carry implications for transport equity. The modes and agencies that lost the most are also those that serve the most office-oriented, higher-income commute markets, whereas the services that recovered first serve riders with the fewest alternatives. A recovery that restores downtown commuter rail before neighborhood bus and demand response would therefore deepen, rather than narrow, the existing disparities documented in accessibility research.(12)
Policy that prioritizes the return of peak commuters risks leaving behind the riders who never stopped using transit.(41) Equity-oriented recovery therefore requires monitoring the distribution of ridership across modes and neighborhoods alongside the aggregate, because the aggregate can recover while the services used by the most dependent riders continue to lag.
The three axes also interact, and this overlap qualifies a purely additive reading of the results. The largest agencies are disproportionately the operators of heavy and commuter rail, and the regions with the weakest recovery contain several of the largest legacy systems, whereas the strongest recovery regions contain more small and mid-sized operators.
The mode, size and region gradients are therefore not independent, and separating their contributions would require a panel model with agency fixed effects and controls for service supply and local employment. The descriptive census presented here establishes the magnitude of the unevenness; the next analytical step is to decompose it across the three axes.
The practical consequence for planning is that post-pandemic ridership is less predictable than its pre-pandemic trend, and models fitted to pre-2020 data systematically overestimate current demand. Comparative evaluations of time-series methods found that no single specification dominates after the shock, which counsels caution in ridership forecasts used to justify capital investment.(45)
The uneven recovery documented here reinforces that caution: a single national recovery factor would misstate the position of individual modes, agencies and regions.
The study's strength is the census of every active full reporter rather than a sample, which allows the three-way contrast of mode, size and region within a single national frame. The use of the same 2019 fleet measure for all agencies, the same modal taxonomy and the same administrative regions makes the three contrasts directly comparable, and the sensitivity analyses show that the headline result is robust to panel composition and to the inclusion of paratransit modes.
A caution is that part of the 2019 to 2024 change continues a pre-pandemic decline documented through the 2010s,(1,2) so the pandemic recovery gap is best read as a deepening of an existing vulnerability rather than an entirely new trajectory.(3,5)
The uneven recovery is also a preview of how the sector may absorb future shocks. If a remote-work shock that did not damage infrastructure could remove one fifth of ridership for five years, then disruptions that constrain service directly, such as extreme weather or infrastructure failure, may produce longer and more geographically concentrated losses. Resilience planning should therefore account for the structural differences documented here, because the same event will land very differently on a small bus operator than on a large commuter rail system.
Several limitations condition these results. First, the restriction to full reporters excludes small systems, rural and reduced asset reporters, whose monthly data follow different schedules; a sensitivity that includes those reporters would test whether the small-agency advantage extends further down the size distribution.
Second, size classes are terciles of a single fleet measure and do not separate demand-responsive from fixed-route fleets within mixed agencies. Third, the analysis does not adjust for service supply, fares or local employment, so mode and region contrasts may partly reflect service decisions rather than demand alone; future work should estimate panel models that condition on vehicle revenue miles and service hours. Fourth, the monthly series includes adjustments and estimates for incomplete months, which could smooth short-term variation.
Fifth, the ecological design supports description of population-level differences but not causal claims about individual travel behavior. Sixth, the mode grouping treats commuter bus separately from motor bus but does not isolate express bus service, whose riders resemble commuter rail users; finer service typologies could sharpen the mode contrast in future work.
For policy, the uneven pattern suggests that restoring national ridership requires differentiated strategies rather than a single response. Commuter rail and large legacy systems face a structural telework shock and may need to reallocate service toward off-peak and non-commute markets, whereas the resilience of demand response and small agencies indicates that flexible, needs-based service can retain riders through disruptions.
Fare and service levers, which drove ridership before the pandemic,(3) remain the instruments with the strongest empirical support for rebuilding demand.
Regional disparities also counsel against uniform federal performance targets, because a recovery benchmark that is attainable in the South Central region may be unreachable in the Great Lakes under current employment conditions, and equity-oriented planning should weight the needs of transit-dependent riders rather than the return of peak commuters. The findings also bear on the governance question of who should absorb the cost of recovery: funding formulas tied to pre-pandemic ridership would lock in the disparities observed here, whereas mode-sensitive and region-sensitive targets would recognize that a small operator and a large legacy rail system face different demand conditions.
CONCLUSIONS
National public transit ridership in the United States remained below its pre-pandemic level through 2024 after an abrupt collapse in 2020. Recovery was least complete among rail and commuter-oriented modes and most complete among demand-responsive and bus rapid transit services. Recovery was also inversely related to agency size, with small agencies recovering more fully than large agencies. Recovery varied widely across Federal Transit Administration regions, with the weakest outcomes in the Great Lakes and the strongest in the South Central region.
References
- 1 Lee Y, Lee B. What’s eating public transit in the United States? Reasons for declining transit ridership in the 2010s. Transportation Research Part A: Policy and Practice. 2022;157:126-143. doi: 10.1016/j.tra.2022.01.002
- 2 Erhardt GD, Hoque JM, Goyal V, Berrebi S, Brakewood C, Watkins KE. Why has public transit ridership declined in the United States?. Transportation Research Part A: Policy and Practice. 2022;161:68-87. doi: 10.1016/j.tra.2022.04.006
- 3 Boisjoly G, Grisé E, Maguire M, Veillette MP, Deboosere R, Berrebi E, et al. Invest in the ride: A 14 year longitudinal analysis of the determinants of public transport ridership in 25 North American cities. Transportation Research Part A: Policy and Practice. 2018;116:434-445. doi: 10.1016/j.tra.2018.07.005
- 4 Malalgoda N, Lim SH. Do transportation network companies reduce public transit use in the U.S.?. Transportation Research Part A: Policy and Practice. 2019;130:351-372. doi: 10.1016/j.tra.2019.09.051
- 5 University of California, Berkeley, Shaheen S, Cohen A, University of California, Berkeley. Is It Time for a Public Transit Renaissance?: Navigating Travel Behavior, Technology, and Business Model Shifts in a Brave New World. JPT. 2018;21(1):67-81. doi: 10.5038/2375-0901.21.1.8
- 6 Ederer D, Berrebi S, Diffee C, Gibbs T, Watkins KE. Comparing Transit Agency Peer Groups using Cluster Analysis. Transportation Research Record: Journal of the Transportation Research Board. 2019;2673(11):505-516. doi: 10.1177/0361198119852074
- 7 Liu L, Miller HJ, Scheff J. The impacts of COVID-19 pandemic on public transit demand in the United States. PLoS ONE. 2020;15(11):e0242476. doi: 10.1371/journal.pone.0242476
- 8 Kamga C, Eickemeyer P. Slowing the spread of COVID-19: Review of “Social distancing” interventions deployed by public transit in the United States and Canada. Transport Policy. 2021;106:25-36. doi: 10.1016/j.tranpol.2021.03.014
- 9 Parker MEG, Li M, Bouzaghrane MA, Obeid H, Hayes D, Frick KT, et al. Public transit use in the United States in the era of COVID-19: Transit riders’ travel behavior in the COVID-19 impact and recovery period. Transport Policy. 2021;111:53-62. doi: 10.1016/j.tranpol.2021.07.005
- 10 Qi Y, Liu J, Tao T, Zhao Q. Impacts of COVID-19 on public transit ridership. International Journal of Transportation Science and Technology. 2023;12(1):34-45. doi: 10.1016/j.ijtst.2021.11.003
- 11 Ziedan A, Brakewood C, Watkins K. Will transit recover? A retrospective study of nationwide ridership in the United States during the COVID-19 pandemic. Journal of Public Transportation. 2023;25:100046. doi: 10.1016/j.jpubtr.2023.100046
- 12 Wilbur M, Ayman A, Sivagnanam A, Ouyang A, Poon V, Kabir R, et al. Impact of COVID-19 on Public Transit Accessibility and Ridership. Transportation Research Record: Journal of the Transportation Research Board. 2023;2677(4):531-546. doi: 10.1177/03611981231160531
- 13 Liu Y, Osorio J, Ouyang Y. How long it took transit ridership to recover from disruptive events: A review into the recent history. Journal of Public Transportation. 2023;25:100051. doi: 10.1016/j.jpubtr.2023.100051
- 14 Magassy TB, Batur I, Mondal A, Asmussen KE, Bhat CR, Salon D, et al. Evolution of Mode Use During the COVID-19 Pandemic in the United States: Implications for the Future of Transit. Transportation Research Record: Journal of the Transportation Research Board. 2024;2678(12):567-579. doi: 10.1177/03611981231166942
- 15 Edward D, Soria J, Stathopoulos A. Multi-modal Machine Learning Investigation of Telework and Transit Connections. Data Sci Transp. 2024;6(2):14. doi: 10.1007/s42421-024-00100-6
- 16 Wasserman JL, Taylor BD. Transit Blues in the Golden State: Regional transit ridership trends in California. Journal of Public Transportation. 2022;24:100030. doi: 10.1016/j.jpubtr.2022.100030
- 17 Palm M, Allen J, Zhang Y, Tiznado-Aitken I, Batomen B, Farber S, et al. Facing the future of transit ridership: shifting attitudes towards public transit and auto ownership among transit riders during COVID-19. Transportation. 2024;51(2):645-671. doi: 10.1007/s11116-022-10344-2
- 18 Benchimol EI, Smeeth L, Guttmann A, Harron K, Moher D, Petersen I, et al. The REporting of studies Conducted using Observational Routinely-collected health Data (RECORD) Statement. PLoS Med. 2015;12(10):e1001885. doi: 10.1371/journal.pmed.1001885
- 19 Federal Transit Administration. Complete Monthly Ridership (with Adjustments and Estimates) [Internet]. 2024. Available from: https://data.transportation.gov/Public-Transit/Complete-Monthly-Ridership-with-Adjustments-and-Es/8bui-9xvu
- 20 Ziedan A, Lima L, Brakewood C. A multiple mediation analysis to untangle the impacts of COVID-19 on nationwide bus ridership in the United States. Transportation Research Part A: Policy and Practice. 2023;173:103718. doi: 10.1016/j.tra.2023.103718
- 21 Redelmeier P, El-Geneidy A. If You Cut It Will They Ride? Longitudinal Examination of the Elasticity of Public Transport Ridership in the Post-Pandemic Era. Transportation Research Record: Journal of the Transportation Research Board. 2024;2678(11):241-252. doi: 10.1177/03611981241240754
- 22 Lee KS, Eom JK. Systematic literature review on impacts of COVID-19 pandemic and corresponding measures on mobility. Transportation. 2024;51(5):1907-1961. doi: 10.1007/s11116-023-10392-2
- 23 Currie G, Jain T, Aston L. Evidence of a post-COVID change in travel behaviour – Self-reported expectations of commuting in Melbourne. Transportation Research Part A: Policy and Practice. 2021;153:218-234. doi: 10.1016/j.tra.2021.09.009
- 24 Shakespeare RM, Srinivasan S. Demographic and Built Environment Predictors of Public Transportation Retention and Work-from-Home Changes in Small- to Medium-Sized Massachusetts Cities, 2011–2021. Sustainability. 2024;16(19):8620. doi: 10.3390/su16198620
- 25 Victoriano-Habit R, El-Geneidy A. Why are people leaving public transport? A panel study of changes in transit-use patterns between 2019, 2021, and 2022 in Montréal, Canada. Journal of Public Transportation. 2024;26:100087. doi: 10.1016/j.jpubtr.2024.100087
- 26 Ashour LA, Shen Q, Moudon A, Cai M, Wang Y, Brown M. Post-pandemic transit commute: Lessons from focus group discussions on the experience of essential workers during COVID-19. Journal of Transport Geography. 2024;116:103832. doi: 10.1016/j.jtrangeo.2024.103832
- 27 Ciuffini F, Tengattini S, Bigazzi AY. Mitigating Increased Driving after the COVID-19 Pandemic: An Analysis on Mode Share, Travel Demand, and Public Transport Capacity. Transportation Research Record: Journal of the Transportation Research Board. 2023;2677(4):154-167. doi: 10.1177/03611981211037884
- 28 King H, Wasserman JL, Taylor BD. Terra Incognita : California Transit Agency Perspectives on Demand, Service, and Finance in the Age of COVID-19. Transportation Research Record: Journal of the Transportation Research Board. 2024;2678(12):643-655. doi: 10.1177/03611981231182963
- 29 Siddiq F, Wasserman JL, Taylor BD, Speroni S. Transit’s Financial Prognosis: Findings from a Survey of U.S. Transit Systems during the COVID-19 Pandemic. Public Works Management & Policy. 2023;28(4):393-415. doi: 10.1177/1087724x231160097
- 30 Tiznado-Aitken I, Palm M, Farber S. Segmenting transit ridership: From crisis to opportunity. Transportation Research Part A: Policy and Practice. 2024;190:104239. doi: 10.1016/j.tra.2024.104239
- 31 Zaragozí B, Gutiérrez A, Delclòs-Alió X, Miravet D. Exploring the public bus ridership loss and recovery during the COVID-19 pandemic: a spatiotemporal analysis using smart card data. Journal of Maps. 2023;19(1):2231022. doi: 10.1080/17445647.2023.2231022
- 32 Cottreau B, Adraoui A, Manout O, Bouzouina L. Spatio‐temporal patterns of the impact of COVID‐19 on public transit: An exploratory analysis from Lyon, France. Regional Science Policy & Practice. 2023;15(8):1702-1722. doi: 10.1111/rsp3.12718
- 33 Karner A, LaRue S, Klumpenhouwer W, Rowangould D. Evaluating public transit agency responses to the Covid-19 pandemic in seven U.S. regions. Case Studies on Transport Policy. 2023;12:100989. doi: 10.1016/j.cstp.2023.100989
- 34 Qiang D, McKenzie G. Navigating the post-pandemic urban landscape: Disparities in transportation recovery & regional insights from New York City. Computers, Environment and Urban Systems. 2024;110:102111. doi: 10.1016/j.compenvurbsys.2024.102111
- 35 Owen D, Arribas-Bel D, Rowe F. Tracking the Transit Divide: A Multilevel Modelling Approach of Urban Inequalities and Train Ridership Disparities in Chicago. Sustainability. 2023;15(11):8821. doi: 10.3390/su15118821
- 36 Jiao J, Hansen K, Azimian A. Disparities in the Impacts of the COVID-19 Pandemic on Public Transit Ridership in Austin, Texas, U.S.A. Transportation Research Record: Journal of the Transportation Research Board. 2023;2677(4):287-297. doi: 10.1177/03611981231159906
- 37 Lin JYJ, Chen C, Angah O. Socio-Economic and Spatial Disparity of Bus Ridership Impacts in King County, Washington, During COVID-19. Transportation Research Record: Journal of the Transportation Research Board. 2024;2678(12):295-308. doi: 10.1177/03611981221116366
- 38 Kurzhanskiy A, Lapardhaja S. Monitoring of Bus Transit in Bay Area During COVID-19. In: Springer Tracts on Transportation and Traffic. Springer International Publishing; 2023. p. 283-297. doi: 10.1007/978-3-031-00148-2_18
- 39 Wasserman JL, Taylor BD. State of the BART: Analyzing the Determinants of Bay Area Rapid Transit Use in the 2010s. Transportation Research Part A: Policy and Practice. 2023;172:103663. doi: 10.1016/j.tra.2023.103663
- 40 Basu R, Ferreira J. Sustainable mobility in auto-dominated Metro Boston: Challenges and opportunities post-COVID-19. Transport Policy. 2021;103:197-210. doi: 10.1016/j.tranpol.2021.01.006
- 41 He Q, Rowangould D, Karner A, Palm M, LaRue S. Covid-19 pandemic impacts on essential transit riders: Findings from a U.S. Survey. Transportation Research Part D: Transport and Environment. 2022;105:103217. doi: 10.1016/j.trd.2022.103217
- 42 Li X, Lee S, Yoo C. Unveiling the spatial heterogeneity of public transit resilience during and after the COVID-19 Pandemic. Journal of Public Transportation. 2024;26:100091. doi: 10.1016/j.jpubtr.2024.100091
- 43 Choi WG, Ryu S, Jung PH, Kang S. Differential Dynamics of Transit Use Resilience During the COVID-19 Pandemic Using Multivariate Two-Dimensional Functional Data Analysis. IEEE Access. 2024;12:8721-8743. doi: 10.1109/access.2024.3353780
- 44 Soria J, Edward D, Stathopoulos A. Requiem for transit ridership? An examination of who abandoned, who will return, and who will ride more with mobility as a service. Transport Policy. 2023;134:139-154. doi: 10.1016/j.tranpol.2023.02.016
- 45 Hightower A, Ziedan A, Guo J, Zhu X, Brakewood C. A comparison of time series methods for post-COVID transit ridership forecasting. Journal of Public Transportation. 2024;26:100097. doi: 10.1016/j.jpubtr.2024.100097
Declarations
Funding
No financing
Conflict of interest
None
Authorship contributions
Drafting – original draft: Edixon Chacón Guerrero, Rómulo Esteban Montilla.
Writing–review and editing: Edixon Chacón Guerrero, Rómulo Esteban Montilla.