

Abstract
Introduction: Public transportation commuting in the United States contracted sharply after 2020 while working from home expanded, but the contribution of working from home to the decline of transit commuting across metropolitan areas has not been quantified with official data. Methods: This ecological longitudinal change study used American Community Survey 1-year estimates, table B08301, for US metropolitan statistical areas in 2019 and 2023. The primary outcome was the percentage-point change in the share of workers commuting by public transportation; the primary exposure was the percentage-point change in the working-from-home share. Weighted ordinary least squares with weights equal to 2019 workers and HC3 standard errors estimated the association, with unweighted, large-metropolitan and robust sensitivity analyses. Results: A total of 204 metropolitan areas had estimates in both years, representing 123 million workers in 2019. Nationally, working from home rose from 5.72% to 13.84% of workers while public transportation fell from 4.96% to 3.53%. Each 1 percentage-point increase in working from home was associated with a −0.354 percentage-point decline in transit share among all workers (95% CI −0.519 to −0.189) and a −0.294 percentage-point decline among commuters (95% CI −0.432 to −0.155). Estimates were consistent across all sensitivity analyses. Conclusions: Growth in working from home was associated with the decline of transit commuting across US metropolitan areas between 2019 and 2023, through both a smaller commuting population and lower transit use among remaining commuters.
Keywords
telecommuting, public transportation, commuting, urban areas, American Community Survey
INTRODUCTION
Public transportation carries a small but strategically important share of the journey to work in the United States. In the years before the pandemic, roughly one in twenty workers commuted by public transit, and the share was far higher in the largest metropolitan areas and among lower-income, immigrant and minority workers who depend on transit for access to employment. (1,2)
Because transit commuting is concentrated in a limited number of dense labor markets, changes in those markets drive the national aggregate, and losses in those markets carry direct consequences for household mobility, congestion and municipal finance. Transit commuting therefore functions as a marker of both urban mobility and transport equity, which makes its recent trajectory a matter of practical as well as academic concern.
The coronavirus pandemic interrupted this pattern abruptly. Transit ridership collapsed in the first months of 2020 and recovered only partially in the years that followed, a loss that has been documented in national ridership series and in studies of individual systems.( 3-5)
The decline was not uniform: it varied by mode, by region and by the socioeconomic composition of riders, and a substantial share of former riders had not returned even after offices reopened.( 6-8)
Explaining that incomplete recovery requires separating the demand that disappeared with the pandemic from the demand that was displaced by more durable changes in how and where people work.
The same period brought a large and persistent expansion of working from home. Before 2020 working from home was a stable and modest share of the workforce, but the pandemic moved a large fraction of office work into the home, and hybrid arrangements persisted after public health restrictions were lifted.( 9-11)
By 2023, working from home had settled well above its pre-pandemic level even as some workers returned to the office part-time, and its prevalence varied considerably across metropolitan areas in ways that reflected industry composition, occupational structure and local housing costs. Working from home removes the commute trip altogether, so it has an obvious mechanical relationship with transit commuting: a worker who does not travel to a workplace cannot board a bus or train. The scale and persistence of the shift suggest that remote work could explain a substantial portion of the observed decline in transit commuting, rather than a general erosion of transit mode share among workers who still commute.
The available evidence supports this mechanism but leaves the national metropolitan picture incomplete. Panel and survey studies in Europe, Australia and the United States have found that teleworking reduces commuting trips, commute distance and travel time.( 12-15)
Studies focused on transit have linked remote work to lower ridership and to a changing composition of riders.( 5,16,17)
What is missing is a direct, nationwide quantification across US metropolitan areas of the association between the growth of working from home and the decline of transit commuting using a single official source that applies the same definitions to every area. This gap matters because metropolitan areas differ widely in baseline transit dependence, economic structure and the intensity with which they adopted remote work, and because the policy response depends on knowing whether the loss reflects fewer commuters or lower transit use among commuters.
A metropolitan-level analysis is well suited to isolate this channel. The American Community Survey applies identical question wording and classification to every metropolitan area in every year, so the change in working from home and the change in transit commuting can be computed without the harmonization problems that affect pooled surveys.
Moreover, metropolitan areas vary widely in how much office employment they contain, how much of it could be performed remotely and how dependent their workers are on transit, which provides the cross-sectional variation needed to detect an association. If working from home drives the transit decline, areas that adopted it most should show the largest transit losses, and the relationship should remain visible among workers who still commuted rather than disappearing once the mechanical loss of commuters is removed.
The direction and strength of that relationship carry direct implications for transit agencies, because a loss concentrated in the commuting population has different remedies from a loss of transit mode share among people who continue to travel to work.
The objective of this study was to estimate the ecological association between the change in working-from-home share and the change in public transportation commute share across US metropolitan areas between 2019 and 2023. The primary outcome was the change in transit commuting among all workers, and the secondary outcome was the change among workers who still commuted, which isolates mode substitution from the mechanical loss of commuters. It was hypothesized that metropolitan areas with larger increases in working from home experienced larger declines in public transportation commuting.
METHODS
Design and data source
An ecological longitudinal change study was conducted at the level of the metropolitan statistical area, using repeated cross-sections of the American Community Survey one-year estimates for 2019 and 2023, with 2021 and 2022 used only to describe the national trajectory. The reporting followed the Strengthening the Reporting of Observational Studies in Epidemiology statement.
The unit of analysis was the metropolitan statistical area as defined by the Office of Management and Budget; micropolitan areas and Puerto Rico were excluded because the research question concerns large urban labor markets. The endpoints 2019 and 2023 were chosen to bracket the pandemic while avoiding the disrupted collection year, and they are far enough apart for the durable component of the remote-work shift to be separated from the temporary shock.
The data came from the US Census Bureau American Community Survey one-year estimates, detailed table B08301, which classifies workers aged 16 years and over by means of transportation to work.( 18)
Table B08301 reports, within a single table, the total number of workers, the number using public transportation excluding taxicabs, and the number who worked from home, which are the two constructs required by the research question. For 2019 the sequence-based Summary File was downloaded from the Census file server, and for 2021 through 2023 the table-based Summary File was used. The 2020 one-year data were not used because the Census Bureau did not release standard 2020 one-year estimates as a Summary File owing to pandemic-related collection disruptions, a limitation that is discussed below.
The 2019 vintage used the 2013 Office of Management and Budget metropolitan delineations and the 2023 vintage used the 2020 delineations, so metropolitan areas were matched on their five-digit code and areas that existed in only one vintage were dropped from the change analysis. The American Community Survey withholds detailed commuting estimates for geographies with insufficient sample, which is why the metropolitan sample consists of the larger areas for which table B08301 was published in both years; the number of areas excluded for this reason is reported in the results. No imputation was performed for suppressed cells, and areas with any missing value among the three required cells were excluded.
Variables
The working-from-home share was defined as the number of workers who worked from home divided by all workers, expressed as a percentage. The primary outcome was the public transportation share among all workers, defined as the number of workers using public transportation divided by all workers. The secondary outcome was the public transportation share among commuters, defined as transit users divided by workers who did not work from home. Changes were computed as the 2023 value minus the 2019 value in percentage points. The three shares and their changes were computed for every metropolitan area with published estimates in both years.
Data processing
The 2019 sequence-based Summary File stores table B08301 within sequence 36, and the table-based Summary File for 2021 through 2023 stores each detailed table in a single pipe-delimited file. For every year, the table cells B08301_001, B08301_010 and B08301_021 were read, corresponding respectively to all workers, workers using public transportation, and workers who worked from home. Each record was joined to the geography file to recover the metropolitan statistical area code and name, and the years were matched on the five-digit metropolitan area code. Metropolitan areas without published estimates in a given year were excluded from the corresponding year. The cleaned metropolitan panel was written as a single file so that the analysis could be reproduced from the downloaded inputs.
Statistical analysis
The primary exposure was the change in working-from-home share, the primary outcome was the change in the public transportation share among all workers, and the secondary outcome was the change among commuters; the additional analyses were pre-specified before the models were fitted.
The main model was a weighted ordinary least squares regression of the change in transit share on the change in working-from-home share across metropolitan areas, with weights equal to the 2019 number of workers so that larger labor markets contributed proportionally, and with HC3 heteroscedasticity-consistent standard errors. The coefficient expresses the percentage-point change in transit share associated with a one percentage-point increase in working-from-home share.
Weighting was chosen because the outcome is a share computed from counts, so areas with more workers yield more precise estimates of the change, and HC3 errors allow for heteroscedasticity across areas of different size; the unweighted models were retained to show that the result does not depend on the weighting scheme. As sensitivity analyses, an unweighted ordinary least squares model, a model restricted to metropolitan areas with at least 500,000 workers in 2019, and a Huber robust regression were estimated, together with the unweighted Pearson correlation between the two changes.
The threshold of 500,000 workers was selected to isolate the largest labor markets without imposing an arbitrary continuous transformation on the weighting variable. The significance level was set at 0.05 with two-sided tests and 95 percent confidence intervals.
The national change in the transit share among all workers was decomposed into the contribution of the change in the share of workers who commuted and the contribution of the change in the transit share among commuters, using the identity that the transit share among all workers equals the commuter share multiplied by the transit share among commuters; the change in the product was expressed as the sum of the two first-order contributions plus an interaction term.
The analysis used public, anonymized, aggregate data and therefore required no ethics approval.
RESULTS
Included metropolitan areas
A total of 233 metropolitan areas had published table B08301 estimates in 2019 and 246 had them in 2023, and 204 metropolitan areas had estimates in both years and entered the change analysis. The areas excluded from the change analysis were predominantly smaller metropolitan areas whose one-year commuting estimates were suppressed by the Census Bureau, so the matched sample concentrates on the larger labor markets where almost all transit commuting in the United States takes place.
These 204 areas represented 123 million workers in 2019. At the national level, working from home rose from 5.72% of workers in 2019 to 13.84% in 2023, after a peak of 17.86% in 2021 and a partial return to 15.18% in 2022. Public transportation among all workers fell from 4.96% in 2019 to 3.53% in 2023, with a trough of 2.46% in 2021 and a partial recovery to 3.12% in 2022. The absolute number of transit commuters declined from 7.78 million to 5.74 million, while the number working from home grew from 8.97 million to 22.49 million (Table 1) (Figure 1).
Indicator | 2019 | 2023 |
|---|---|---|
Workers aged 16 years and over, national (millions) | 156.94 | 162.43 |
Working from home (% of workers) | 5.72% | 13.84% |
Public transportation (% of workers) | 4.96% | 3.53% |
Public transportation (% of commuters) | 5.26% | 4.10% |
Transit commuters, national (millions) | 7.78 | 5.74 |
Metropolitan areas with published B08301 estimates | 233 | 246 |
Note: Commuters are workers who did not work from home. Values are percentages unless otherwise indicated. Source: U.S. Census Bureau, American Community Survey 1-year estimates, table B08301.
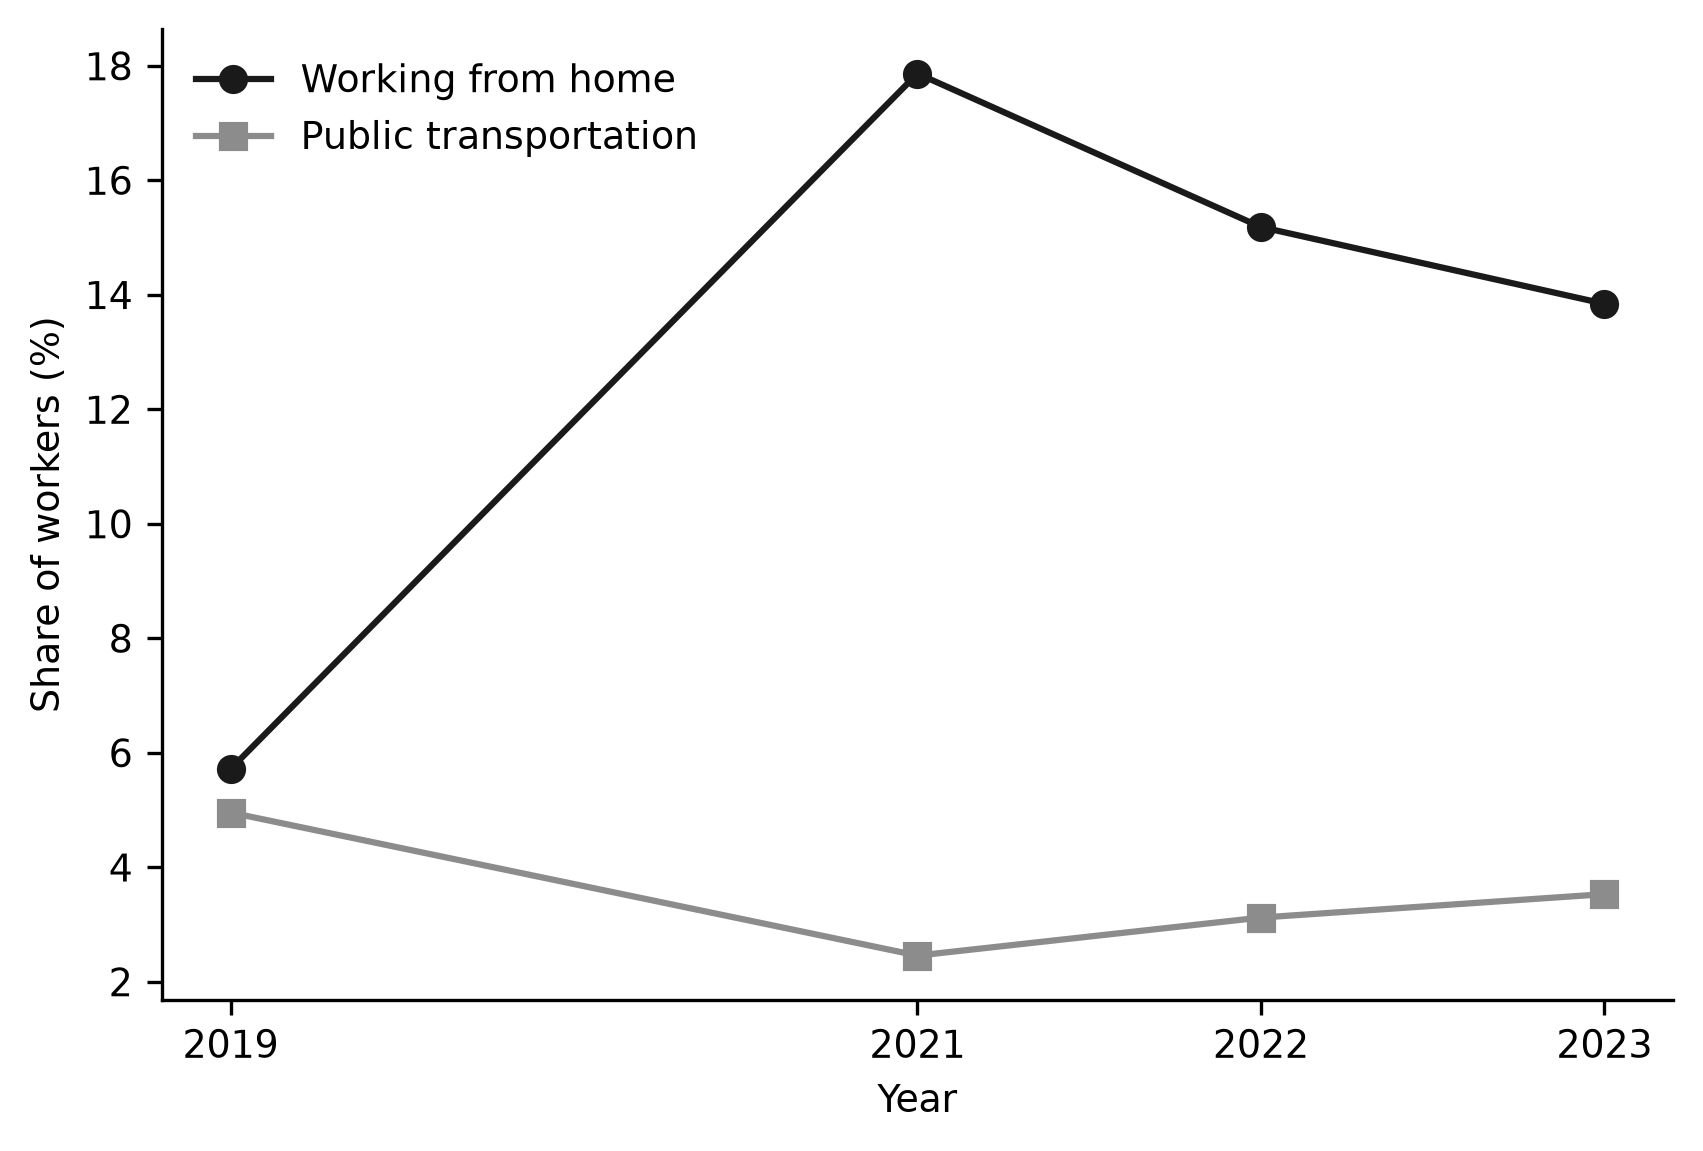
Figure 1. Working-from-home and public transportation shares in the United States, 2019-2023.
Note: Shares are percentages of workers aged 16 years and over. The 2020 one-year estimates were not published as a standard Summary File. Source: U.S. Census Bureau, American Community Survey 1-year estimates, table B08301.Primary outcome
Across the 204 metropolitan areas, the working-from-home share increased by a mean of 7.27 percentage points (median 6.98, interquartile range 5.51 to 9.06), while the public transportation share among all workers decreased by a mean of −0.65 percentage points (median −0.34, interquartile range −0.85 to −0.09). The transit change was negative in at least three quarters of metropolitan areas, as indicated by an upper quartile of −0.09 percentage points. In the weighted regression, each one percentage-point increase in working from home was associated with a −0.354 percentage-point decline in the transit share among all workers (95% CI −0.519 to −0.189, p <0.001), and the model explained 0.25 of the variance in the change. The unweighted Pearson correlation between the two changes was −0.47 (p <0.001) (Table 2) (Figure 2).
Model | Metropolitan areas | Outcome | Beta (95% CI) | p | R2 |
|---|---|---|---|---|---|
Weighted OLS (2019 workers) | 204 | Transit share, all workers | −0.354 (−0.519 to −0.189) | <0.001 | 0.250 |
Weighted OLS (2019 workers) | 204 | Transit share, commuters | −0.294 (−0.432 to −0.155) | <0.001 | 0.305 |
Unweighted OLS | 204 | Transit share, all workers | −0.186 (−0.262 to −0.111) | <0.001 | 0.223 |
Unweighted OLS | 204 | Transit share, commuters | −0.150 (−0.217 to −0.084) | <0.001 | 0.189 |
Weighted OLS, at least 500,000 workers in 2019 | 51 | Transit share, all workers | −0.379 (−0.698 to −0.059) | 0.020 | 0.178 |
Huber robust regression | 204 | Transit share, all workers | −0.112 (−0.143 to −0.081) | <0.001 |
Note: Beta is the percentage-point change in transit share per 1 percentage-point increase in working-from-home share. CI = confidence interval; OLS = ordinary least squares; R2 = coefficient of determination. Weighted models use 2019 workers as weights with HC3 standard errors. Source: U.S. Census Bureau, American Community Survey 1-year estimates, table B08301.
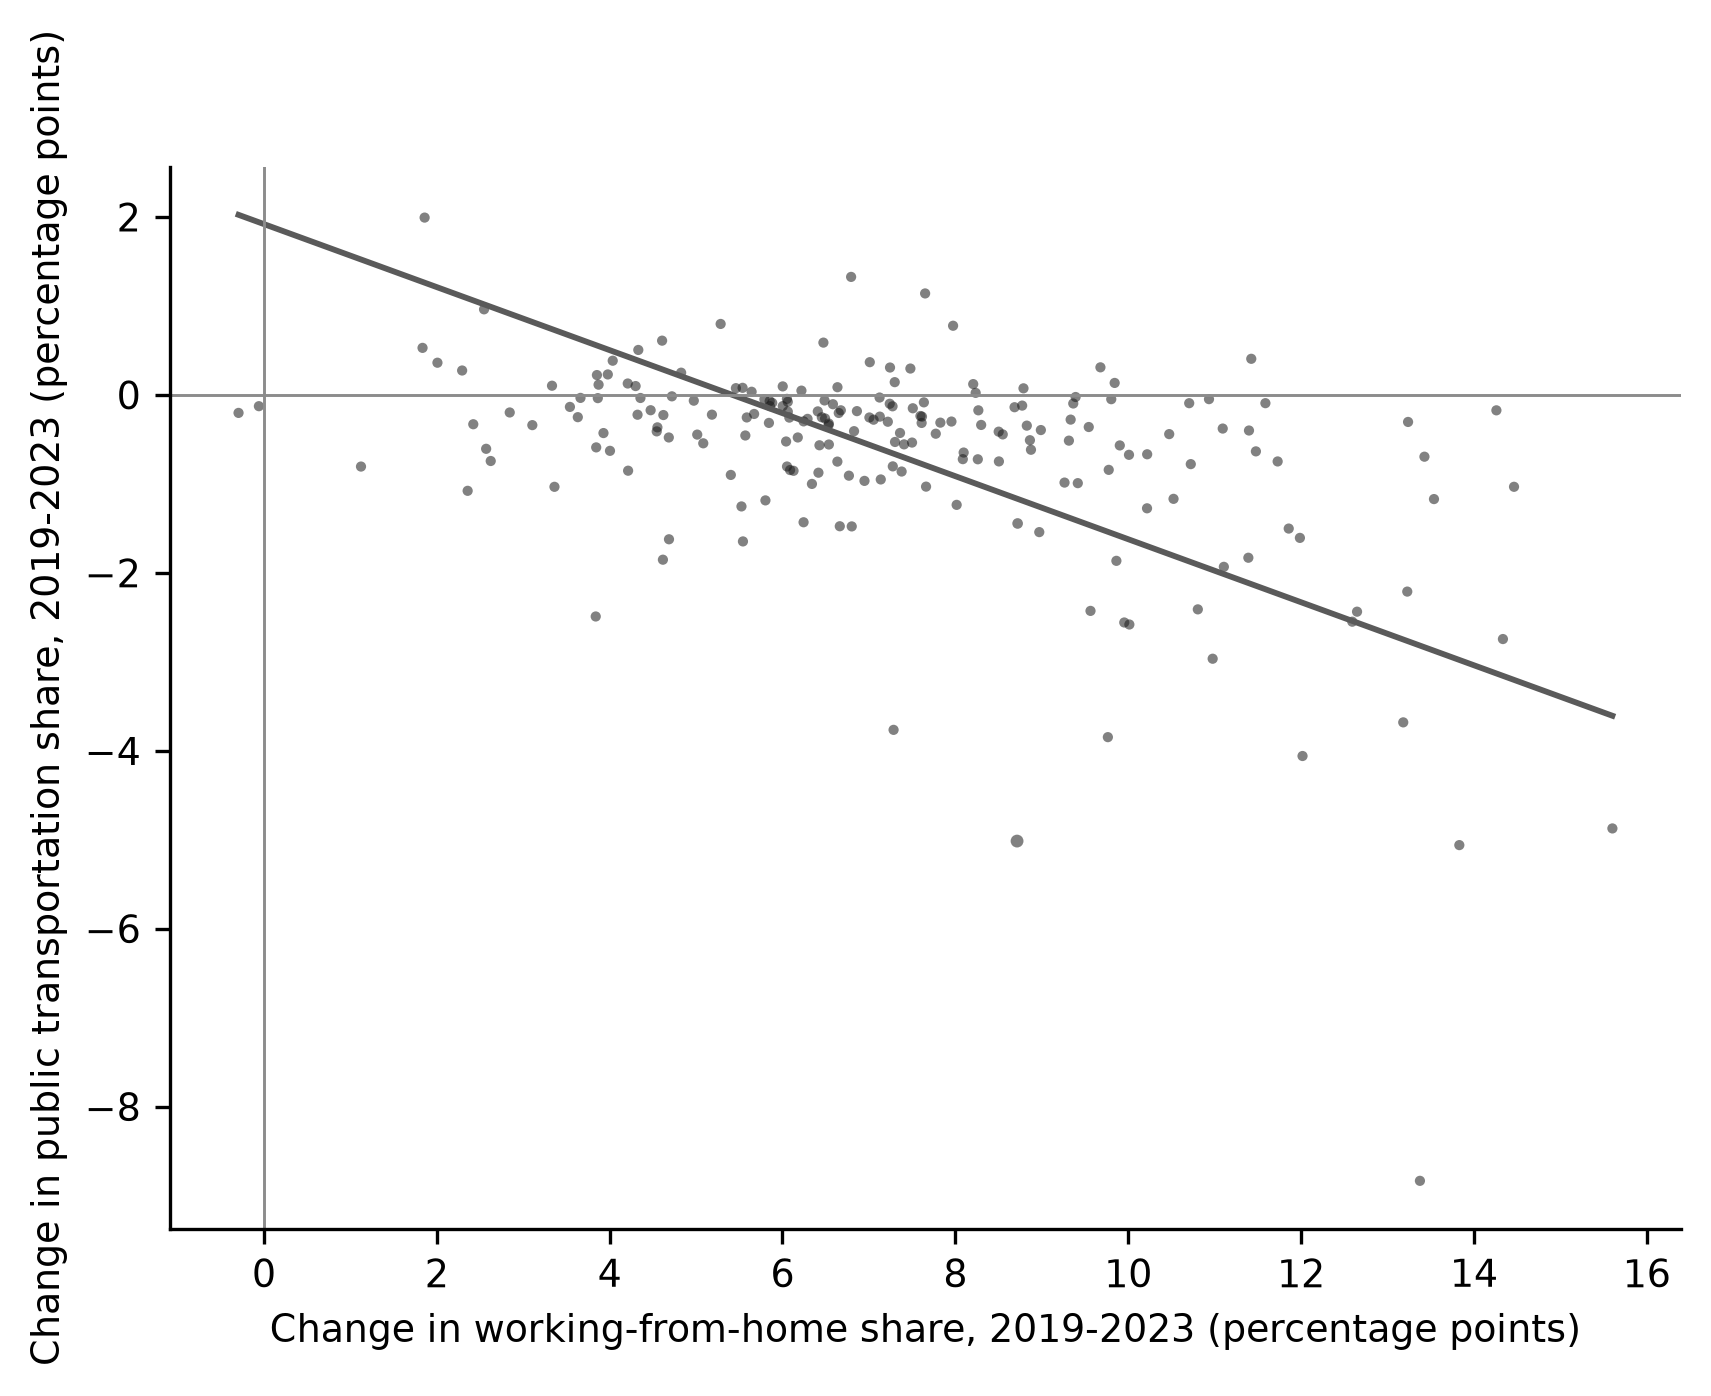
Figure 2. Change in public transportation share versus change in working-from-home share across US metropolitan areas, 2019-2023.
Note: Each point is one metropolitan area; point size is proportional to the number of workers in 2019. The line is the weighted ordinary least squares fit. Source: U.S. Census Bureau, American Community Survey 1-year estimates, table B08301.Secondary outcome
The change in the public transportation share among commuters, which excludes workers who no longer commuted, showed the same pattern. Each one percentage-point increase in working from home was associated with a −0.294 percentage-point decline in the transit share among commuters (95% CI −0.432 to −0.155, p <0.001), with 0.31 of the variance explained. Among the secondary outcomes, the association therefore remained after removing the mechanical contribution of a smaller commuting population (Table 2).
Additional and sensitivity analyses
The association was consistent when the model was estimated without weights, with a coefficient of −0.186 (95% CI −0.262 to −0.111, p <0.001), and when it was restricted to the 51 metropolitan areas with at least 500,000 workers in 2019, with a coefficient of −0.379 (95% CI −0.698 to −0.059, p 0.020). The Huber robust regression, which down-weights influential metropolitan areas, returned a coefficient of −0.112 (95% CI −0.143 to −0.081, p <0.001). The unweighted model for the secondary outcome returned a coefficient of −0.150 (95% CI −0.217 to −0.084, p <0.001), and every estimate remained statistically significant at the 0.05 level. When the 204 metropolitan areas were divided into quartiles of working-from-home change, the mean transit change among all workers decreased monotonically from −0.21 percentage points in the first quartile to −1.50 percentage points in the fourth quartile, in which working from home rose by a mean of 11.26 percentage points (Table 3).
Quartile of WFH change | Metropolitan areas | Mean WFH change (pp) | Transit change, all workers (pp) | Transit change, commuters (pp) |
|---|---|---|---|---|
Q1 (smallest) | 51 | 3.70 | −0.21 | −0.18 |
Q2 | 51 | 6.23 | −0.41 | −0.34 |
Q3 | 51 | 7.88 | −0.49 | −0.35 |
Q4 (largest) | 51 | 11.26 | −1.50 | −1.23 |
Note: WFH = working from home. Changes are percentage-point differences between 2019 and 2023. Quartiles were formed on the change in the working-from-home share. Source: U.S. Census Bureau, American Community Survey 1-year estimates, table B08301.
Decomposition of the national decline
At the national level, the public transportation share among all workers fell by −1.43 percentage points between 2019 and 2023. A decomposition of this change into the contribution of a smaller commuting population and the contribution of lower transit use among remaining commuters attributed −0.43 percentage points to fewer commuters and −1.09 percentage points to lower transit use among commuters, with an interaction of 0.09 percentage points. The transit share among commuters declined from 5.26% in 2019 to 4.10% in 2023, and the contribution of lower transit use among commuters exceeded the contribution of fewer commuters.
DISCUSSION
The main finding of this study was that the growth of working from home was associated with the decline of public transportation commuting across US metropolitan areas between 2019 and 2023, and that the association held both for the share of all workers and for the share of workers who still commuted.
The relationship was not fully explained by the mechanical loss of commuters, because the national decomposition attributed most of the decline to lower transit use among remaining commuters rather than to the reduction in the commuting population. This result indicates that remote work was a structural driver of the post-pandemic transit contraction rather than a temporary demand shock.
The finding is consistent with evidence that working from home suppresses the commute trip itself. Panel studies have reported that workers who shifted to telework made fewer work trips and spent less time traveling,( 12,14) and analyses of the United States and Germany found that telecommuting reduced trip-making and commuter travel over the long term.( 13,15)
The urban scale of the effect has been documented by work showing that working from home reshaped commuting and the spatial structure of cities.(10) Those studies measured travel in general; the present analysis extends the conclusion specifically to public transportation, the mode most exposed to the loss of the daily office commute.
The transit-specific literature points in the same direction but has emphasized the pandemic shock rather than the remote-work channel. Studies of bus ridership across the United States and of transit systems in individual cities attributed the decline to service reductions, infection risk and socioeconomic change.( 3,4,6,19)
Segmentations of riders have shown that the loss was uneven across user groups and that part of it may be permanent.( 5,17) Estimates of the elasticity of transit ridership to service changes after the pandemic suggest that supply adjustments alone cannot account for the observed contraction,( 20) even though new transit lines continued to expand commuting in some corridors.( 21)
The contribution of the present study is to show that, net of those factors, metropolitan areas that adopted working from home more intensely also lost more transit commuting, with a graded relationship across quartiles of working-from-home change that is more consistent with a behavioral substitution process than with an undifferentiated shock.
The association was stronger in the weighted model than in the unweighted model, which indicates that large metropolitan areas drove a disproportionate share of the joint change in working from home and transit commuting.
Large metros concentrate both the office employment that can be performed remotely and the transit systems that serve it, and they experienced the largest absolute losses of transit commuting. The result is compatible with findings that transit ridership is concentrated in a relatively small number of systems, that the recovery was uneven across agencies, and that the pandemic widened existing socioeconomic disparities in travel behavior and transit use.( 6,22-24)
Several mechanisms can explain why working from home and transit commuting moved together beyond the mechanical removal of trips. Remote work is most feasible for office and knowledge workers, who are overrepresented among transit commuters in central business districts, so the workers most able to stay home were also the workers most likely to ride transit.( 12)
Working from home may also have loosened the residential constraint that kept transit riders near stations, enabling relocation away from transit-rich corridors, a mechanism documented for telecommuting and residential location choice.( 25,26)
The persistence of hybrid work reduces the frequency with which even occasional transit users purchase passes, which weakens ridership habits and agency finances.( 5,27)
A related channel operates through commuting frequency: hybrid workers who travel two or three days a week may abandon monthly passes in favor of single tickets or other modes, which lowers the recorded transit commuting share even when neither the workplace nor the residence has changed. The substitution of work trips by teleworking documented during the pandemic is consistent with this interpretation, as is the finding that teleworkers reduced transit use and that mode choice shifted in the later stages of the pandemic.( 28-30)
The evidence is not confined to the largest systems: in small and medium-sized Massachusetts cities, working from home was associated with lower retention of public transportation commuting over the 2011 to 2021 period, which suggests that the same substitution operates outside the major transit markets.( 31)
The modeling literature reaches a comparable conclusion, forecasting that telecommuting produces lasting reductions in commuting and transit demand rather than a one-off shock.( 32,33)
The relationship should not be treated as homogeneous, however. Telecommuting can encourage longer commutes for those who still travel because it relaxes the penalty of distance, and some surveys of teleworkers in Adelaide and Montreal found that remote work redistributed travel rather than eliminating it altogether.( 26,34,35)
Canadian national data likewise attributed a large part of the early pandemic change in commute mode to perceived infection risk rather than to remote work per se.( 36) These qualifications do not contradict the present findings, but they indicate that the association measured here is a net effect that combines a direct trip-removal channel with residential and mode adjustments that can partially offset it.
The decomposition deserves emphasis because it separates two policy-relevant channels. The smaller contribution of fewer commuters implies that waiting for a full return to the workplace would not restore transit commuting to its 2019 level. The larger contribution of lower transit use among remaining commuters implies a genuine erosion of transit mode share among people who still travel to work. This distinction is relevant for agencies that must decide between restoring peak service for office workers and redesigning networks around the trips that persist under hybrid work, a tension already documented in the recovery period.( 7,17,22)
The decomposition therefore separates the two questions that policy discussions often conflate: whether transit lost riders because fewer people commuted, and whether it lost mode share among people who still commuted. The data show that both operated, and that the second was the larger. Comparisons with other countries support the generality of the pattern. In Australia, remote work and attitudinal change reduced commuting in post-pandemic Melbourne, and telecommuting among Adelaide employees was associated with fewer work trips.( 34,37)
In Paris, teleworking had direct and indirect effects on mobility that persisted beyond the lockdown.( 38)
Transit ridership studies outside the United States, such as the Beijing subway, likewise found that the pandemic-era demand loss did not fully recover.(39) The mechanism therefore appears to travel across contexts, although the magnitude will depend on each country's baseline transit dependence and the intensity of remote work.
The equity dimension of this finding is substantial. Transit commuting is disproportionately undertaken by lower-income workers, immigrants and workers of color, and the post-pandemic decline in transit use was itself uneven across socioeconomic groups.( 1,2,6)
If remote work removes a large share of the most reliable transit demand, the riders who remain may face thinner service, and the fiscal pressure that follows can fall most heavily on the groups that depend on transit most. The association documented here therefore connects a labor-market change in the upper part of the wage distribution to a mobility consequence in the lower part, a link that transport equity analyses of the recovery have emphasized.( 22,24)
Because the largest absolute transit losses occurred in the largest metropolitan areas, where fare revenue and service frequency are most interdependent, the fiscal strain may be concentrated precisely where transit provides the greatest social value.
Strengths and limitations
The study has several strengths. It used a single official source, the American Community Survey, which applies a consistent definition of transit commuting and working from home across all metropolitan areas and years. The analysis covered the large metropolitan areas that concentrate the overwhelming majority of transit commuting in the United States, and it weighted the estimates by the size of each labor market.
The pre-specification of the primary and secondary outcomes, the use of several sensitivity models and the reproducibility of the analysis from downloaded public files reduce the risk that the findings are artifacts of a single specification. The sample also excludes smaller metropolitan areas and non-metropolitan labor markets, so the findings should not be extrapolated to micropolitan or rural commuting, where transit use is minimal and where the remote-work transition took a different form.
The limitations should be stated explicitly. First, the design is ecological and observational, so the association cannot be interpreted as a causal effect of working from home on transit commuting; unmeasured metropolitan characteristics such as office employment structure, service cuts or safety concerns could confound the relationship, and part of the association could run in the reverse direction if employers adopted remote work in areas where transit was already weakening. Future studies should test the association with individual-level longitudinal data that link remote-work transitions to subsequent commute mode choice.
Second, the American Community Survey suppresses detailed commuting tables for smaller areas, so the analysis included 204 of the 384 metropolitan areas that existed in 2019, and the results generalize primarily to larger labor markets. Replication with pooled five-year estimates would recover smaller areas at the cost of temporal precision.(40)
Third, the Office of Management and Budget revised metropolitan boundaries between the 2019 and 2023 vintages, which introduces a small amount of measurement error in the matched areas; a sensitivity analysis limited to areas with stable definitions is recommended. Fourth, the 2020 estimates were not available in the standard Summary File, so the trajectory between 2019 and 2023 was described with the intermediate years that were published, and the change estimates capture the full pre- to post-pandemic interval without a comparable pandemic-year observation. Fifth, the outcomes are expressed as shares of workers, so the changes combine genuine mode shifts with changes in the composition of the workforce in each metropolitan area; the same percentage-point decline could reflect different underlying transitions, and the national decomposition does not identify individual-level transitions within areas.
These findings also carry implications for long-range planning. Metropolitan transportation planning relies on forecasts of commute mode share, and a persistent reduction in transit commuting that tracks remote work will propagate through travel demand models, infrastructure programming and land-use plans for decades.
The relationship estimated here provides an empirical input for scenario testing, because planners can condition expected transit demand on assumptions about the share of jobs that remain remote or hybrid.(27,29) Integrated urban modeling frameworks that couple working from home with mode and destination choice offer a way to operationalize this conditioning.( 33)
For policy, the findings imply that the fiscal and planning challenges of US transit agencies are partly structural. If working from home remains near its current level, transit systems will continue to serve a smaller and more dispersed commuting market, and fare revenue will not fully recover by itself.
Agencies and metropolitan planning organizations should incorporate remote-work scenarios into ridership forecasts and service planning, and should evaluate whether networks oriented to the traditional downtown peak still match the demand that hybrid work leaves behind. The finding also bears on housing and land-use policy: if remote work reduces the daily attachment of households to transit corridors, the transit-oriented development models that assume a commuting population may need recalibration.
CONCLUSIONS
Growth in working from home was associated with the decline of public transportation commuting across US metropolitan areas between 2019 and 2023, and the association persisted after excluding workers who stopped commuting altogether. The national decline of transit commuting was attributable more to lower transit use among remaining commuters than to the mechanical reduction in the number of commuters.
The results indicate that remote work is a structural influence on transit demand rather than a temporary pandemic effect, with durable consequences. Metropolitan areas and transit agencies that anticipate continued hybrid work should plan service and revenue accordingly, and should monitor whether the association persists, weakens or reverses as hybrid arrangements mature over the coming years.
References
- 1 Zhang Y, Xu D. Public transit commuting among U.S. immigrants: The role of English skills. Travel Behaviour and Society. 2024;37:100840. doi: 10.1016/j.tbs.2024.100840
- 2 bunten DM, Fu E, Rolheiser L, Severen C. The Problem Has Existed over Endless Years: Racialized Difference in Commuting, 1980–2019. Journal of Urban Economics. 2024;141:103542. doi: 10.1016/j.jue.2023.103542
- 3 Wilbur M, Ayman A, Sivagnanam A, Ouyang A, Poon V, Kabir R, et al. Impact of COVID-19 on Public Transit Accessibility and Ridership. Transportation Research Record: Journal of the Transportation Research Board. 2023;2677(4):531-546. doi: 10.1177/03611981231160531
- 4 Ziedan A, Lima L, Brakewood C. A multiple mediation analysis to untangle the impacts of COVID-19 on nationwide bus ridership in the United States. Transportation Research Part A: Policy and Practice. 2023;173:103718. doi: 10.1016/j.tra.2023.103718
- 5 Soria J, Edward D, Stathopoulos A. Requiem for transit ridership? An examination of who abandoned, who will return, and who will ride more with mobility as a service. Transport Policy. 2023;134:139-154. doi: 10.1016/j.tranpol.2023.02.016
- 6 Jiao J, Hansen K, Azimian A. Disparities in the Impacts of the COVID-19 Pandemic on Public Transit Ridership in Austin, Texas, U.S.A. Transportation Research Record: Journal of the Transportation Research Board. 2023;2677(4):287-297. doi: 10.1177/03611981231159906
- 7 Deka D, Liu Z. Who stopped riding buses and what would motivate them to return? A New Jersey case study. Case Studies on Transport Policy. 2024;15:101159. doi: 10.1016/j.cstp.2024.101159
- 8 Paul J. Temporary versus Permanent Pandemic Transit Leavers: Findings from the 2022 US National Household Travel Survey. Findings. 2024;2024. doi: 10.32866/001c.92046
- 9 Iogansen X, Malik JK, Lee Y, Circella G. Change in work arrangement during the COVID-19 pandemic: A large shift to remote and hybrid work. Transportation Research Interdisciplinary Perspectives. 2024;25:100969. doi: 10.1016/j.trip.2023.100969
- 10 Ramani A, Alcedo J, Bloom N. How working from home reshapes cities. Proc Natl Acad Sci USA. 2024;121(45):e2408930121. doi: 10.1073/pnas.2408930121
- 11 Conway MW, Salon D, da Silva DC, Mirtich L. How Will the COVID-19 Pandemic Affect the Future of Urban Life? Early Evidence from Highly-Educated Respondents in the United States. Urban Science. 2020;4(4):50. doi: 10.3390/urbansci4040050
- 12 Faber RM, Hamersma M, Brimaire J, Kroesen M, Molin EJE. The relations between working from home and travel behaviour: a panel analysis. Transportation. 2024;51(6):2173-2197. doi: 10.1007/s11116-023-10401-4
- 13 Böhnen C, Kuhnimhof T. Working from home and commuter travel in germany – panel data analysis of long-term effects. Transportation Research Part A: Policy and Practice. 2024;190:104257. doi: 10.1016/j.tra.2024.104257
- 14 Rüger H, Laß I, Stawarz N, Mergener A. To what extent does working from home lead to savings in commuting time? A panel analysis using the Australian HILDA Survey. Travel Behaviour and Society. 2024;37:100839. doi: 10.1016/j.tbs.2024.100839
- 15 Obeid H, Anderson ML, Bouzaghrane MA, Walker J. Does telecommuting reduce trip-making? Evidence from a U.S. panel during the COVID-19 pandemic. Transportation Research Part A: Policy and Practice. 2024;180:103972. doi: 10.1016/j.tra.2024.103972
- 16 Edward D, Soria J, Stathopoulos A. Multi-modal Machine Learning Investigation of Telework and Transit Connections. Data Sci Transp. 2024;6(2):14. doi: 10.1007/s42421-024-00100-6
- 17 Tiznado-Aitken I, Palm M, Farber S. Segmenting transit ridership: From crisis to opportunity. Transportation Research Part A: Policy and Practice. 2024;190:104239. doi: 10.1016/j.tra.2024.104239
- 18 U.S. Census Bureau. American Community Survey 1-Year Estimates: Means of Transportation to Work (table B08301), 2019-2023 [Internet]. 2024. Available from: https://www.census.gov/programs-surveys/acs
- 19 Meredith-Karam P, Kong H, Stewart A, Zhao J. Understanding and comparing the public transit and ride-hailing ridership change in Chicago during COVID-19 via statistical and survey approaches. Travel Behaviour and Society. 2024;37:100838. doi: 10.1016/j.tbs.2024.100838
- 20 Redelmeier P, El-Geneidy A. If You Cut It Will They Ride? Longitudinal Examination of the Elasticity of Public Transport Ridership in the Post-Pandemic Era. Transportation Research Record: Journal of the Transportation Research Board. 2024;2678(11):241-252. doi: 10.1177/03611981241240754
- 21 Li W, Zhong H, Boarnet MG. Effects of new transit lines on commuting: Evidence from restricted-use Census Bureau microdata. Applied Geography. 2024;164:103202. doi: 10.1016/j.apgeog.2024.103202
- 22 Karner A, LaRue S, Klumpenhouwer W, Rowangould D. Evaluating public transit agency responses to the Covid-19 pandemic in seven U.S. regions. Case Studies on Transport Policy. 2023;12:100989. doi: 10.1016/j.cstp.2023.100989
- 23 Rafiq R, McNally MG, Uddin MYS. Telecommuting and Travel during COVID-19: An Exploratory Analysis across Different Population Geographies in the U.S.A. Transportation Research Record: Journal of the Transportation Research Board. 2023;2677(4):562-582. doi: 10.1177/03611981221109182
- 24 Brough R, Freedman M, Phillips DC. Understanding socioeconomic disparities in travel behavior during the COVID‐19 pandemic. Journal of Regional Science. 2021;61(4):753-774. doi: 10.1111/jors.12527
- 25 Wang K, Ozbilen B. Synergistic and threshold effects of telework and residential location choice on travel time allocation. Sustainable Cities and Society. 2020;63:102468. doi: 10.1016/j.scs.2020.102468
- 26 Caldarola B, Sorrell S. Does teleworking encourage longer commutes? Pre-pandemic evidence from the English National Travel Survey. Travel Behaviour and Society. 2024;37:100822. doi: 10.1016/j.tbs.2024.100822
- 27 Anik MAH, Habib MA. COVID-19 and Teleworking: Lessons, Current Issues and Future Directions for Transport and Land-Use Planning. Transportation Research Record: Journal of the Transportation Research Board. 2024;2678(12):554-566. doi: 10.1177/03611981231166384
- 28 Pedreira Junior JU, Pitombo CS. Unveiling substitution patterns of work trips by teleworking and their associations with physical and virtual accessibility in the Brazilian COVID-19 crisis. Travel Behaviour and Society. 2024;34:100657. doi: 10.1016/j.tbs.2023.100657
- 29 Hensher DA, Balbontin C, Beck MJ, Wei E. Commuting mode choice and work from home in the later stages of COVID-19: Consolidating a future focussed prediction tool to inform transport and land use planning. Transportation Research Part A: Policy and Practice. 2024;187:104194. doi: 10.1016/j.tra.2024.104194
- 30 Tokey AI, Alam MS. The travel behavior, attitude, and sociodemographic characteristics of the teleworkers in post-pandemic era. World Development Sustainability. 2023;2:100066. doi: 10.1016/j.wds.2023.100066
- 31 Shakespeare RM, Srinivasan S. Demographic and Built Environment Predictors of Public Transportation Retention and Work-from-Home Changes in Small- to Medium-Sized Massachusetts Cities, 2011–2021. Sustainability. 2024;16(19):8620. doi: 10.3390/su16198620
- 32 Kogus A, Gal-Tzur A, Shiftan Y. Modelling the Long-Term Expected Impact of the Covid-19 Crisis on Commute and Telecommute. Transportation Research Record: Journal of the Transportation Research Board. 2024;2678(12):466-479. doi: 10.1177/03611981231160170
- 33 Asif Hasan Anik M, Ahsanul Habib M. Development of an integrated urban modelling framework for examining the impacts of work from home on travel behavior. Case Studies on Transport Policy. 2024;17:101244. doi: 10.1016/j.cstp.2024.101244
- 34 Chalabi G, Dia H. Telecommuting and Travel Behaviour: A Survey of White-Collar Employees in Adelaide, Australia. Sustainability. 2024;16(7):2871. doi: 10.3390/su16072871
- 35 Victoriano-Habit R, El-Geneidy A. Studying the Interrelationship between Telecommuting during COVID-19, residential local accessibility, and active travel: a panel study in Montréal, Canada. Transportation. 2024;51(3):1149-1166. doi: 10.1007/s11116-022-10369-7
- 36 Harris MA, Branion-Calles M. Changes in Commute Mode Attributed to COVID-19 Risk in Canadian National Survey Data. Findings. 2021;2021. doi: 10.32866/001c.19088
- 37 Chalabi G, Dia H. The Impacts of Remote Work and Attitudinal Shifts on Commuting Reductions in Post-COVID Melbourne, Australia. Sustainability. 2024;16(17):7289. doi: 10.3390/su16177289
- 38 Kiko M, Coulombel N, Poulhès A, Seregina T, Tremblin G. Evaluation of Direct and Indirect Effects of Teleworking on Mobility: The Case of Paris. Transportation Research Record: Journal of the Transportation Research Board. 2024;2678(3):865-878. doi: 10.1177/03611981231182973
- 39 Wang Z, Guo R, Zou L, Li T, Yao X. Impact Evaluation of COVID-19 on Transit Ridership: A Case Study of the Beijing Subway. Urban Rail Transit. 2024;10(4):297-316. doi: 10.1007/s40864-024-00224-6
- 40 Credit K, Arnao Z. A method to derive small area estimates of linked commuting trips by mode from open source LODES and ACS data. Environment and Planning B: Urban Analytics and City Science. 2023;50(3):709-722. doi: 10.1177/23998083221129614
Declarations
Funding
No financing
Conflict of interest
None
Authorship contributions
Drafting – original draft: Rómulo Esteban Montilla.
Writing–review and editing: Rómulo Esteban Montilla.