

Abstract
Introduction: Pedestrian fatalities in the United States have risen since the early 2010s, but the contribution of light condition, roadway class and vehicle type to this increase remains uncertain. Methods: All pedestrian fatalities recorded in the National Highway Traffic Safety Administration Fatality Analysis Reporting System between 2013 and 2021 were analyzed. Annual counts were modeled with Poisson regression, and the share of the 2013-2021 increase attributable to darkness, arterial roadways and light trucks or sport utility vehicles was computed. Results: Pedestrian fatalities increased from 4,779 in 2013 to 7,470 in 2021, an annual increase of 1.05 (95% CI 1.04-1.06). Darkness accounted for 85.7% of the increase and arterial roadways for 109.8%, because non-arterial fatalities declined. The differential trend was significant for darkness (interaction incidence rate ratio 1.04, 95% CI 1.02-1.05; p <0.001) and for arterial roadways (1.12, 95% CI 1.07-1.18; p <0.001). Light trucks and sport utility vehicles accounted for 39.3% of the increase, but their trend did not differ from passenger cars (interaction incidence rate ratio 1.01, 95% CI 0.99-1.02; p 0.438). Conclusions: The recent increase in United States pedestrian fatalities was concentrated in darkness and on arterial roadways, whereas light trucks and sport utility vehicles rose in parallel with passenger cars.
Keywords
pedestrians, accidents traffic, lighting, motor vehicles, United States, mortality
INTRODUCTION
Pedestrian deaths have become an increasingly large share of the traffic fatality burden of the United States. After three decades of decline, pedestrian fatalities rose by more than 40 percent between 2009 and 2016, a reversal that placed pedestrians among the fastest-growing categories of road user deaths.(1) The upward movement continued through the following years, and by the early 2020s pedestrians represented a share of motor vehicle deaths that had not been observed in the previous four decades.(2) The United States also diverged from other high-income countries, where pedestrian fatality rates kept falling while the American rate climbed.(3) Across high-income countries, walking safety improved more in Europe than in the United States, where per capita fatality rates remained higher.(4) This reversal is not a single-year anomaly; it reflects a sustained change in the conditions under which pedestrians are killed, and it has turned pedestrian safety into a central concern for transport and public health policy. Although each factor has been studied separately, the recent national increase has rarely been decomposed into the contributions of light condition, road class and vehicle type.
Darkness is the condition most consistently associated with pedestrian death. Most fatal pedestrian crashes in the United States occur at night, and the growth of pedestrian fatalities since 2009 has been faster in darkness than in daylight.(5) Nighttime deaths have been linked to roadway infrastructure, user behavior and situational factors that interact with reduced visibility.(6) Lighting levels and their photometric criteria have been modeled as determinants of nighttime pedestrian crash risk on roadway segments.(7) Analyses across the injury severity spectrum also show that lighting condition distinguishes fatal from nonfatal outcomes.(8) The temporal pattern of darkness is therefore a plausible candidate to explain part of the recent increase, yet the magnitude of its contribution has not been separated from the contribution of other factors, and it is not known whether the nighttime share of deaths simply accompanies a general rise or grows faster than the daytime share. The recent increase has accordingly been described as a nighttime phenomenon, but whether darkness explains a disproportionate share of the growth has not been quantified against the other candidate factors.
The roadway environment concentrates pedestrian deaths on specific classes of roads. Pedestrian fatal crashes in the United States cluster at a small number of locations, many of them along major roads that combine high speeds with frequent crossing demand.(9) Highways and the neighborhoods around them have also been associated with pedestrian deaths in ways that extend beyond the roadway itself.(10) Arterial roads, which carry large volumes at speeds above those of local streets, are repeatedly identified in crash analyses, but their contribution to the observed time trend, as opposed to their share of the total, remains unclear. Understanding whether the growth concentrated on these roads, rather than spreading evenly across the network, has direct consequences for where safety investment should be directed. A trend concentrated on arterials would point toward speed and road design, whereas a trend spread across all road classes would point toward broader changes in walking and travel behavior.
The type of vehicle that strikes a pedestrian modifies the risk of death. Light trucks and sport utility vehicles have long been associated with higher pedestrian injury severity and mortality than passenger cars.(11-13) Recent work confirms that large vehicles increase the severity of pedestrian and pedalcyclist injuries,(14) and state-level analyses associate light truck and sport utility vehicle exposure with pedestrian deaths.(15) The American vehicle fleet has also shifted toward utility vehicles over the past decade, which raises the question of whether that shift contributed a disproportionate share of the recent increase in pedestrian fatalities. If so, vehicle-focused countermeasures would be warranted; if not, the increase would more plausibly reside in the road environment and in exposure.
The aim of this study was to quantify trends in pedestrian fatalities in the United States between 2013 and 2021 and to estimate the contribution of light condition, roadway class and vehicle type to the observed change. Four hypotheses were derived and tested. H1 stated that pedestrian fatalities increased between 2013 and 2021. H2 stated that the increase was disproportionately concentrated in darkness. H3 stated that the increase was disproportionately concentrated on arterial roadways. H4 stated that the increase was disproportionately concentrated in crashes involving light trucks and sport utility vehicles.
METHODS
Study design and setting
A retrospective serial cross-sectional analysis of a complete national registry of fatal traffic crashes was conducted for the period 2013 to 2021. The design is ecological and time series in nature: the unit of observation is the pedestrian fatality, but the primary analyses compare annual counts and their time trends across strata defined by light condition, roadway class and vehicle type. The period was chosen because it covers a sustained rise in pedestrian deaths and ends with the last year for which complete final data were available when the study was prepared. The analysis was restricted to fatalities rather than all injuries because FARS records complete data only for fatal crashes, which makes the outcome a census rather than a sample. The reporting follows the RECORD statement for research using routinely collected data(16) and the STROBE statement for observational studies.(17)
Data source
The Fatality Analysis Reporting System (FARS) is a census of all motor vehicle crashes on public roads of the United States in which at least one person died, maintained by the National Highway Traffic Safety Administration.(18) It covers the fifty states and the District of Columbia and records crash, person and vehicle characteristics in standardized variables across three linked tables: one for the crash, one for each person involved and one for each vehicle. The annual National CSV analytical files for 2013 to 2021 were downloaded automatically from the open repository of the agency at static.nhtsa.gov, without login requirements, and the checksums of the nine archives were recorded. Each year was processed separately: pedestrian records were selected, linked to the crash table on the crash identifier to obtain light condition and year, and linked to the vehicle table on the crash identifier and the striking vehicle number to obtain the body type of the vehicle that struck the pedestrian. Records with a duplicate crash and person identifier within a year were checked and none were found, and the completeness of the three classification variables was complete for the selected records. As a further check on the extraction, the annual totals for 2013 to 2018 matched the pedestrian fatality counts published by the agency for those years, which supports the completeness of the selection. The complete analysis script and the analytic tables were retained to allow reproduction. The files for 2013 and 2014 use a rural and urban split for the roadway functional class, whereas the files from 2015 onward use a single functional system classification; both were harmonized to the named classes described below.
Variables
A pedestrian fatality was defined as a person record with a person type of pedestrian and an injury severity of fatal injury. Light condition was taken from the crash-level variable, which is coded from 1 to 9, where 1 denotes daylight, 2 dark-not lighted, 3 dark-lighted, 4 dawn, 5 dusk, 6 dark-unknown lighting and 7 to 9 other, not reported or unknown. Darkness was defined as the three dark categories (codes 2, 3 and 6), and the daylight or twilight reference category combined daylight, dawn and dusk (codes 1, 4 and 5); the other or not reported codes were excluded from the darkness contrast but retained in the totals. Roadway class was taken from the functional class variable, which is coded on a scale that distinguishes interstates, principal arterials, minor arterials, collectors and local roads. Arterial roadways were defined as principal and minor arterials, and the non-arterial reference category combined interstates, collectors and local roads; not reported or unknown codes were excluded from the contrast but retained in the totals. The striking vehicle was identified through the vehicle number linked to each pedestrian record, and its body type was classified as passenger car, utility vehicle, van, pickup, bus, medium or heavy truck, motorcycle or other. Passenger cars comprised the automobile body types, utility vehicles the sport utility body types, vans the light van body types and pickups the pickup body types. Light trucks and sport utility vehicles were defined as the combined group of utility vehicles, vans and pickups, following the body type grouping used in the literature on light truck risk, and the passenger car group was the reference for the vehicle contrast. Sex was classified as male, female or not reported, and age was obtained in years; ages of 990 years or more, which denote unknown or not reported values, were treated as missing in the age summary.
Statistical analysis
Frequencies and percentages were used for categorical characteristics, and age was summarized with the median and interquartile range because its distribution was asymmetric. Annual counts were modeled with Poisson generalized linear models with robust standard errors, using year centered at 2013 as a continuous predictor. The Poisson model was chosen because the outcome is a count and because robust standard errors accommodate mild overdispersion in annual aggregates. The first hypothesis was evaluated by regressing the annual total on year. The second to fourth hypotheses were evaluated by regressing the annual count on year, stratum and their interaction, with the interaction term expressed as an incidence rate ratio that compares the annual trend of the high-risk stratum with that of the reference stratum; a ratio above one indicates a faster increase in the high-risk stratum. Each model included the stratum main effect, so the interaction coefficient isolates the difference in trends after accounting for the average level of each stratum rather than merely reflecting the higher count in the high-risk stratum. The share of the 2013-2021 increase occurring in each stratum was computed as the ratio between the stratum-specific absolute change and the total absolute change, expressed as a percentage; values above 100 percent are possible when the complementary stratum declines, and values can be negative when a stratum falls. A sensitivity analysis repeated the total trend after excluding 2020, when travel patterns were disrupted by the pandemic. Estimates are reported with 95 percent confidence intervals, computed on the logarithmic scale and exponentiated for the incidence rate ratios, and two-sided p values below 0.05 were considered statistically significant. Analyses were performed with Python 3.14 and the pandas and statsmodels packages (statsmodels version 0.15), and the analysis script was executed twice to confirm that all reported values were reproducible.
Ethical considerations
The study used public, de-identified administrative records of fatal crashes. No individual could be identified, and no approval from an ethics committee or informed consent was required.
RESULTS
Between 2013 and 2021, FARS recorded 54,019 pedestrian fatalities in the United States (Table 1). Males accounted for 69.8% of the fatalities, and the median age was 48 years (IQR 32-61).
Characteristic | n | % |
|---|---|---|
Total | 54019 | 100.0 |
Sex, male | 37697 | 69.8 |
Sex, female | 16113 | 29.8 |
Age (years), median [P25-P75] | 48 [32-61] | |
Light condition, daylight | 11488 | 21.3 |
Light condition, dark, not lighted | 18842 | 34.9 |
Light condition, dark, lighted | 20760 | 38.4 |
Light condition, dark, unknown lighting | 677 | 1.3 |
Light condition, dawn or dusk | 1956 | 3.6 |
Light condition, other or not reported | 296 | 0.5 |
Roadway class, interstate | 6150 | 11.4 |
Roadway class, principal arterial | 19993 | 37.0 |
Roadway class, minor arterial | 13098 | 24.2 |
Roadway class, collector | 7170 | 13.3 |
Roadway class, local | 7214 | 13.4 |
Roadway class, other or not reported | 394 | 0.7 |
Striking vehicle, passenger car | 22322 | 41.3 |
Striking vehicle, SUV or utility | 10335 | 19.1 |
Striking vehicle, pickup | 8888 | 16.5 |
Striking vehicle, van | 2796 | 5.2 |
Striking vehicle, medium/heavy truck | 3436 | 6.4 |
Striking vehicle, bus | 490 | 0.9 |
Striking vehicle, motorcycle | 337 | 0.6 |
Striking vehicle, other or not reported | 5415 | 10.0 |
Note: IQR = interquartile range; SUV = sport utility vehicle. Percentages refer to the total of 54,019 pedestrian fatalities.
Darkness was recorded in 74.6% of the fatalities. Principal and minor arterials accounted for 61.3% of the fatalities, light trucks or sport utility vehicles for 40.8%, and passenger cars for 41.3%. The annual series rose in most years, with a plateau between 2017 and 2019 and a steeper increase from 2020 to 2021 (Figure 1).
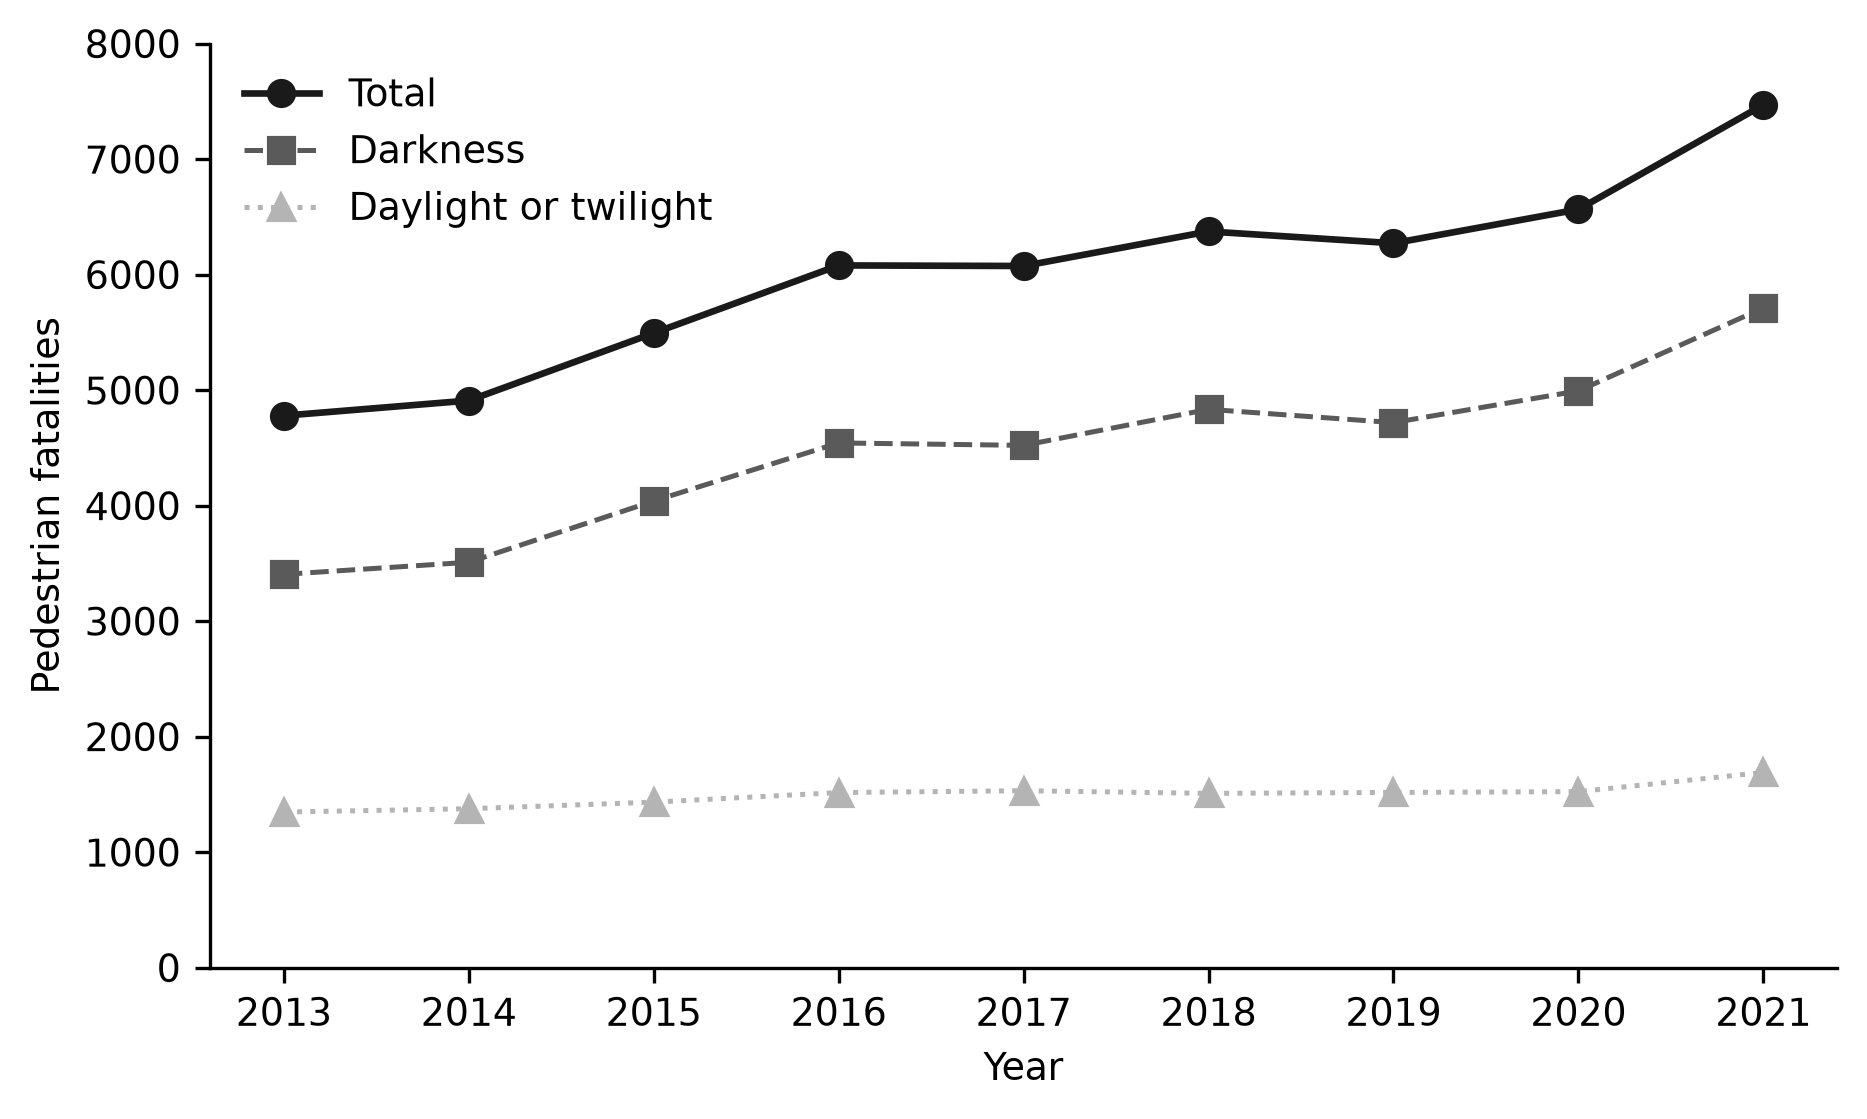
Figure 1. Annual pedestrian fatalities in the United States, 2013-2021, overall and by light condition.
Within each classification the high-risk stratum was the largest single category: darkness exceeded daylight or twilight, arterials exceeded any other road class, and light trucks or sport utility vehicles were close to passenger cars.
H1 Total trend
Pedestrian fatalities increased from 4,779 in 2013 to 7,470 in 2021, a relative change of 56.3%, equivalent to 2,691 additional deaths (Table 2).
Year | Total | Darkness | Daylight or twilight | Arterial | Non-arterial | Light truck or SUV | Passenger car |
|---|---|---|---|---|---|---|---|
2013 | 4779 | 3405 | 1347 | 1985 | 2778 | 1952 | 1962 |
2014 | 4910 | 3510 | 1376 | 2131 | 2722 | 2047 | 2055 |
2015 | 5494 | 4040 | 1433 | 3402 | 2035 | 2182 | 2385 |
2016 | 6080 | 4543 | 1516 | 3910 | 2119 | 2478 | 2574 |
2017 | 6075 | 4522 | 1532 | 3904 | 2131 | 2530 | 2557 |
2018 | 6374 | 4834 | 1509 | 4178 | 2166 | 2580 | 2710 |
2019 | 6272 | 4719 | 1517 | 4250 | 1979 | 2643 | 2530 |
2020 | 6565 | 4994 | 1524 | 4391 | 2127 | 2597 | 2589 |
2021 | 7470 | 5712 | 1690 | 4940 | 2477 | 3010 | 2960 |
Note: Darkness includes dark-not lighted, dark-lighted and dark-unknown lighting; arterial includes principal and minor arterials; light truck or SUV includes utility vehicles, vans and pickups.
The annual increase was estimated at 1.05 (95% CI 1.04-1.06; p <0.001). Excluding 2020, the annual increase was estimated at 1.05 (95% CI 1.05-1.06; p <0.001). The first hypothesis was confirmed.
H2 Darkness
Darkness accounted for 85.7% of the 2013-2021 increase, with 2,307 of the 2,691 additional deaths occurring in darkness (Table 2). Fatalities in darkness increased from 3,405 to 5,712, and fatalities in daylight or twilight increased from 1,347 to 1,690. The dark-not lighted and dark-lighted categories recorded 18,842 and 20,760 fatalities, respectively (Table 1). The annual increase was 1.06 in darkness (95% CI 1.05-1.07; p <0.001) and 1.02 in daylight or twilight (95% CI 1.01-1.03; p <0.001). The interaction estimate was 1.04 (95% CI 1.02-1.05; p <0.001), which indicates a faster annual increase in darkness (Table 3). The second hypothesis was confirmed.
H3 Arterial roadways
Arterial roadways accounted for 109.8% of the increase, a value above 100 percent because non-arterial fatalities declined from 2,778 to 2,477 (Table 2). Interstates, collectors and local roads together recorded 6,150, 7,170 and 7,214 fatalities (Table 1). Arterial fatalities increased from 1,985 to 4,940, an annual increase of 1.10 (95% CI 1.06-1.14; p <0.001). Non-arterial fatalities changed by 0.98 per year (95% CI 0.95-1.01; p 0.181). The interaction estimate was 1.12 (95% CI 1.07-1.18; p <0.001) (Table 3). The third hypothesis was confirmed.
Measure | IRR | 95% CI | p |
|---|---|---|---|
Annual trend, total | 1.05 | 1.04-1.06 | <0.001 |
Annual trend excluding 2020 | 1.05 | 1.05-1.06 | <0.001 |
Darkness vs light, differential trend | 1.04 | 1.02-1.05 | <0.001 |
Arterial vs non-arterial, differential trend | 1.12 | 1.07-1.18 | <0.001 |
Light truck or SUV vs passenger car, differential trend | 1.01 | 0.99-1.02 | 0.438 |
Note: IRR = incidence rate ratio; CI = confidence interval. The interaction IRR compares the annual trend of the high-risk stratum with that of the reference stratum.
H4 Light trucks and sport utility vehicles
Light trucks and sport utility vehicles accounted for 39.3% of the increase, with 1,058 of the 2,691 additional deaths involving these vehicles (Table 2). Within the group, utility vehicles recorded 10,335, pickups 8,888 and vans 2,796 of the 22,019 deaths (Table 1). Fatalities involving light trucks or sport utility vehicles increased from 1,952 to 3,010, an annual increase of 1.05 (95% CI 1.04-1.06; p <0.001), and fatalities involving passenger cars increased from 1,962 to 2,960, an annual increase of 1.04 (95% CI 1.03-1.06; p <0.001). The interaction estimate was 1.01 (95% CI 0.99-1.02; p 0.438), so the two trends did not differ (Table 3). The fourth hypothesis was not supported.
DISCUSSION
The increase in pedestrian fatalities in the United States between 2013 and 2021 was not distributed evenly across conditions, roads and vehicles. Darkness and arterial roadways accounted for the entire growth, with the latter exceeding the total because non-arterial deaths fell, while light trucks and sport utility vehicles rose in parallel with passenger cars. These findings place the recent worsening of pedestrian safety in two specific environments rather than across the road system as a whole, and they redirect attention from the vehicle fleet toward visibility and road design. Most previous national work has described either the level of each risk factor or the aggregate trend, and the decomposition offered here connects the two.
The overall upward trend is consistent with earlier national analyses. Pedestrian deaths rose after 2009 at a rate that reversed decades of progress,(1) and the divergence from peer countries persisted through the study period.(3) The annual increase estimated here is similar in direction to joinpoint analyses of motor vehicle fatalities, which identified a turning point in the early 2010s.(19) The most recent preliminary data indicate that the rise continued after 2021,(2) so the pattern described here is not confined to the years examined. The consistency across independent sources suggests that the trend reflects structural conditions rather than a temporary fluctuation, which makes the identification of its specific components all the more relevant for policy. The steadiness of the annual increase across the period likewise indicates a persistent pressure rather than an isolated spike. The present analysis adds to that literature by quantifying how the increase was distributed across the three candidate factors.
The concentration of the increase in darkness extends previous work on nighttime risk. Nighttime pedestrian fatalities have been examined across infrastructure, user, vehicle and situational factors, and darkness emerges as a dominant condition.(6) Analyses across the injury severity spectrum show that lighting condition distinguishes more severe outcomes,(8) and reviews of darkness-specific evidence conclude that the nighttime share of pedestrian deaths has grown.(5) The faster trend in darkness estimated here is consistent with those observations and suggests that visibility, rather than exposure alone, shapes the time course of the epidemic. Roadway lighting photometric criteria also modulate nighttime crash risk,(7) and visibility factors have been linked to injury severity in disaggregated crash data.(20) Spatial studies add that nighttime pedestrian safety varies with land use and alcohol environments,(21) which may help explain where darkness-related deaths concentrate. In line with those findings, the present estimate shows that darkness absorbed most of the increase while the daylight and twilight count barely moved, a pattern difficult to reconcile with a purely exposure-driven explanation. The finding that even the daylight and twilight count increased, although slowly, indicates that darkness does not account for the entire phenomenon, only for most of it. The similar size of the dark-lighted and dark-not lighted categories also suggests that existing lighting did not fully offset the risk associated with darkness.
The finding on arterial roadways is consistent with the geography of pedestrian crashes. Fatal pedestrian crashes in the United States cluster at a limited set of locations, many on major roads that combine high traffic volumes with crossing demand.(9) Highways and the neighborhoods around them are associated with pedestrian deaths, particularly where the road separates communities or concentrates activity.(10) The present result adds a temporal dimension: the growth was located on arterials and was driven by them, while deaths on other classes of road did not increase. This pattern is consistent with the stability of factors that influence injury severity along roads(22) and with nighttime crash pattern analyses that identify differences between segments and intersections.(23) Roads engineered for through movement may therefore have amplified the broader forces that raised pedestrian deaths, a possibility reinforced by the observation that non-arterial deaths actually fell. The decline in non-arterial deaths, although not statistically significant on its own, suggests that the forces raising fatalities were offset on slower roads.
The result for light trucks and sport utility vehicles was contrary to expectations in its trend component, although it did not contradict the established severity evidence. Earlier studies showed that light truck vehicles carry a higher mortality risk per pedestrian struck than passenger cars,(11) that fatality rates per exposure differ by vehicle type,(12) and that large sport utility vehicles kill a higher proportion of the pedestrians they strike.(13) More recent analyses confirm that large vehicles increase injury severity(14) and that state-level fatality counts track light truck and sport utility vehicle exposure.(15) The present analysis found no differential trend between the two groups, which implies that the growth in deaths involving light trucks and sport utility vehicles was proportional to the growth involving passenger cars. The finding does not negate the higher per-crash risk; it indicates that the increase over time was not preferentially attributable to these vehicles. Fleet composition, which has shifted toward utility vehicles, and vehicle design features that affect pedestrian kinematics(24) remain relevant, but their role in the trend is shared with the general growth of traffic.(25) Impact speed also modulates severity independently of vehicle type,(26) which reinforces the importance of the road and lighting conditions reported here. The rejection of this hypothesis therefore sharpens, rather than weakens, the case for environment-focused intervention. A more complete test would require fleet registration data over the same period to separate changes in exposure from changes in risk per vehicle, because the present analysis compared trends in counts rather than rates per registered vehicle.
Several mechanisms may link darkness and arterial roadways to the observed increase. Reduced visibility at night shortens the time available for drivers to react and raises effective impact speeds, and the same road that is forgiving for motorized traffic by day becomes less so after dark. Arterial corridors combine higher design speeds with frequent crossing demand, a pairing that multiplies the probability of a fatal outcome when a crash occurs. Substance use is also associated with pedestrian fatalities,(27,28) and it is more prevalent in nighttime crashes, where it may interact with poor lighting. The growth in pedestrian deaths has likewise coincided with changes in travel patterns that place more walking in darkness and on high-volume roads, including longer commutes and a shift of pedestrian activity toward the early evening. Changes in the timing of walking relative to daylight could further concentrate exposure in darkness, but exposure data were not available to test this directly.
Countermeasure evidence supports the priority assigned to lighting and road design. Lighting improvements are among the measures proposed to reduce the nighttime burden, and the evidence on darkness emphasizes both roadway illumination and the design of crossings where pedestrians are visible after dark.(5,7) Speed reduction is equally relevant, because the probability of death rises steeply with impact speed regardless of the vehicle involved.(26) Crossing treatments that shorten the distance a pedestrian is exposed to traffic, such as medians and marked crossings with adequate illumination, address the same visibility problem at the points where pedestrians interact with arterial traffic. The combination of slower speeds and better illumination on arterials addresses the two strata that absorbed the increase estimated here, and it is consistent with a Safe System perspective in which the road environment compensates for human error and limited visibility.
Social and structural factors shape where these risks fall. Disparities in traffic fatalities by race and ethnicity are documented,(29) pedestrian fatalities differ markedly by race,(30) and historical redlining is associated with contemporary pedestrian deaths.(31) These patterns suggest that the trends described here are a matter of visibility and road geometry and of who is exposed to those conditions. Neighborhoods that were historically disinvested often lie along arterial roads and receive less lighting investment, which could place their residents where the two risk factors identified here converge. These intersections suggest that the two strata identified here, darkness and arterials, are not randomly distributed across the population. Addressing the trend therefore requires attention to both the physical environment and the social geography of exposure. Trends in walking safety in high-income countries further indicate that the American outcome is not inevitable,(4) because peer countries with different road and lighting standards did not experience the same rise.
The strengths of this study include the use of a complete national census of fatal crashes rather than a sample, the standardized coding of light condition, road class and vehicle type across nine years, and the decomposition of the increase into the shares attributable to each factor. The analysis separates trend from level, which avoids attributing the increase to a factor merely because that factor is common. The use of a single data source with consistent definitions also avoided the comparability problems that arise when records from different agencies are combined. The explicit formulation and resolution of hypotheses kept the interpretation tied to the evidence rather than to the descriptive prominence of each risk factor, and the robustness of the total trend to the exclusion of 2020 indicates that the pandemic did not produce the observed pattern.
The decomposition of the increase into shares deserves a methodological caveat. The shares are descriptive quantities computed from two endpoints, and they can exceed 100 percent when the complementary stratum declines, as occurred for arterial roadways. They should be read as accounting statements of where the change occurred rather than as causal attributions, and the regression-based interaction estimates provide the corresponding inferential test. The two approaches agreed: darkness and arterial roadways showed both large shares and significant differential trends, while the vehicle contrast showed neither.
Limitations
Several limitations should be considered. First, the analysis is ecological and observational, so the associations described cannot establish causation; the results identify where the increase occurred rather than why. Future work should link the trends to exposure data on walking, travel at night and fleet composition to test mechanisms directly. Second, the road class variable changed its rural and urban coding during the study period, and the harmonization to named classes may have introduced small misclassification for the years 2013 and 2014; a sensitivity check restricted to 2015 onwards would test whether the arterial result depends on those early years. Third, the striking vehicle could not be identified when the body type was not reported, and those cases were excluded from the vehicle contrast; a sensitivity analysis that assigns the unknown cases to one of the two groups would bound the estimate and confirm that the null differential trend is not an artifact of missing body type. Fourth, age and sex were the only person-level covariates available in the analytic file, so residual confounding by other characteristics could not be ruled out. Fifth, the counts reflect the final annual files, which for the most recent years include late reports and therefore differ slightly from the figures published in the corresponding year; this does not affect the internal consistency of the trend. Sixth, the share of the increase is computed between two endpoints and could differ if another reference year were chosen, although the regression estimates do not depend on a single endpoint.
Implications
The results direct attention to two concrete targets. Roadway lighting improvements and pedestrian-oriented treatments on arterial corridors are the interventions most directly aligned with the observed pattern, and policies that reduce impact speeds on arterials could address the class of road where the growth was concentrated. The parallel trend for light trucks and sport utility vehicles suggests that vehicle-focused explanations should be considered alongside road and lighting conditions, and that the growth in these vehicles has not been the primary driver of the pedestrian fatality increase. Because the burden falls unevenly across communities, investments in lighting and arterial safety should be prioritized where pedestrian risk is already highest, an approach consistent with the equity objectives of contemporary transport policy. Programs that pair these investments with equity-based targeting would address both the observed trend and its unequal distribution. State and local agencies can apply the same decomposition to their own crash records to determine whether the national pattern holds locally before allocating funds.
CONCLUSIONS
Pedestrian fatalities in the United States increased steadily between 2013 and 2021, and the annual change remained similar when the pandemic year was excluded. The increase was concentrated in darkness, which absorbed most of the growth, and on arterial roadways, where the rise exceeded the total because non-arterial fatalities declined. The contribution of light trucks and sport utility vehicles to the increase did not differ from that of passenger cars. The findings locate the recent worsening of pedestrian safety in the night and on major roads rather than in the changing vehicle fleet, and they favor interventions in the road environment over a focus on the vehicle fleet alone.
References
- 1 Schneider RJ. United States Pedestrian Fatality Trends, 1977 to 2016. Transportation Research Record: Journal of the Transportation Research Board. 2020;2674(9):1069-1083. doi: 10.1177/0361198120933636
- 2 Governors Highway Safety Association. Pedestrian Traffic Fatalities by State: 2022 Preliminary Data [Internet]. 2023. Available from: https://www.ghsa.org/resources/Pedestrians23
- 3 Buehler R, Pucher J. The growing gap in pedestrian and cyclist fatality rates between the United States and the United Kingdom, Germany, Denmark, and the Netherlands, 1990–2018. Transport Reviews. 2021;41(1):48-72. doi: 10.1080/01441647.2020.1823521
- 4 Buehler R, Pucher J. Trends in Walking and Cycling Safety: Recent Evidence From High-Income Countries, With a Focus on the United States and Germany. Am J Public Health. 2017;107(2):281-287. doi: 10.2105/ajph.2016.303546
- 5 Sanders RL, Schneider RJ, Proulx FR. Pedestrian fatalities in darkness: What do we know, and what can be done?. Transport Policy. 2022;120:23-39. doi: 10.1016/j.tranpol.2022.02.010
- 6 Ferenchak NN, Abadi MG. Nighttime pedestrian fatalities: A comprehensive examination of infrastructure, user, vehicle, and situational factors. Journal of Safety Research. 2021;79:14-25. doi: 10.1016/j.jsr.2021.07.002
- 7 Li Q, Wang Z, Kolla RDTN, Li M, Yang R, Lin PS, et al. Modeling effects of roadway lighting photometric criteria on nighttime pedestrian crashes on roadway segments. Journal of Safety Research. 2023;86:253-261. doi: 10.1016/j.jsr.2023.07.004
- 8 Ferenchak NN, Gutierrez RE, Singleton PA. Shedding light on the pedestrian safety crisis: An analysis across the injury severity spectrum by lighting condition. Traffic Injury Prevention. 2022;23(7):434-439. doi: 10.1080/15389588.2022.2100362
- 9 Schneider RJ, Sanders R, Proulx F, Moayyed H. United States fatal pedestrian crash hot spot locations and characteristics. JTLU. 2021;14(1):1-23. doi: 10.5198/jtlu.2021.1825
- 10 Nehiba C, Tyndall J. Highways and pedestrian deaths in US neighborhoods. Regional Science and Urban Economics. 2023;102:103938. doi: 10.1016/j.regsciurbeco.2023.103938
- 11 Roudsari BS, Mock CN, Kaufman R, Grossman D, Henary BY, Crandall J. Pedestrian crashes: higher injury severity and mortality rate for light truck vehicles compared with passenger vehicles. Inj Prev. 2004;10(3):154-158. doi: 10.1136/ip.2003.003814
- 12 Paulozzi LJ. United States pedestrian fatality rates by vehicle type. Inj Prev. 2005;11(4):232-236. doi: 10.1136/ip.2005.008284
- 13 Simms CK, Wood DP. Pedestrian Risk from Cars and Sport Utility Vehicles - A Comparative Analytical Study. Proceedings of the Institution of Mechanical Engineers, Part D: Journal of Automobile Engineering. 2006;220(8):1085-1100. doi: 10.1243/09544070jauto319
- 14 Edwards M, Leonard D. Effects of large vehicles on pedestrian and pedalcyclist injury severity. Journal of Safety Research. 2022;82:275-282. doi: 10.1016/j.jsr.2022.06.005
- 15 Hafeez Z, Mehta M. What factors impact pedestrian and cyclist fatalities? A state level analysis. Inj Epidemiol. 2021;8(S1):35. doi: 10.1186/s40621-021-00315-z
- 16 Benchimol EI, Smeeth L, Guttmann A, Harron K, Moher D, Petersen I, et al. The REporting of studies Conducted using Observational Routinely-collected health Data (RECORD) Statement. PLoS Med. 2015;12(10):e1001885. doi: 10.1371/journal.pmed.1001885
- 17 Strengthening the reporting of observational studies in epidemiology (STROBE) statement: guidelines for reporting observational studies. BMJ. 2007;335(7626). doi: 10.1136/bmj.39386.490150.94
- 18 National Highway Traffic Safety Administration. Fatality Analysis Reporting System (FARS) National CSV analytical files, 2013-2021 [Internet]. 2022. Available from: https://static.nhtsa.gov/nhtsa/downloads/FARS/2021/National/FARS2021NationalCSV.zip
- 19 Bandi P, Silver D, Mijanovich T, Macinko J. Temporal trends in motor vehicle fatalities in the United States, 1968 to 2010 - a joinpoint regression analysis. Inj Epidemiol. 2015;2(1):4. doi: 10.1186/s40621-015-0035-6
- 20 Harris L, Ahmad N, Khattak A, Chakraborty S. Exploring the Effect of Visibility Factors on Vehicle–Pedestrian Crash Injury Severity. Transportation Research Record: Journal of the Transportation Research Board. 2023;2677(11):24-35. doi: 10.1177/03611981231164070
- 21 Long B, Ferenchak NN. Spatial Equity Analysis of Nighttime Pedestrian Safety: Role of Land Use and Alcohol Establishments in Albuquerque, NM. Transportation Research Record: Journal of the Transportation Research Board. 2021;2675(12):622-634. doi: 10.1177/03611981211030263
- 22 Tamakloe R, Adanu EK, Atandzi J, Das S, Lord D, Park D. Stability of factors influencing walking-along-the-road pedestrian injury severity outcomes under different lighting conditions: A random parameters logit approach with heterogeneity in means and out-of-sample predictions. Accident Analysis & Prevention. 2023;193:107333. doi: 10.1016/j.aap.2023.107333
- 23 Hossain A, Sun X, Shahrier M, Islam S, Alam S. Exploring nighttime pedestrian crash patterns at intersection and segments: Findings from the machine learning algorithm. Journal of Safety Research. 2023;87:382-394. doi: 10.1016/j.jsr.2023.08.010
- 24 Hu J, Klinich KD. Toward designing pedestrian-friendly vehicles. IJVS. 2015;8(1):22. doi: 10.1504/ijvs.2015.066272
- 25 Schubert A, Babisch S, Scanlon JM, Campolettano ET, Roessler R, Unger T, et al. Passenger and heavy vehicle collisions with pedestrians: Assessment of injury mechanisms and risk. Accident Analysis & Prevention. 2023;190:107139. doi: 10.1016/j.aap.2023.107139
- 26 Kröyer HRG. Is 30 km/h a ‘safe’ speed? Injury severity of pedestrians struck by a vehicle and the relation to travel speed and age. IATSS Research. 2015;39(1):42-50. doi: 10.1016/j.iatssr.2014.08.001
- 27 Thomas M, Tillman P, Riemann BL. Blood alcohol concentration as a measure of risk among pedestrian fatalities in the U.S., 2016–2020. Traffic Injury Prevention. 2023;24(7):513-520. doi: 10.1080/15389588.2023.2229469
- 28 Thomas M, Riemann B, Jones J. Epidemiology of alcohol and drug screening among pedestrian fatalities in the United States, 2014–2016. Traffic Injury Prevention. 2019;20(6):557-562. doi: 10.1080/15389588.2019.1622006
- 29 Raifman MA, Choma EF. Disparities in Activity and Traffic Fatalities by Race/Ethnicity. American Journal of Preventive Medicine. 2022;63(2):160-167. doi: 10.1016/j.amepre.2022.03.012
- 30 Sanders RL, Schneider RJ. An exploration of pedestrian fatalities by race in the United States. Transportation Research Part D: Transport and Environment. 2022;107:103298. doi: 10.1016/j.trd.2022.103298
- 31 Taylor NL, Porter JM, Bryan S, Harmon KJ, Sandt LS. Structural Racism and Pedestrian Safety: Measuring the Association Between Historical Redlining and Contemporary Pedestrian Fatalities Across the United States, 2010‒2019. Am J Public Health. 2023;113(4):420-428. doi: 10.2105/ajph.2022.307192
Declarations
Funding
No financing
Conflict of interest
None
Authorship contributions
Drafting – original draft: Edixon Chacón Guerrero, Rómulo Esteban Montilla.
Writing–review and editing: Edixon Chacón Guerrero, Rómulo Esteban Montilla.