

Abstract
Introduction: The COVID-19 pandemic sharply reduced public transport use, but the recovery of transit mobility across Latin American cities and its relation to policy stringency remain unclear. Methods: Ecological panel study combining Google COVID-19 Community Mobility Reports with the Oxford COVID-19 Government Response Tracker, March 2020 to September 2022. The sample comprised 924 municipalities in 8 countries and a country-month panel of 14 countries. Monthly transit station mobility, percentage change from a pre-pandemic baseline, was modeled against the monthly StringencyIndex, crude and adjusted for country and calendar month or for a linear time trend. Results: Regional transit mobility reached a trough of −69.9% below baseline in Apr 2020. By the third quarter of 2022 the median country stood 9.1% above baseline (IQR 3.4 to 13.5); 52.5% of cities were at or above baseline. Each ten-point increase in stringency was associated with changes of −8.6 percentage points in the crude analysis (95% CI −9.9 to −7.4) and −9.0 after adjustment (95% CI −10.2 to −7.8), attenuating to −3.2 (95% CI −4.1 to −2.2) after accounting for the secular trend. Mean stringency was not correlated with late-pandemic recovery (rho = 0.09; p = 0.76). Conclusions: Transit mobility collapsed deeply in 2020 and recovered to or above baseline by late 2022. Contemporaneous stringency was strongly associated with lower transit mobility, but average stringency was not associated with the eventual level of recovery.
Keywords
COVID-19, public transportation, cities, Latin America, health policy
INTRODUCTION
The COVID-19 pandemic produced the largest and most abrupt disruption of urban mobility in recent history. Public transport was hit hardest, because it concentrates many people in shared vehicles and stations and because its use was directly targeted by stay-at-home orders, capacity limits and temporary service suspensions. Global analyses documented that transit ridership fell by more than half in many cities during the first wave of 2020, and that the recovery that followed was slow and incomplete in several regions.(1,2) In Latin America, where a large share of daily trips depends on buses, metro lines and bus rapid transit corridors, the decline was especially severe. Reported public transport use dropped by 50 to 80 percent in major cities during the strictest phases of 2020,(3,4) and the restrictions were visible in ridership and in secondary indicators such as traffic and air pollution across the region.(5) Latin American cities entered the pandemic with high dependence on public transport and pronounced inequalities in access to mobility, and the transit system became a focal point of the public health response and of the subsequent policy debate about urban mobility.(6,7) In many of these cities buses, metro lines and informal vans carry the majority of daily trips, and transit stations are the points through which low-income workers reach employment, education and services, so the fall in station mobility was a transport phenomenon and, at the same time, a signal of lost economic activity and reduced access to essential destinations. The collapse threatened the financial viability of operators and the accessibility of households that had no alternative to collective transport.(6)
Several open data products made it possible to monitor these changes at scale. The Google COVID-19 Community Mobility Reports recorded daily changes in visits to transit stations relative to a pre-pandemic baseline for hundreds of subnational units across the world.(8,9) The Oxford COVID-19 Government Response Tracker quantified the strictness of containment policies with a comparable index across countries.(10) Because both sources are reported at fine geographic and temporal resolution, they allow the same construct to be traced from the initial collapse through the recovery across hundreds of cities, something that operator-level records rarely permit in a comparable form.(9,11) Studies that combined these sources showed a consistent negative association between policy stringency and population mobility,(12,13) and the same index has predicted reductions in other discretionary activities such as hotel stays.(14) The strength of the association nevertheless varied with the strictness and the enforcement of each measure, particularly in the Global South, where informal work and limited state capacity shaped how much movement actually fell.(15,16) By 2022 transit demand had recovered only partially in several high-income cities of Europe and North America,(17-19) but systematic evidence on the recovery of transit station mobility across Latin American cities remained scarce.
The distinction between the immediate response to restrictions and the eventual recovery matters for transport policy. If stricter policies only shifted mobility in time without changing its level by late 2022, the long-run damage to transit could be limited; if they left persistent deficits, targeted support for operators and users would be justified. The study therefore distinguished two questions that are often conflated: the short-run response of transit mobility to the strictness of restrictions, and the longer-run level at which mobility stabilized once restrictions were lifted. The present study addressed both with an ecological panel design that exploits the daily mobility series and the national policy index. The objective was to describe the recovery of mobility to transit stations in Latin American cities between 2020 and 2022 and to estimate its association with the stringency of government responses.
METHODS
Design and setting
An ecological longitudinal study was conducted with subnational urban units in Latin America from March 2020 to September 2022. Daily observations were aggregated to monthly means to reduce day-of-week noise, to stabilize municipalities with intermittent reporting and to align the mobility series with the monthly policy index. The study period begins with the first month for which mobility is available for every country and ends with the last complete month before the mobility series was discontinued in October 2022. The design follows the Strengthening the Reporting of Observational Studies in Epidemiology statement for observational studies. Two complementary analytic levels were used. The municipality-level sample described the recovery of cities, and the country-month panel estimated the association with policy stringency, which is a national attribute that does not vary within countries. The ecological design was chosen because both the mobility outcome and the policy exposure are available only in aggregated form, and because it allows the recovery of hundreds of cities to be described with a single comparable measure.
Data sources
Mobility data were obtained from the Google COVID-19 Community Mobility Reports, which provide daily percentage changes in the number of visits to places classified as transit stations, including subway, bus and train stations.(8) The reference value is the median of the corresponding day of the week during the period from January 3 to February 6, 2020, so a value of zero corresponds to the pre-pandemic baseline and a value of minus 40 indicates a 40 percent reduction. The data are produced from aggregated, anonymized location history of users who opted into this service, and they are reported at the national level and, where available, at the first and second administrative levels. Country-level files for 2020, 2021 and 2022 were downloaded programmatically from the public repository at google.com/covid19/mobility; the series cover February 2020 to October 2022. Policy data were obtained from the Oxford COVID-19 Government Response Tracker, which records a StringencyIndex for every country and day on a scale from 0 to 100, with higher values indicating stricter containment and closure policies.(10) The index is a composite of nine policy indicators, including school and workplace closures, stay-at-home requirements, restrictions on gatherings and public transport closures, normalized to a common scale. The national file was downloaded from the public GitHub repository of the tracker on the same date. Both sources are public, aggregated, free of charge and do not require authentication.
The three annual mobility files of each country were concatenated and duplicate records were removed. Daily records were then collapsed into monthly means for each country and for each municipality. The daily stringency values were collapsed into monthly means per country in the same way, so that every mobility observation was aligned with the policy index of the same country and calendar month. No imputation was applied. A monthly value was computed only from the valid daily observations available in that month, and months with no valid observations were treated as missing. The mobility series ends on October 15, 2022, when Google discontinued the reports, which is why the analysis window closes in September 2022.
Study units
The municipality-level sample comprised the municipalities that met the eligibility criteria, distributed across the eight Latin American countries for which Google reported municipality-level transit mobility: Argentina, Bolivia, Brazil, Chile, Colombia, Ecuador, Guatemala and Peru. A municipality was eligible when it had at least 400 valid daily transit observations in total and at least 24 months with at least ten valid daily observations between February 2020 and September 2022. These thresholds excluded places whose series were too sparse to support stable monthly means while retaining municipalities with established transit activity. The country-month panel comprised all 14 Latin American countries with a national transit series and a matching StringencyIndex. Mexico, Uruguay, Paraguay and the Dominican Republic report subnational mobility only at the first administrative level, and Costa Rica and Panama report only national mobility; these six countries were included in the country panel but not in the municipality-level sample, because a state or a country is not equivalent to a city. Municipality-level transit mobility was reported for 3,469 municipalities in the eight countries; 2,545 were excluded for insufficient coverage, leaving 924 municipalities in the city sample. The six countries without municipality-level data differ from the eight with it in the granularity of their reporting rather than in the availability of a national series, and they were retained in the country panel to avoid restricting the analysis to countries with finer data. The national series are complete for all 14 countries in every month of the study window.
Variables
The outcome was the monthly mean of the daily transit station mobility, expressed as percentage change from the pre-pandemic baseline. Recovery was quantified with two measures. The trough was defined as the lowest monthly mean reached during 2020, and the recovery level was defined as the mean mobility of July to September 2022, the last complete quarter of the series. A city was classified as recovered when its third-quarter 2022 mean was at or above zero and as near-recovered when it was within ten percentage points of the baseline. The transit station category includes subway, bus and train stations, so it captures the segment of urban mobility most dependent on collective transport, which is the segment most directly affected by capacity limits and service suspensions. The exposure was the monthly mean of the national StringencyIndex, computed by averaging the daily index of each country within each calendar month. The country-level mean StringencyIndex over the study period ranged from 42.2 to 60.8, providing variation across countries in the average strictness of the responses.
Statistical analysis
Distributions were summarized with medians and interquartile ranges because several of them were skewed. The association between policy stringency and transit mobility was estimated with ordinary least squares on the country-month panel of 434 observations. Three specifications were fitted. The crude model regressed monthly transit mobility on the StringencyIndex alone. The second model added country fixed effects, which absorb time-invariant differences between countries, and calendar-month fixed effects, which absorb seasonal patterns. The third model replaced the calendar-month effects with a linear time trend to remove the common secular trajectory of the pandemic while retaining within-country variation in stringency; this specification was prespecified as a sensitivity analysis because the crude association may otherwise confound the effect of restrictions with the shared course of the pandemic. Standard errors were clustered by country in all models to account for serial dependence within countries, and coefficients were expressed per ten-point increase in the index, with 95% confidence intervals. Ten points were chosen as the scaling unit because it represents approximately one tenth of the range of the index and corresponds to a substantively meaningful change in the intensity of restrictions. A cross-country Spearman correlation assessed the association between the country-level mean StringencyIndex over the study period and the third-quarter 2022 mobility, using one observation per country. This correlation is descriptive and was prespecified to complement the panel estimates, which identify the association from within-country variation over time. Statistical significance was set at 0.05, two-sided. Analyses were run in Python with pandas, statsmodels and SciPy, and the entire pipeline was executed twice to confirm that the derived estimates were identical.
Ethical considerations
The study used public, aggregated and anonymized secondary data that contain no individual identifiers. No ethical approval was required.
RESULTS
Study units
The country-month panel included 14 countries and 434 observations over 31 months, with complete national mobility and stringency series for every country and month. Of the 3,469 municipalities with reported transit mobility in the eight reporting countries, 2,545 were excluded for insufficient coverage and 924 cities were analyzed. Brazil contributed 519 municipalities, Argentina 180 and Peru 64; Chile, Colombia, Ecuador, Bolivia and Guatemala contributed 46, 48, 28, 23 and 16 municipalities, respectively (Table 1).
Country | Municipalities (n) | Mean StringencyIndex | 2020 trough (%) | Trough month | Q3 2022 mobility (%) |
|---|---|---|---|---|---|
Colombia | 48 | 56.60 | -76.90 | Apr 2020 | 46.14 |
Ecuador | 28 | 54.07 | -79.17 | Apr 2020 | 34.73 |
Bolivia | 23 | 46.67 | -83.67 | Apr 2020 | 22.87 |
Dominican Republic | 0 | 51.73 | -81.30 | Apr 2020 | 13.70 |
Chile | 46 | 58.29 | -64.83 | Jun 2020 | 12.91 |
Mexico | 0 | 49.72 | -57.84 | May 2020 | 12.65 |
Argentina | 180 | 59.00 | -66.57 | Apr 2020 | 12.15 |
Brazil | 519 | 54.00 | -53.60 | Apr 2020 | 6.03 |
Panama | 0 | 56.11 | -79.07 | Apr 2020 | 6.01 |
Uruguay | 0 | 42.16 | -55.53 | Apr 2020 | 5.58 |
Guatemala | 16 | 58.10 | -69.50 | Apr 2020 | 2.66 |
Peru | 64 | 60.84 | -84.23 | Apr 2020 | -0.30 |
Paraguay | 0 | 49.33 | -70.20 | Apr 2020 | -8.30 |
Costa Rica | 0 | 48.88 | -61.80 | Apr 2020 | -11.89 |
Note: Municipalities are the eligible cities in the municipality-level sample; zero indicates that municipality-level mobility was not reported for that country. StringencyIndex ranges from 0 to 100.
Because the transit category is reported only where Google detects transit station activity, the retained municipalities are those with functioning transit systems rather than a random sample of all municipalities.
Descriptive data
Among the 14 countries, transit station mobility reached a median trough of −69.8% below the baseline (IQR −79.1 to −62.6), with the regional minimum recorded in Apr 2020. The deepest troughs were observed in Peru (−84.2%) and Bolivia (−83.7%), and the shallowest in Brazil (−53.6%) and Uruguay (−55.5%) (Table 1). The trough occurred in April 2020 in twelve of the 14 countries, in May 2020 in Mexico and in June 2020 in Chile (Table 1). The country-level mean StringencyIndex over the study period ranged from 42.2 in Uruguay to 60.8 in Peru, and within every country the monthly index rose during the strict phases of 2020 and early 2021 and declined thereafter (Figure 1).
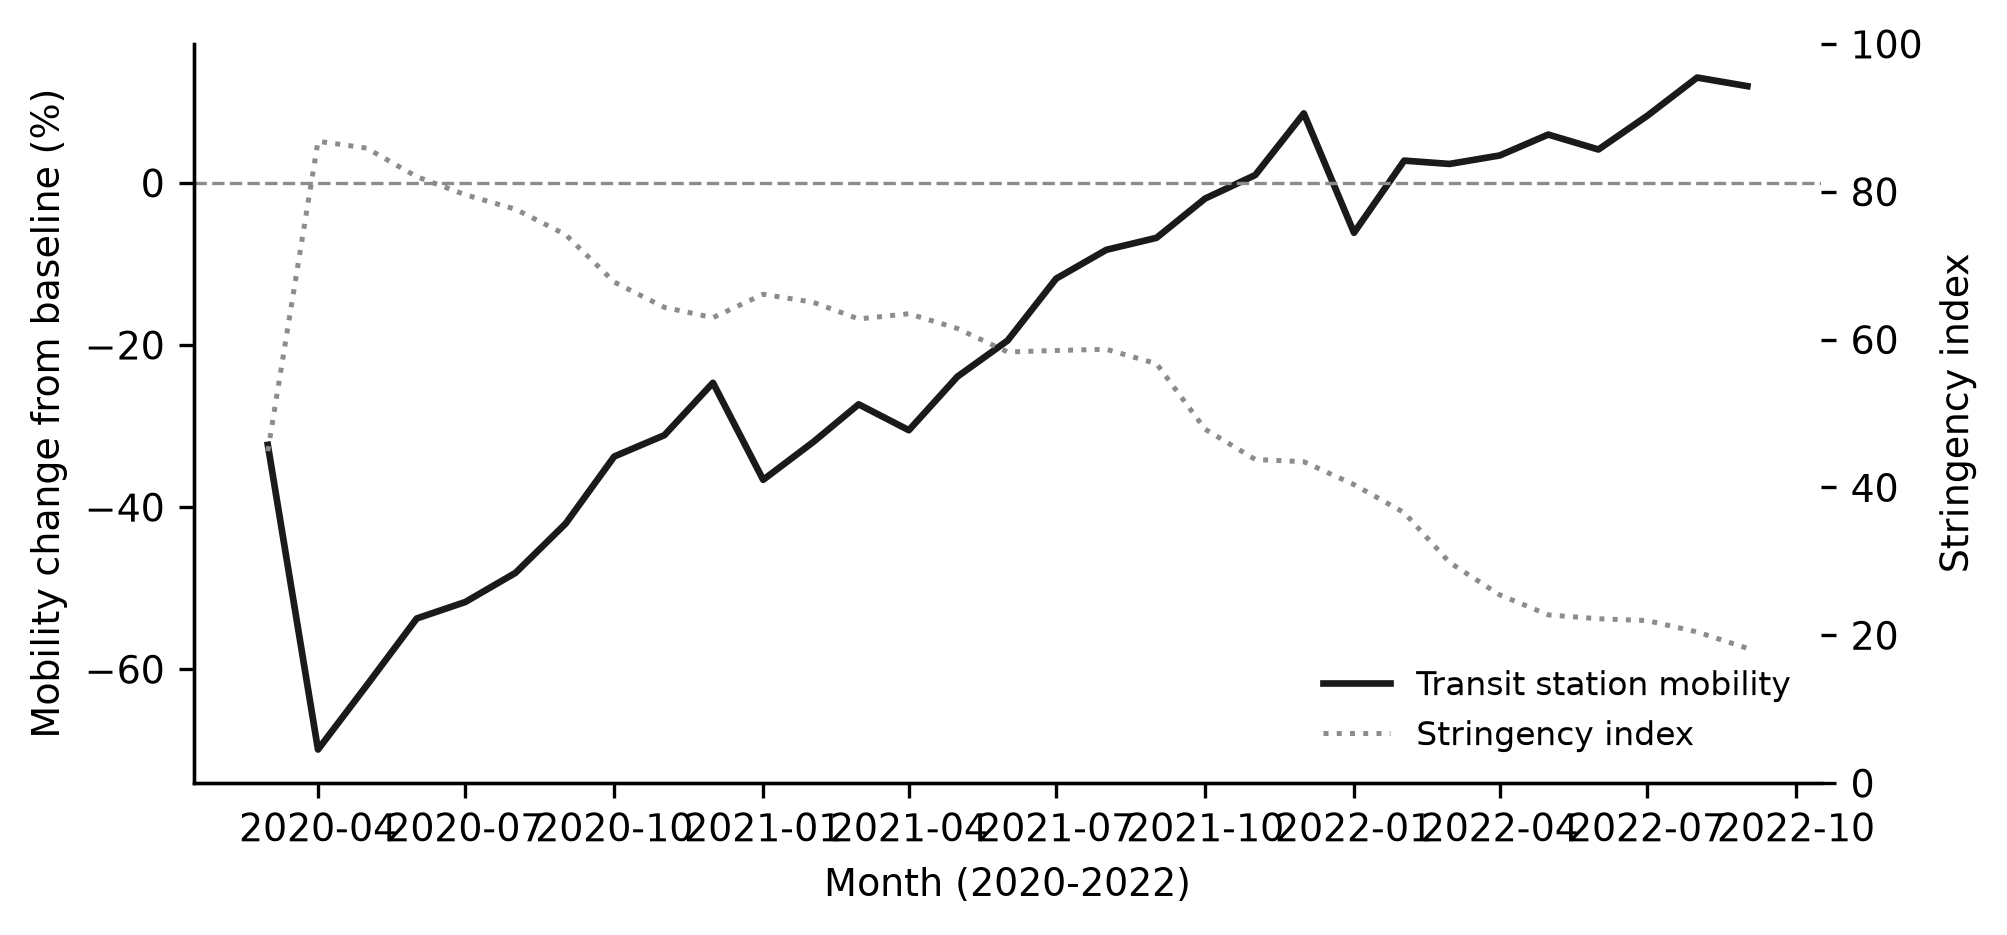
Figure 1. Monthly mean transit station mobility across Latin America and mean StringencyIndex, March 2020 to September 2022.
The regional mean fell from −32.3% below the baseline in March 2020 to −69.9% in Apr 2020, recovered to −24.7% below the baseline by December 2020, and dipped again to −36.6% in January 2021 during the second wave. The series crossed the baseline in November 2021, fell to −6.1% in January 2022, and then remained above the baseline from February 2022 onward, reaching 13.0% in August 2022 (Figure 1). By the third quarter of 2022 the median country stood 9.1% above the baseline (IQR 3.4 to 13.5).
The recovery level ranged from −11.9% below the baseline in Costa Rica to 46.1% above it in Colombia, with Ecuador and Bolivia also exceeding the baseline by more than twenty percentage points (Table 1).
Among the 924 municipalities, 52.5% were at or above the baseline and 64.8% were within ten percentage points of it in the third quarter of 2022. The median municipality reached a third-quarter 2022 level of 2.1% (IQR −21.4 to 25.2) after a median 2020 trough of −65.8% below the baseline.
The interquartile range of third-quarter 2022 mobility across municipalities therefore spanned more than forty percentage points, from −21.4% to 25.2%. Cities with the deepest 2020 troughs tended to recover less completely, although the dispersion around this pattern was wide (Figure 2).
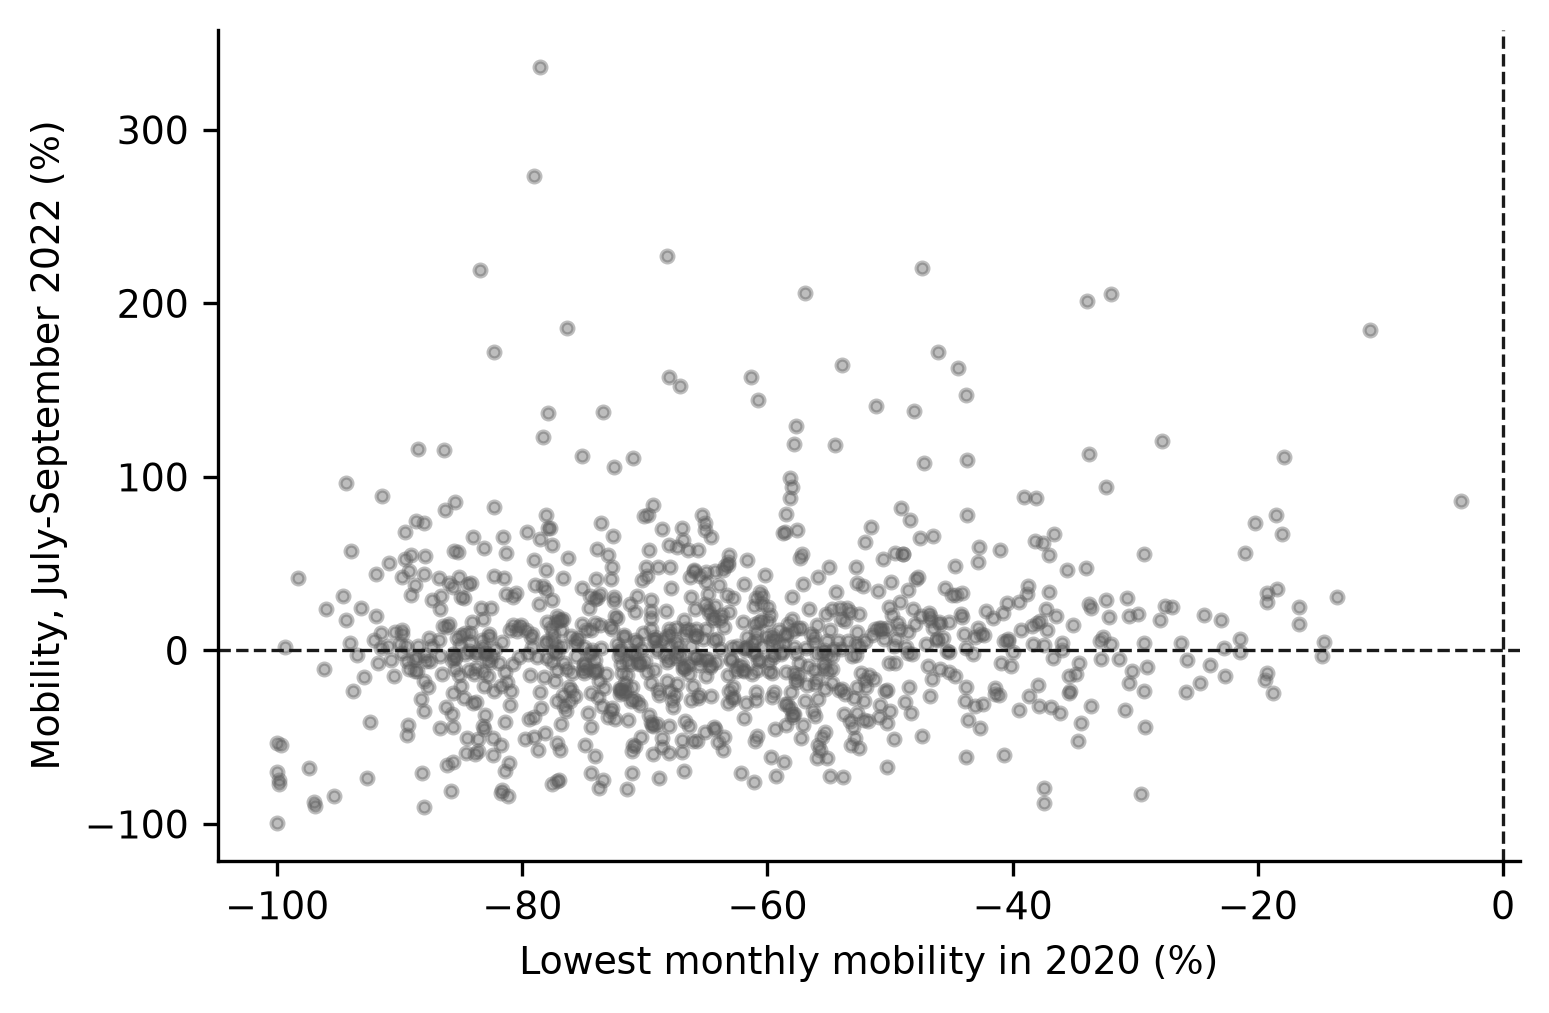
Figure 2. Third-quarter 2022 transit station mobility versus the lowest monthly mobility of 2020 in 924 municipalities.
Main results
In the crude analysis, each ten-point increase in the StringencyIndex was associated with a change of −8.6 percentage points in monthly transit mobility (95% CI −9.9 to −7.4; p <0.001). After adjustment for country and calendar month, the estimate was −9.0 percentage points per ten points of stringency (95% CI −10.2 to −7.8; p <0.001) (Table 2).
Model | Change per 10 points (95% CI) | p |
|---|---|---|
Crude | −8.6 (−9.9 to −7.4) | <0.001 |
Adjusted for country and calendar month | −9.0 (−10.2 to −7.8) | <0.001 |
Adjusted for country and linear trend | −3.2 (−4.1 to −2.2) | <0.001 |
Note: Coefficients are the change in transit station mobility, in percentage points, per ten-point increase in the StringencyIndex. All models were fitted by ordinary least squares on 434 country-month observations with standard errors clustered by country. CI = confidence interval.
In every specification the confidence interval excluded zero, and the point estimates were negative. The crude model explained 0.60 of the variance in monthly transit mobility, and the adjusted model explained 0.77.
Other analyses
With respect to the common secular trajectory of the pandemic, the association persisted but attenuated. When the calendar-month effects were replaced by a linear time trend, each ten-point increase in stringency was associated with a change of −3.2 percentage points (95% CI −4.1 to −2.2; p <0.001) (Table 2), an estimate smaller in absolute value than the month-adjusted estimate of −9.0 percentage points. The cross-country Spearman correlation between the mean StringencyIndex over the study period and third-quarter 2022 mobility was 0.09 (p = 0.76) (Figure 3; Table 3).
Measure | Value | p |
|---|---|---|
Spearman rho, mean StringencyIndex versus Q3 2022 mobility | 0.09 | 0.76 |
R2, crude model | 0.60 | |
R2, adjusted model | 0.77 |
Note: The correlation uses 14 country observations. R2 is the coefficient of determination of the crude and country-and-month adjusted panel models.
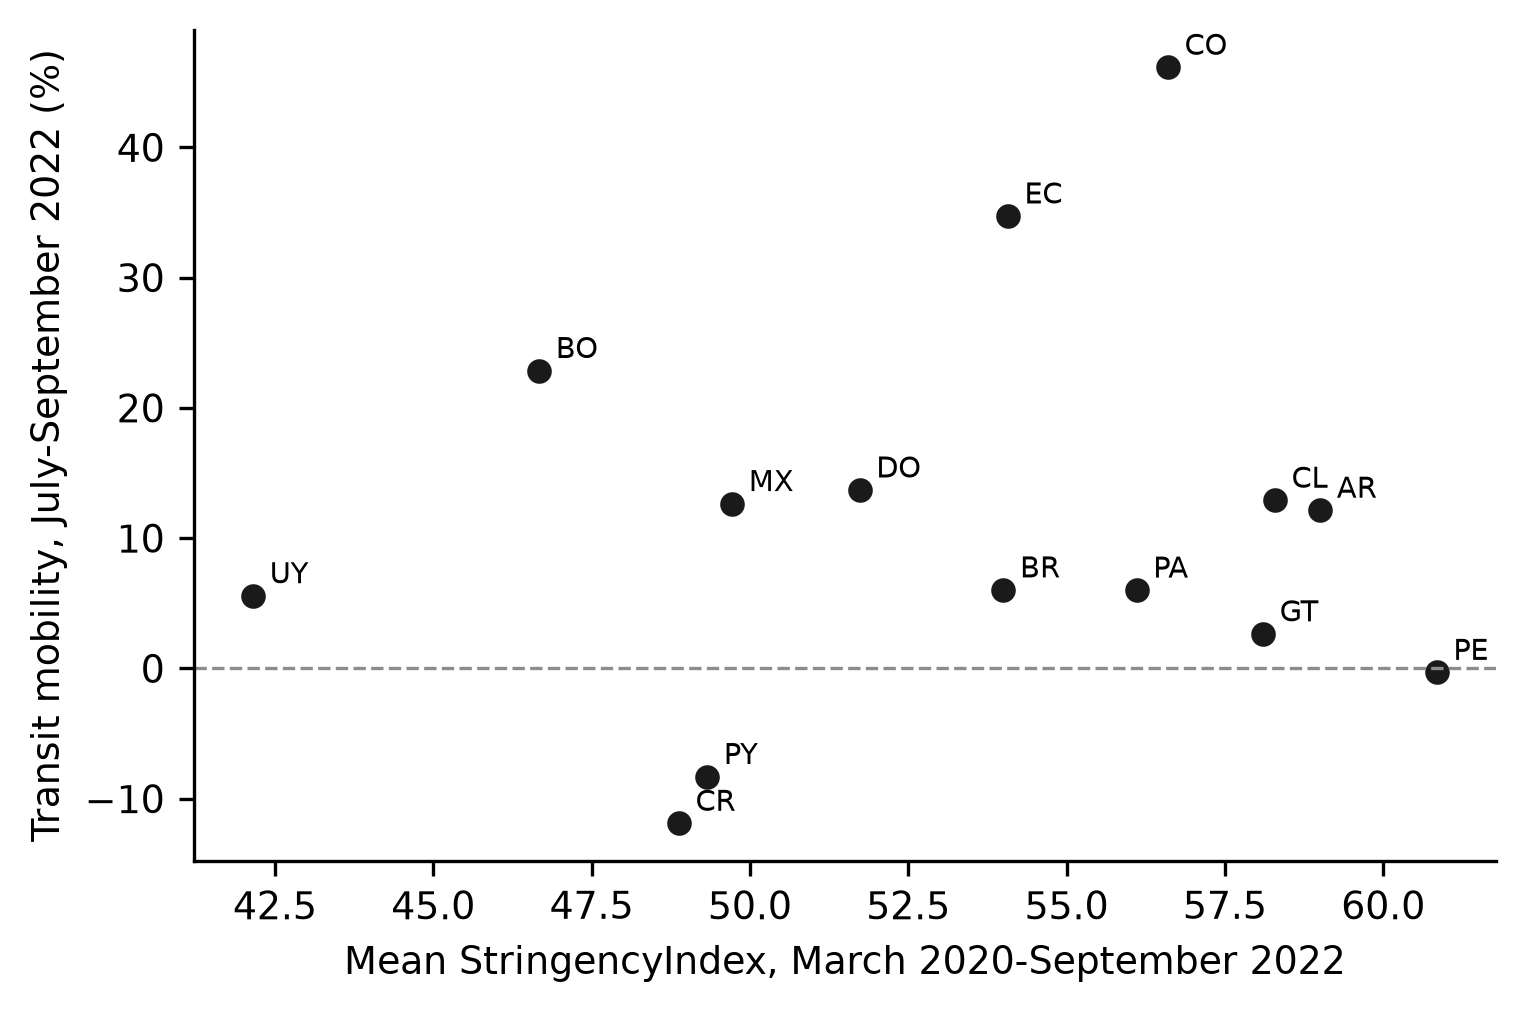
Figure 3. Third-quarter 2022 transit station mobility versus mean StringencyIndex by country.
Note: Each point is one country. The dashed line marks the pre-pandemic baseline.DISCUSSION
Main results
In this ecological panel of 14 Latin American countries and 924 cities, mobility to transit stations collapsed by roughly −70 percent below the pre-pandemic baseline in the first wave of 2020 and, on average, returned to or slightly above the baseline by the third quarter of 2022. The contemporaneous association between policy stringency and transit mobility was strong and negative in the crude and month-adjusted models, and it persisted, attenuated, once the common secular trend was removed. Across countries, the average strictness of government responses was not associated with the level of recovery reached by late 2022. Taken together, the two levels of analysis indicate that restrictions depressed transit mobility while they were in force but did not determine where mobility settled once they were removed.
Interpretation and comparison with other studies
The depth of the initial decline is consistent with earlier reports. Studies of traffic and public transport in eight large Latin American cities found reductions of a similar magnitude during the first months of the pandemic,(3) and mobile phone records documented large drops in population mobility across 314 Latin American cities.(4) The April 2020 trough also matches the timing of the most restrictive national measures in the region, when several governments suspended public transport or limited it to essential workers.(20,21) The recovery above the baseline by the third quarter of 2022 is more favorable than the incomplete recovery described in European cities, where rail and bus demand remained below pre-pandemic levels two years after the onset.(17,18,22) Part of this difference may reflect the short reference window used by Google, which compares late-pandemic mobility with January and February of 2020 rather than with an annual average, and part may reflect genuine ridership growth in Latin American systems that regained users faster than operators in high-income countries.(1,11) The contrast may also reflect the lower feasibility of remote work in much of the region and the scarcity of modal alternatives available to low-income workers, who returned to buses and metro lines sooner because they had few substitutes.(6,23) The city-level distribution was likewise uneven, with a substantial minority of municipalities still below the baseline by late 2022, concentrated among the systems that had declined most, a dispersion that mirrors the spatially uneven recovery documented elsewhere.(24,25) Recovery trajectories also differed by mode and by user group, with bus ridership recovering at different speeds across cities,(25,26) which cautions against treating a single mobility index as the whole story.
The negative association between stringency and contemporaneous transit mobility agrees with a large body of ecological work. Policy stringency has been repeatedly associated with reduced population movement, both globally(12,13) and in specific settings of the Global South,(15,27) and mode-specific analyses have shown that public transit is among the activities most sensitive to these restrictions.(2) The attenuation of the estimate after modeling the secular trend is expected. Part of the crude association reflects the shared pandemic trajectory in which restrictions were tightened while mobility fell and were relaxed while mobility recovered, so the trend-adjusted estimate isolates the component of the association that is specific to stringency rather than to the passage of time.(28) The plausibility of a direct effect rests on the composition of the index, which combines school and workplace closures, stay-at-home requirements and public transport closures, measures that restrict the legal ability to travel and signal risk to users.(12,14) The null cross-country correlation between average stringency and the recovery level suggests that the strictness of restrictions did not determine how far transit mobility had returned by late 2022. Recovery appeared instead to be shaped by the resumption of economic activity, by vaccination coverage and by the capacity of users to return to collective transport, factors that varied more within than between policy regimes and that rebounded once the acute restrictions were lifted.(19,23,29) The distinction between suppressing mobility and delaying recovery deserves emphasis. A policy that depresses transit use during a wave can be effective for infection control and yet leave no lasting trace on the level of transit use if demand returns once the measure is removed. The present results are compatible with that pattern: the within-period association was strong, whereas the between-country association with recovery was null. This does not imply that restrictions were without cost, because the revenue losses and service disruptions of the acute phase were real and may have damaged operators even when riders eventually returned.(16,27) This interpretation is consistent with evidence from Colombia and Santiago de Chile, where mobility and transport demand responded to local conditions beyond the stringency of national decrees,(6,30,31) and with findings from London that the decline and recovery of activity were spatially and socially uneven.(24) The heterogeneity across countries is as informative as the regional mean. Colombia and Ecuador ended the period more than twenty percentage points above the baseline, whereas Costa Rica and Paraguay remained below it, a spread that mirrors differences in the timing and intensity of epidemic waves, in vaccination and in the resumption of employment rather than differences in the average strictness of the response. In Bogotá, for example, the disruption of the bus rapid transit network was followed by a marked return of demand once economic activity resumed.(6,31) These local trajectories support the interpretation that transit recovery in the region was driven primarily by the resumption of the activities that generate trips, and only secondarily by the removal of restrictions.
The mechanisms that link stringency to transit mobility are several. Restrictions reduce mobility through legal prohibitions, through the suspension or reduction of service supply, and through the perception of risk that keeps potential riders at home even when travel is permitted.(12) The attenuation after the trend adjustment is consistent with a large component of the crude association operating through the shared timing of the pandemic rather than through any single policy instrument, and it is consistent with the observation that similar restrictions produced different mobility responses depending on the structure of the labor market and on the capacity of the state to enforce them.(16,21) In the United States, the decline in bus ridership was mediated in part by employment and by the shift to remote work,(32) a pattern consistent with the view that the return of trips, rather than the removal of restrictions, dominated the recovery. The regional mean ending above zero also reflects the short January-February 2020 reference window, which may understate a typical pre-pandemic level, a caveat already noted for indicators derived from these reports.(11) The experience of the pandemic also has implications for how transit systems should be monitored during shocks. The Google reports, discontinued in October 2022, provided a rare common yardstick for hundreds of cities, and their end left a gap that operator data alone do not fill.(11) This analysis shows that a discontinued but archived public series can still support retrospective evaluation, and that combining it with a policy index allows the response to restrictions to be separated from the recovery.
The main strengths of the study are its coverage, its reliance on public data and its prespecified sensitivity analysis. The sample spans 14 countries and 924 municipalities, which is broader than the single-city or single-country samples used in most recovery studies, and it links two independent, publicly archived sources rather than the records of a single operator. The three model specifications make explicit how much of the stringency association is attributable to the common course of the pandemic rather than to restrictions themselves, and the country-level correlation offers a direct test of the recovery question that the monthly panel cannot answer on its own. The use of the same indicator across all cities also avoids the comparability problems that arise when combining operator records with different definitions of ridership. The study thereby complements single-system analyses, which are more precise about local mechanisms but cannot characterize the regional pattern of recovery, and it provides a transparent, fully reproducible benchmark against which future post-pandemic monitoring efforts can then be compared.
Limitations
First, the study is ecological, and the exposure varies only at the national level, so the panel estimates describe country-level covariation and cannot be read as individual-level causal effects. Subnational policy data would be required to separate the effect of restrictions from other national conditions. Second, Google mobility is a proxy derived from a changing sample of users with location history enabled, and its coverage is thinner in lower-income municipalities, which may bias the city sample toward places with better digital penetration.(11) Validation against operator ridership records would strengthen the measurement of transit recovery.(32) Third, the cross-country correlation uses only 14 observations and has limited power to detect modest associations, so the null result should be interpreted as the absence of a large effect rather than as proof of no effect. Fourth, residual confounding by vaccination, economic activity, fare adjustments and mode substitution was not controlled, because consistent subnational measures of these variables were not available for the whole region.(33,34) Fifth, the eligibility filter required substantial longitudinal coverage and therefore excluded municipalities with sparse reporting, including the capitals of countries that report no municipality-level data at all. Sixth, the series end in October 2022, so the analysis cannot describe later phases of the recovery or the post-pandemic stabilization of demand.(7) Seventh, national stringency conceals subnational differences in policy, which were substantial in federal countries such as Brazil and Argentina, so the exposure may misclassify the restrictions actually experienced by specific cities; subnational policy coding would reduce this misclassification. Eighth, aggregating daily values into monthly means smooths within-month variation, so the estimates reflect the average association over each month and may understate the sharpness of the response in the days immediately after a policy change.
Generalization
These results generalize to Latin American cities with established transit systems and adequate Google mobility coverage, and they are most informative for the eight countries that report municipality-level data. The conclusions are therefore best read as a description of urban systems with formal collective transport, not of the entire region or of rural and informal mobility. The finding that average policy stringency did not predict the level of recovery reached by late 2022 cautions against interpreting short-term mobility suppression as long-term transit damage. Transport authorities should therefore monitor recovery with operational data after the acute phase of a shock, because aggregated mobility proxies and national policy indices do not by themselves reveal which cities and which user groups have returned to transit.(1,29) For operators and governments the implication is twofold. Financial support is most needed during the acute phase, when fare revenue collapses together with mobility, whereas the recovery phase calls for measures that bring riders back, such as service frequency, vehicle hygiene and fare integration, rather than for the lifting of restrictions alone.(7,34) The wide dispersion of recovery across cities also indicates that monitoring should be disaggregated to the municipality level, so that systems that lag behind can be identified and supported with specific measures. Future studies could extend this approach to other regions with archived mobility reports or combine it with operator records to validate the indicator at the city level.(32)
CONCLUSIONS
Mobility to transit stations in Latin American cities underwent a deep collapse during the first wave of 2020. Recovery by the third quarter of 2022 was heterogeneous, and on average cities had returned to or above their pre-pandemic baseline. Monthly policy stringency was strongly associated with lower contemporaneous transit mobility. The average strictness of government responses was not associated with the level of recovery reached by late 2022.
References
- 1 Wang J, Huang J, Yang H, Levinson D. Resilience and recovery of public transport use during COVID-19. npj Urban Sustain. 2022;2(1):18. doi: 10.1038/s42949-022-00061-1
- 2 Nikolaidou A, Kopsacheilis A, Georgiadis G, Noutsias T, Politis I, Fyrogenis I. Factors affecting public transport performance due to the COVID-19 outbreak: A worldwide analysis. Cities. 2023;134:104206. doi: 10.1016/j.cities.2023.104206
- 3 Andara R, Ortego-Osa J, Gómez-Caicedo MI, Ramírez-Pisco R, Navas-Gracia LM, Vásquez CL, et al. Behavior of Traffic Congestion and Public Transport in Eight Large Cities in Latin America during the COVID-19 Pandemic. Applied Sciences. 2021;11(10):4703. doi: 10.3390/app11104703
- 4 Kephart JL, Delclòs-Alió X, Rodríguez DA, Sarmiento OL, Barrientos-Gutiérrez T, Ramirez-Zea M, et al. The effect of population mobility on COVID-19 incidence in 314 Latin American cities: a longitudinal ecological study with mobile phone location data. The Lancet Digital Health. 2021;3(11):e716-e722. doi: 10.1016/s2589-7500(21)00174-6
- 5 Volke MI, Abarca-del-Rio R, Ulloa-Tesser C. Impact of mobility restrictions on NO2 concentrations in key Latin American cities during the first wave of the COVID-19 pandemic. Urban Climate. 2023;48:101412. doi: 10.1016/j.uclim.2023.101412
- 6 Oviedo D, Guzman LA, Arellana J, Sabogal-Cardona O, Moncada C, Scholl L. Cities Under Lockdown: Mobility and Access Inequalities Stemming from COVID-19 in Urban Colombia. In: Transport and Sustainability. Emerald Publishing Limited; 2022. p. 107-126. doi: 10.1108/s2044-994120220000017006
- 7 Vecchio G, Tiznado-Aitken I, Mora-Vega R. Pandemic-related streets transformations: Accelerating sustainable mobility transitions in Latin America. Case Studies on Transport Policy. 2021;9(4):1825-1835. doi: 10.1016/j.cstp.2021.10.002
- 8 Google LLC. COVID-19 Community Mobility Reports [Internet]. 2022. Available from: https://www.google.com/covid19/mobility/
- 9 Mahmud TS, Ng KTW, Ray S, Lyu L, An C. The use of Google community mobility reports to model residential waste generation behaviors during and after the COVID-19 lockdown. Sustainable Cities and Society. 2023;99:104926. doi: 10.1016/j.scs.2023.104926
- 10 Hale T, Angrist N, Goldszmidt R, Kira B, Petherick A, Phillips T, et al. A global panel database of pandemic policies (Oxford COVID-19 Government Response Tracker). Nat Hum Behav. 2021;5(4):529-538. doi: 10.1038/s41562-021-01079-8
- 11 Finazzi F. Replacing discontinued Big Tech mobility reports: a penetration-based analysis. Sci Rep. 2023;13(1):935. doi: 10.1038/s41598-023-28137-7
- 12 Heroy S, Loaiza I, Pentland A, O’Clery N. COVID-19 policy analysis: labour structure dictates lockdown mobility behaviour. J R Soc Interface. 2021;18(176):rsif.2020.1035. doi: 10.1098/rsif.2020.1035
- 13 Gong W, Ju G, Zhu M, Wang S, Guo W, Chen Y. Exploring the Longitudinal Relationship Between Lockdown Policy Stringency and Public Negative Emotions Among 120 Countries During the COVID-19 Pandemic: Mediating Role of Population Mobility. Front Psychiatry. 2022;13:753703. doi: 10.3389/fpsyt.2022.753703
- 14 Gani A. Using a consumer choice model to explain the effect of the newly developed oxford COVID-19 government stringency measure on hotel occupancy rates. Qual Quant. 2022;56(6):4313-4333. doi: 10.1007/s11135-022-01323-x
- 15 Jiang Y, Laranjo JR, Thomas M. COVID-19 lockdown policy and heterogeneous responses of urban mobility: Evidence from the Philippines. PLoS ONE. 2022;17(6):e0270555. doi: 10.1371/journal.pone.0270555
- 16 Khoirunurrofik K, Abdurrachman F, Putri LAM. Half-hearted policies on mobility restrictions during COVID-19 in Indonesia: A portrait of large informal economy country. Transportation Research Interdisciplinary Perspectives. 2022;13:100517. doi: 10.1016/j.trip.2021.100517
- 17 Manout O, Bouzouina L, Kourtit K, Nijkamp P. On the bumpy road to recovery: resilience of public transport ridership during COVID-19 in 15 European cities. Lett Spat Resour Sci. 2023;16(1):14. doi: 10.1007/s12076-023-00338-8
- 18 Sharma D, Zhong C, Wong H. Lockdown lifted: measuring spatial resilience from London’s public transport demand recovery. Geo-spatial Information Science. 2023;26(4):685-702. doi: 10.1080/10095020.2022.2156300
- 19 Long A, Carney F, Kandt J. Who is returning to public transport for non-work trips after COVID-19? Evidence from older citizens' smart cards in the UK's second largest city region. Journal of Transport Geography. 2023;107:103529. doi: 10.1016/j.jtrangeo.2023.103529
- 20 Cattani VB, Santos TAD, Ribeiro-Alves M, Castro-Alves J. Were public interventions relevant for containing the covid-19 pandemic in Brazil in 2020?. Rev saúde pública. 2023;57(1):77. doi: 10.11606/s1518-8787.2023057005030
- 21 Testa PF, Snyder R, Rios E, Moncada E, Giraudy A, Bennouna C. Who Stays at Home? The Politics of Social Distancing in Brazil, Mexico, and the United States during the COVID-19 Pandemic. Journal of Health Politics, Policy and Law. 2021;46(6):929-958. doi: 10.1215/03616878-9349100
- 22 Bonera M, Martinelli V. Covid-19 and Public Transport: two years later. Investigating the transport demand trend in the City of Brescia. Transportation Research Procedia. 2023;69:376-383. doi: 10.1016/j.trpro.2023.02.185
- 23 Soria J, Edward D, Stathopoulos A. Requiem for transit ridership? An examination of who abandoned, who will return, and who will ride more with mobility as a service. Transport Policy. 2023;134:139-154. doi: 10.1016/j.tranpol.2023.02.016
- 24 Trasberg T, Cheshire J. Spatial and social disparities in the decline of activities during the COVID-19 lockdown in Greater London. Urban Studies. 2023;60(8):1427-1447. doi: 10.1177/00420980211040409
- 25 Ammoury M, Salman B, Caicedo Bastidas CE, Kumar S. Impacts of COVID-19 on Bus Ridership and Recovery Trends in Syracuse, New York. J Transp Eng, Part A: Systems. 2023;149(2):05022009. doi: 10.1061/jtepbs.teeng-7498
- 26 Kroesen M, Le HTK, De Vos J, Ton D, de Bruyn M. Revealing latent trajectories of (intended) train travel during and after COVID-19. Transportation Research Part D: Transport and Environment. 2023;124:103952. doi: 10.1016/j.trd.2023.103952
- 27 Abulibdeh A, Mansour S. Assessment of the Effects of Human Mobility Restrictions on COVID-19 Prevalence in the Global South. The Professional Geographer. 2022;74(1):16-30. doi: 10.1080/00330124.2021.1970592
- 28 Reyna-Lara A, Soriano-Paños D, Arenas A, Gómez-Gardeñes J. The interconnection between independent reactive control policies drives the stringency of local containment. Chaos, Solitons & Fractals. 2022;158:112012. doi: 10.1016/j.chaos.2022.112012
- 29 Ciuffini F, Tengattini S, Bigazzi AY. Mitigating Increased Driving after the COVID-19 Pandemic: An Analysis on Mode Share, Travel Demand, and Public Transport Capacity. Transportation Research Record: Journal of the Transportation Research Board. 2023;2677(4):154-167. doi: 10.1177/03611981211037884
- 30 Bedoya-Maya F, Calatayud A, Giraldez F, Sánchez González S. Urban mobility patterns and the spatial distribution of infections in Santiago de Chile. Transportation Research Part A: Policy and Practice. 2022;163:43-54. doi: 10.1016/j.tra.2022.06.011
- 31 Garcia-Arteaga JD, Lotero L. A network-based analysis to assess COVID-19 disruptions in the Bogotá BRT system. Environment and Planning B: Urban Analytics and City Science. 2023;50(4):983-999. doi: 10.1177/23998083221150646
- 32 Ziedan A, Lima L, Brakewood C. A multiple mediation analysis to untangle the impacts of COVID-19 on nationwide bus ridership in the United States. Transportation Research Part A: Policy and Practice. 2023;173:103718. doi: 10.1016/j.tra.2023.103718
- 33 Pourmoradnasseri M, Loog KG, Khoshkhah K. COVID-19, From Lockdown to Recovery: Exploring the Dynamics of Bike-Sharing and Public Transport in Tartu, Estonia. Proceedings of the 1st ACM SIGSPATIAL International Workshop on Sustainable Mobility. 2023:5-8. doi: 10.1145/3615899.3627937
- 34 Peden M, Puvanachandra P, Keller ME, Rodrigues EM, Quistberg A, Jagnoor J. How the Covid-19 pandemic has drawn attention to the issue of active mobility and co-benefits in Latin American cities. Salud Publica Mex. 2022;64:S14-S21. doi: 10.21149/12786
Declarations
Funding
No financing
Conflict of interest
None
Authorship contributions
Drafting – original draft: Manuel Iván Tostado Ramírez, Lilian del Carmen López.
Writing–review and editing: Manuel Iván Tostado Ramírez, Lilian del Carmen López.