

Abstract
Introduction: Electric bicycles are promoted to reduce car use and transport emissions, but their climate benefit depends on the travel modes they replace. Methods: We conducted a systematic review following PRISMA 2020. Results: From 269 records, 15 studies were included, of which 2 were randomized controlled trials. The car was the mode most frequently reported as replaced, in 14 of 15 studies, followed by the conventional bicycle, public transport and walking. The magnitude varied widely: an incentive program in the Netherlands shifted the e-bike commute share from 0% to 68%, half of those trips replacing the car; a Swedish randomized trial cut car mileage by 37%; a workplace lending program reduced single-occupancy vehicle commuting by 55 percentage points. Two studies found that e-bikes displaced walking, conventional cycling and public transport rather than cars, and e-bike sharing reduced carbon emissions by 108 to 120 g per kilometer. Conclusions: E-bikes replace car trips mainly when programs and contexts target car commuters, but substitution of active and public modes is common and conditions the emission benefit.
Keywords
electric bicycle, e-bike, mode substitution, mode choice, travel behavior, car use
INTRODUCTION
Electrically assisted bicycles, or e-bikes, have expanded rapidly across high-income and middle-income settings over the past decade, and their uptake is framed as a lever against car dependence and the greenhouse gas emissions of passenger transport.(1) The transport sector is a leading source of energy-related emissions, and short car trips, many of them under 10 km, concentrate a large share of that burden in urban areas.(2) E-bikes extend the speed and range of conventional cycling with modest additional energy demand, which positions them as a candidate substitute for trips that car users would otherwise make by motor vehicle.(3) In several European markets the e-bike has moved from niche to mainstream: in the Netherlands it reached 40% of new bicycle sales in 2018, and in Switzerland e-bikes accounted for 45% of adult bicycle sales in 2022.(4,5) The mode also dominates two-wheeled mobility in China, where it emerged as an affordable substitute for the conventional bicycle and the bus during a period of rapid motorization.(6) Policy instruments such as purchase subsidies, free trial periods and workplace lending programs have been deployed on the premise that the e-bike attracts car commuters rather than existing cyclists.(7) Beyond emissions, the e-bike carries a health rationale: it lowers the effort threshold of cycling and lets people with lower fitness, older adults and parents of young children stay active where a conventional bicycle is impractical.(8) The two rationales converge only when the e-bike displaces a motorized trip, and they diverge when it displaces a walk, a conventional bicycle or a bus journey. The policy stakes of the question are high: if e-bikes replace bicycles and bus trips, subsidies buy little emission reduction, whereas if they replace car trips, the mode becomes one of the cheapest available forms of transport decarbonization.(9) Cycling uptake has documented co-benefits for all-cause mortality and cardiovascular risk, and the e-bike extends those co-benefits to people who would not ride a conventional bicycle, provided the displaced mode is motorized.(8,10)
The pattern expected in this literature is uneven rather than uniform. Where e-bikes are adopted by car users, the substitution can cut car kilometers and emissions; where they are adopted by people who would otherwise walk, use public transport or ride a conventional bicycle, the climate and public health gains shrink or disappear.(11) Early evidence pointed in both directions. Surveys of early adopters in North America and northern Europe reported that car trips were the main trips replaced, while panel studies in the Netherlands suggested that the e-bike displaced the conventional bicycle first.(12) A meta-analysis of 38 observations from 24 studies placed the median substitution at 33% for public transit, 27% for the conventional bicycle, 24% for the automobile and 10% for walking, with wide interquartile ranges, a result that already hinted at the fragility of the car-replacement assumption.(3) The most recent focused synthesis of substitution, however, predates the randomized trials and the rebate and lending programs published between 2021 and 2023, and it pooled stated and revealed substitution across heterogeneous designs. Narrative and scoping reviews since then have reported that car use declines after e-bike uptake, but they have not quantified how much of that decline comes from car replacement as opposed to replacement of active modes.(2,9,13) The direction of substitution therefore determines whether the e-bike is an environmental and health asset or a neutral reallocation of existing active travel.(3)
This review aimed to quantify which travel modes e-bike trips replace and what that substitution implies for car use and emissions. The population comprised adults who adopted or used e-bikes, the exposure was e-bike adoption or use, and the outcome was the reported travel mode replaced by e-bike trips, together with the resulting change in car kilometers, car trips or emissions. We deliberately included randomized trials, longitudinal panels, quasi-experimental programs, cross-sectional surveys, trip-data studies, qualitative studies and simulation models to characterize both the magnitude and the direction of substitution reported between 2013 and 2023, and we compared the findings against earlier syntheses and against studies published outside that window. The specific objectives were to describe the travel modes replaced, to estimate the magnitude of substitution away from the car, to identify the reported implications for emissions and physical activity, and to characterize how substitution varies by user profile, trip purpose and context.
METHODS
The review followed the Preferred Reporting Items for Systematic Reviews and Meta-Analyses 2020 statement.(14)
Studies were eligible when they were primary empirical or modeling studies that reported, for adult e-bike users or adopters, which travel mode e-bike trips replaced or how e-bike use changed the use of another mode. The population was adults using personal e-bikes, speed pedelecs or shared e-bikes; the exposure was e-bike adoption, ownership or use; and the outcome was the substituted mode, expressed as a share of shifted trips, a change in mode use, a change in car kilometers or trips, or an emission estimate derived from substitution. The comparison was the participant's travel before e-bike adoption or the counterfactual mode that the e-bike trip would otherwise have used. We accepted quantitative estimates, stated substitution and qualitative accounts of replaced modes. The window was 2013 to 2023 in line with the target journal volume, and the language was restricted to English. We excluded reviews, editorials, engineering studies, route choice, safety and charging studies, and studies of conventional bicycle sharing, e-scooters or freight bicycles. Reports not retrieved because no legitimate open-access full text was available were recorded as not retrieved rather than excluded.
Scopus was searched first, followed by OpenAlex, Crossref and Semantic Scholar. The first query combined terms for the vehicle with terms for substitution, for example TITLE-ABS-KEY("e-bike" OR "electric bicycle" OR "electrically assisted bicycle" OR "pedelec") AND TITLE-ABS-KEY("mode substitution" OR "modal shift" OR "mode shift" OR "mode choice" OR "mode change" OR "car replacement" OR "car use" OR "travel behaviour" OR "travel behavior"), restricted to PUBYEAR > 2012 AND PUBYEAR < 2024. A second query added replacement terms such as "replaced", "replaces", "substituted" and "car trips", and a third focused on "mode shift" and "modal shift". A fourth query captured adoption and determinants, a fifth captured emissions terms, and a sixth captured physical activity and health terms for the supporting literature. The adoption query paired the vehicle terms with "adoption", "determinants", "barriers" and "motivations"; the emissions query paired them with "emissions", "greenhouse gas" and "carbon"; and the health query paired them with "physical activity", "active travel" and "health". The queries returned 269 records before deduplication: 149 from Scopus, 60 from OpenAlex, 30 from Crossref and 30 from Semantic Scholar. Search strings were recorded literally in the search log, and the strategy is reported following PRISMA-S.(15)
Records were deduplicated by DOI and title. The screen excluded records whose population, exposure or outcome fell outside the scope, and records without an abstract advanced to full-text review when the title was informative. Uncertain records advanced to full-text screening rather than being excluded for lack of information. Full text was obtained only from legitimate open-access locations identified through OpenAlex and Unpaywall, never by circumventing a paywall. At full-text stage, exclusions were coded by reason: population, exposure, outcome, design, language, duplicate report, or year outside the window.
One reviewer extracted, for each included study, the country, design, sample size, exposure, outcome and the main mode-substitution estimate with its magnitude, together with the location of the datum in the source. The extraction form captured country, design, sample size, exposure, outcome, the substituted mode, the substitution estimate with its units, and the location of the datum in the source. The extraction fields were recorded in a structured file and checked against the source text before synthesis. Where the open-access record exposed only the published abstract, the abstract was treated as the source and this was noted in the extraction.
Risk of bias was assessed with a domain-based instrument adapted to this literature: selection, confounding, measurement of the substituted mode, attrition and selective reporting, each rated as low, moderate, serious or unclear, with an overall judgment derived from the highest-risk domain. Selection concerned how participants entered the study, confounding concerned whether a change in e-bike use could be attributed to the e-bike rather than to concurrent changes, measurement concerned the accuracy of the self-reported or GPS-derived substituted mode, attrition concerned loss to follow-up, and reporting concerned selective presentation. Randomized trials were additionally read against the RoB 2 structure, and qualitative studies were assessed on the clarity of sampling and analysis rather than on confounding. Ratings were never assigned as low in the absence of supporting information, and a single reviewer performed the assessment, which is a limitation.
RESULTS
The search identified 269 records across Scopus, OpenAlex, Crossref and Semantic Scholar, and 79 duplicates were removed, leaving 190 records for screening. Of those, 152 were excluded on title and abstract, and 38 reports were sought for retrieval. Twenty reports were not retrieved because no legitimate open-access full text was available, 18 reports were assessed for eligibility, and 3 were excluded at that stage because the outcome was a stated preference or a potential estimate rather than an observed substitution. In total, 15 studies were included (Figure 1).
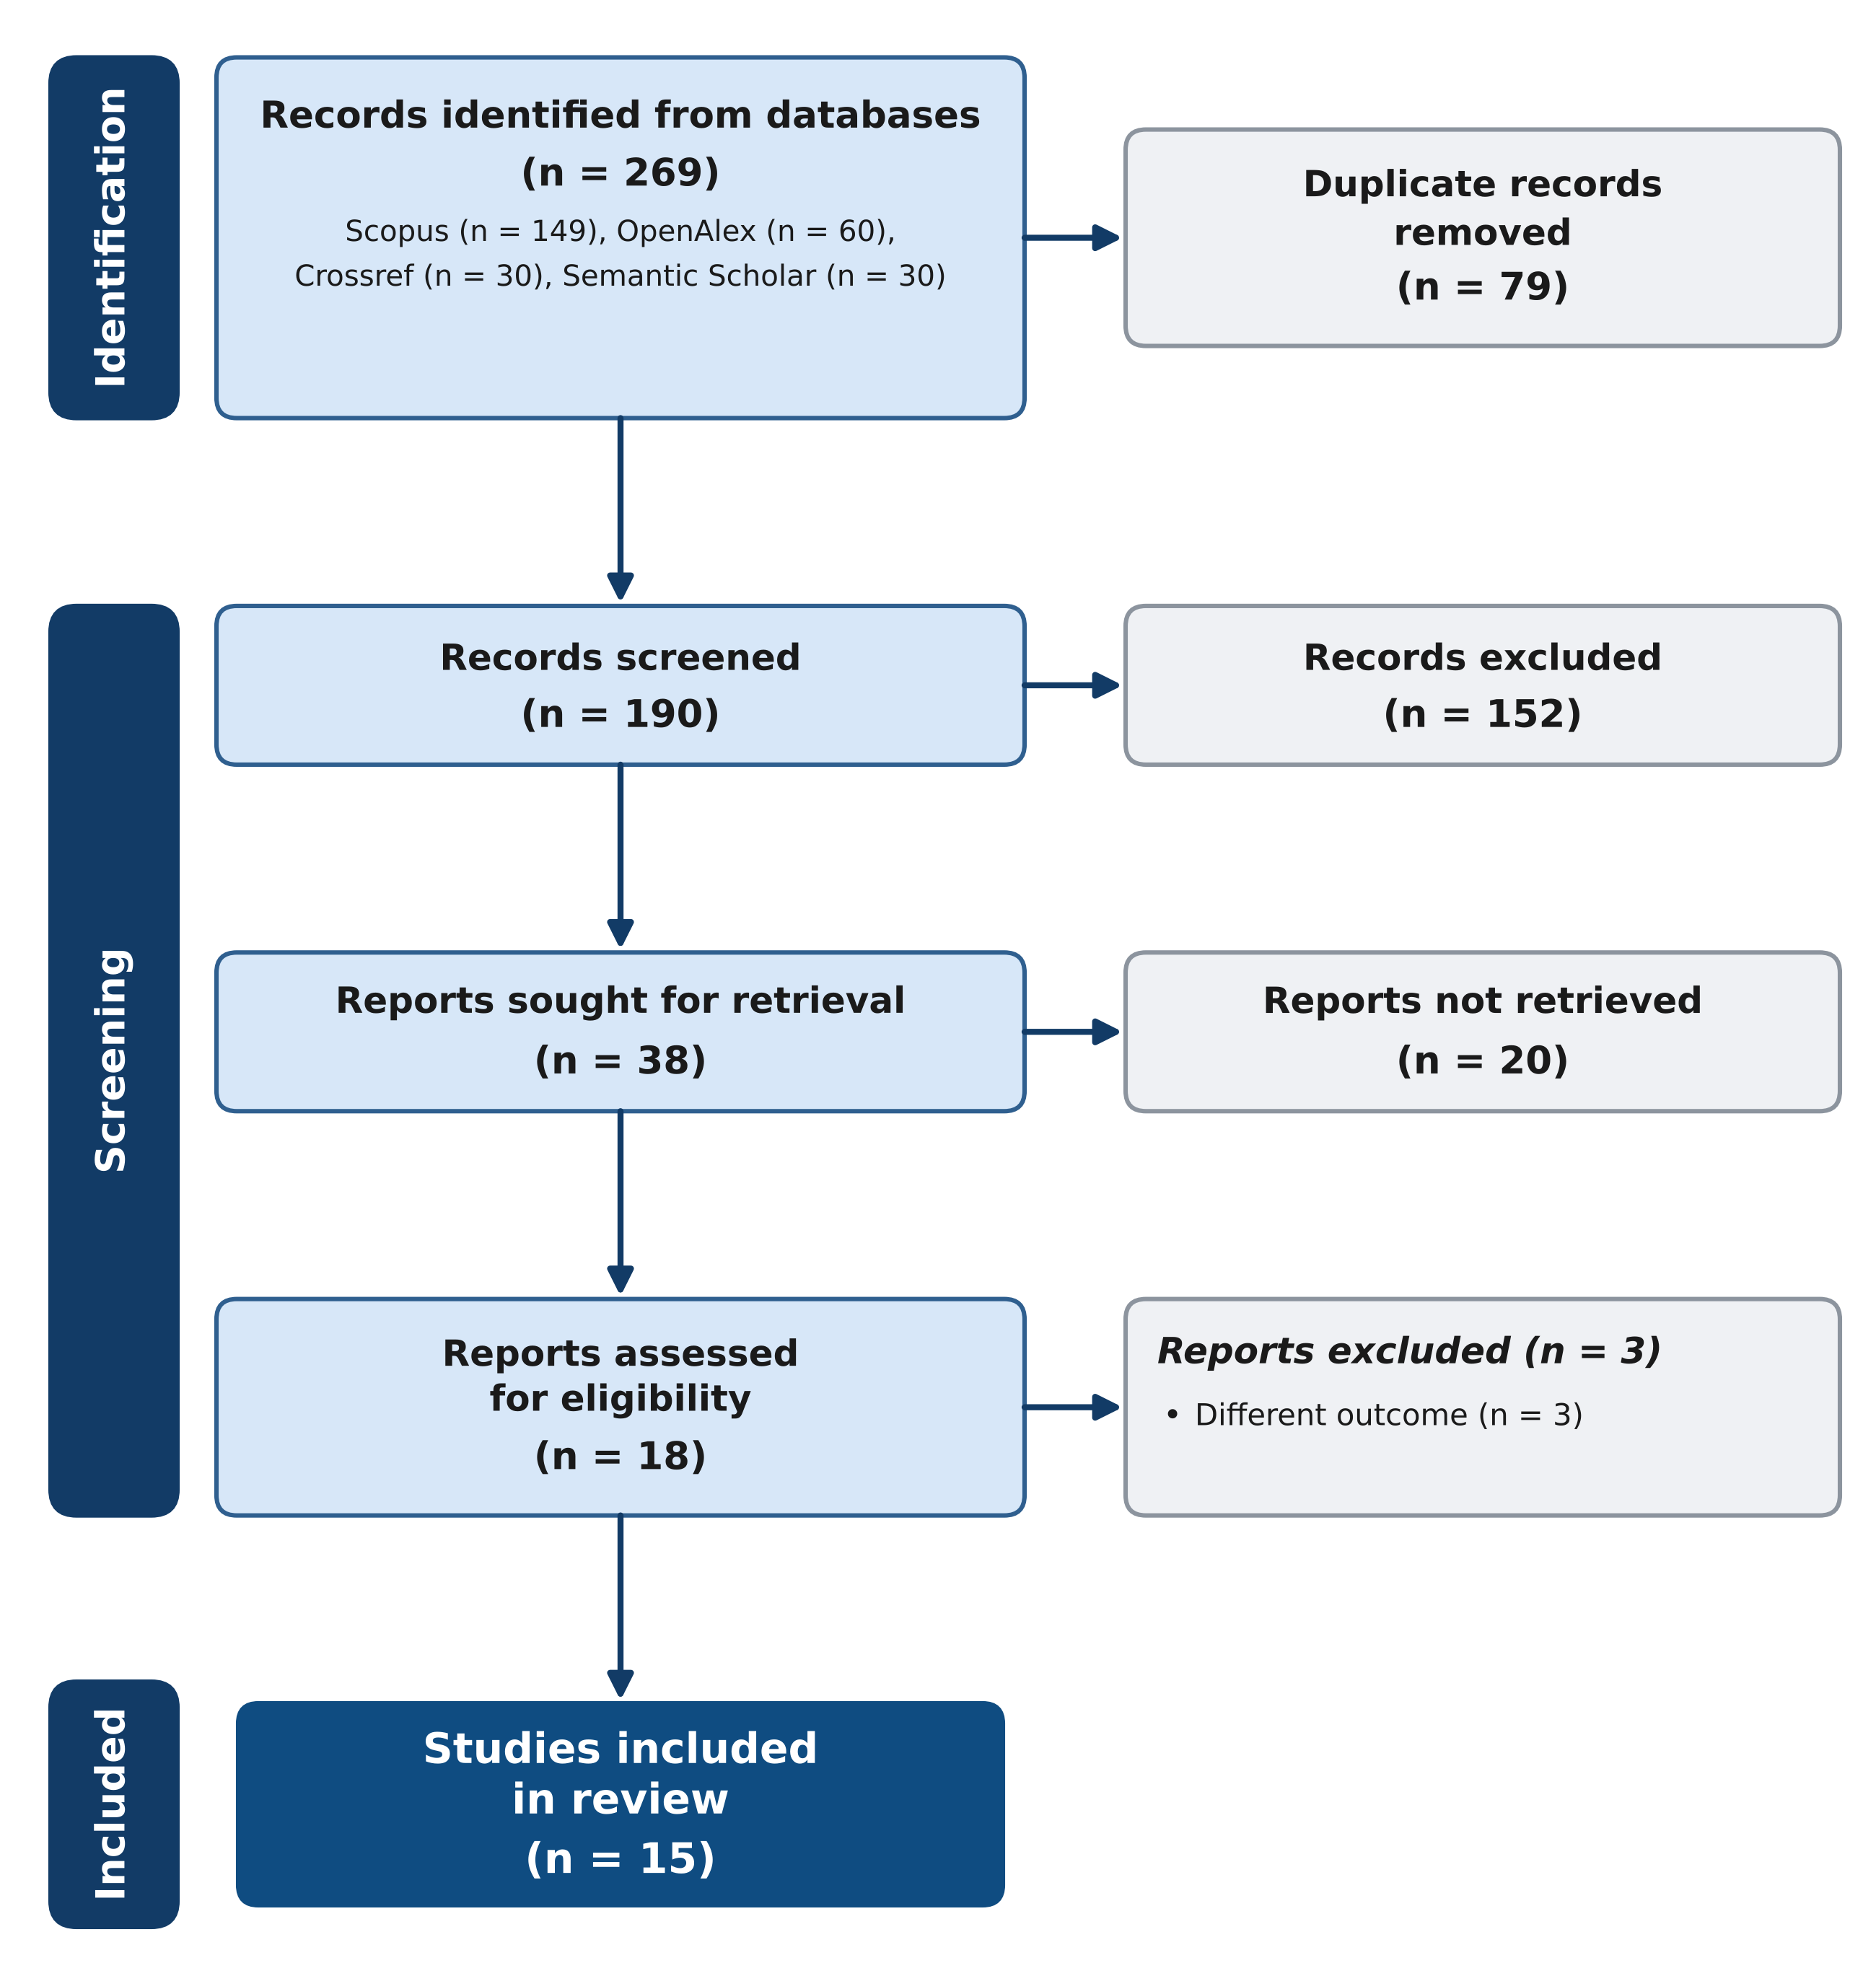
Figure 1. PRISMA 2020 flow of study selection.
The distribution of included studies clustered in Western Europe, where 12 of the 15 studies were conducted, while 2 were set in China and 1 in the United States (Figure 2). The European studies concentrated in the Netherlands, Switzerland and Sweden, countries with established cycling policy and e-bike subsidy or trial programs, whereas the Chinese studies addressed the largest e-bike market and the American study evaluated a workplace lending program. The concentration in Europe reflects both the geography of the underlying literature and the availability of open-access reports from European trials and surveys, and it means that the synthesis speaks most directly to cycling-oriented, high-income settings.
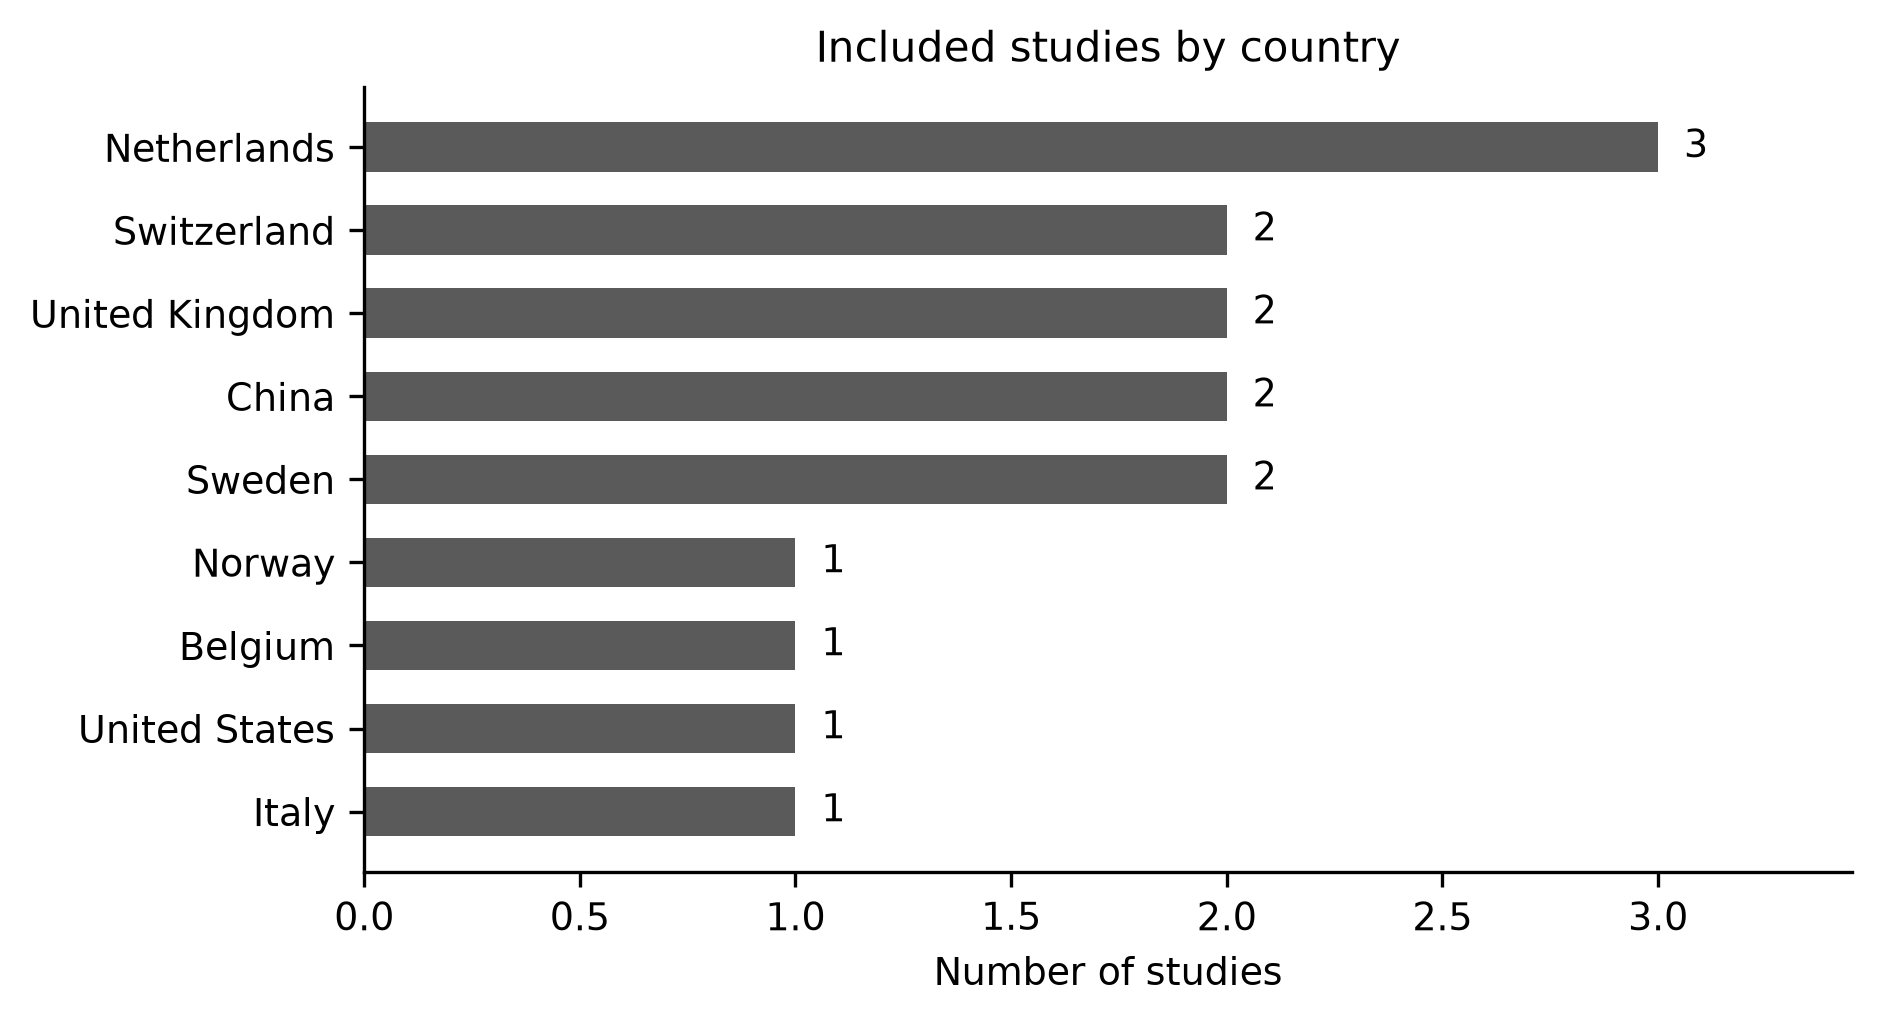
Figure 2. Included studies by country.
The car was the mode reported as replaced in 14 of the 15 included studies, ahead of the conventional bicycle in 3 studies, public transport in 3 studies and walking in 2 studies (Figure 3). A motorized two-wheeler was named in 1 study. This pattern is partly an artifact of the review question, which selected studies that measured car substitution, but it also reflects the stated purpose of many e-bike programs, which recruit car commuters, and the finding should be read together with the magnitude estimates below rather than as a population share.
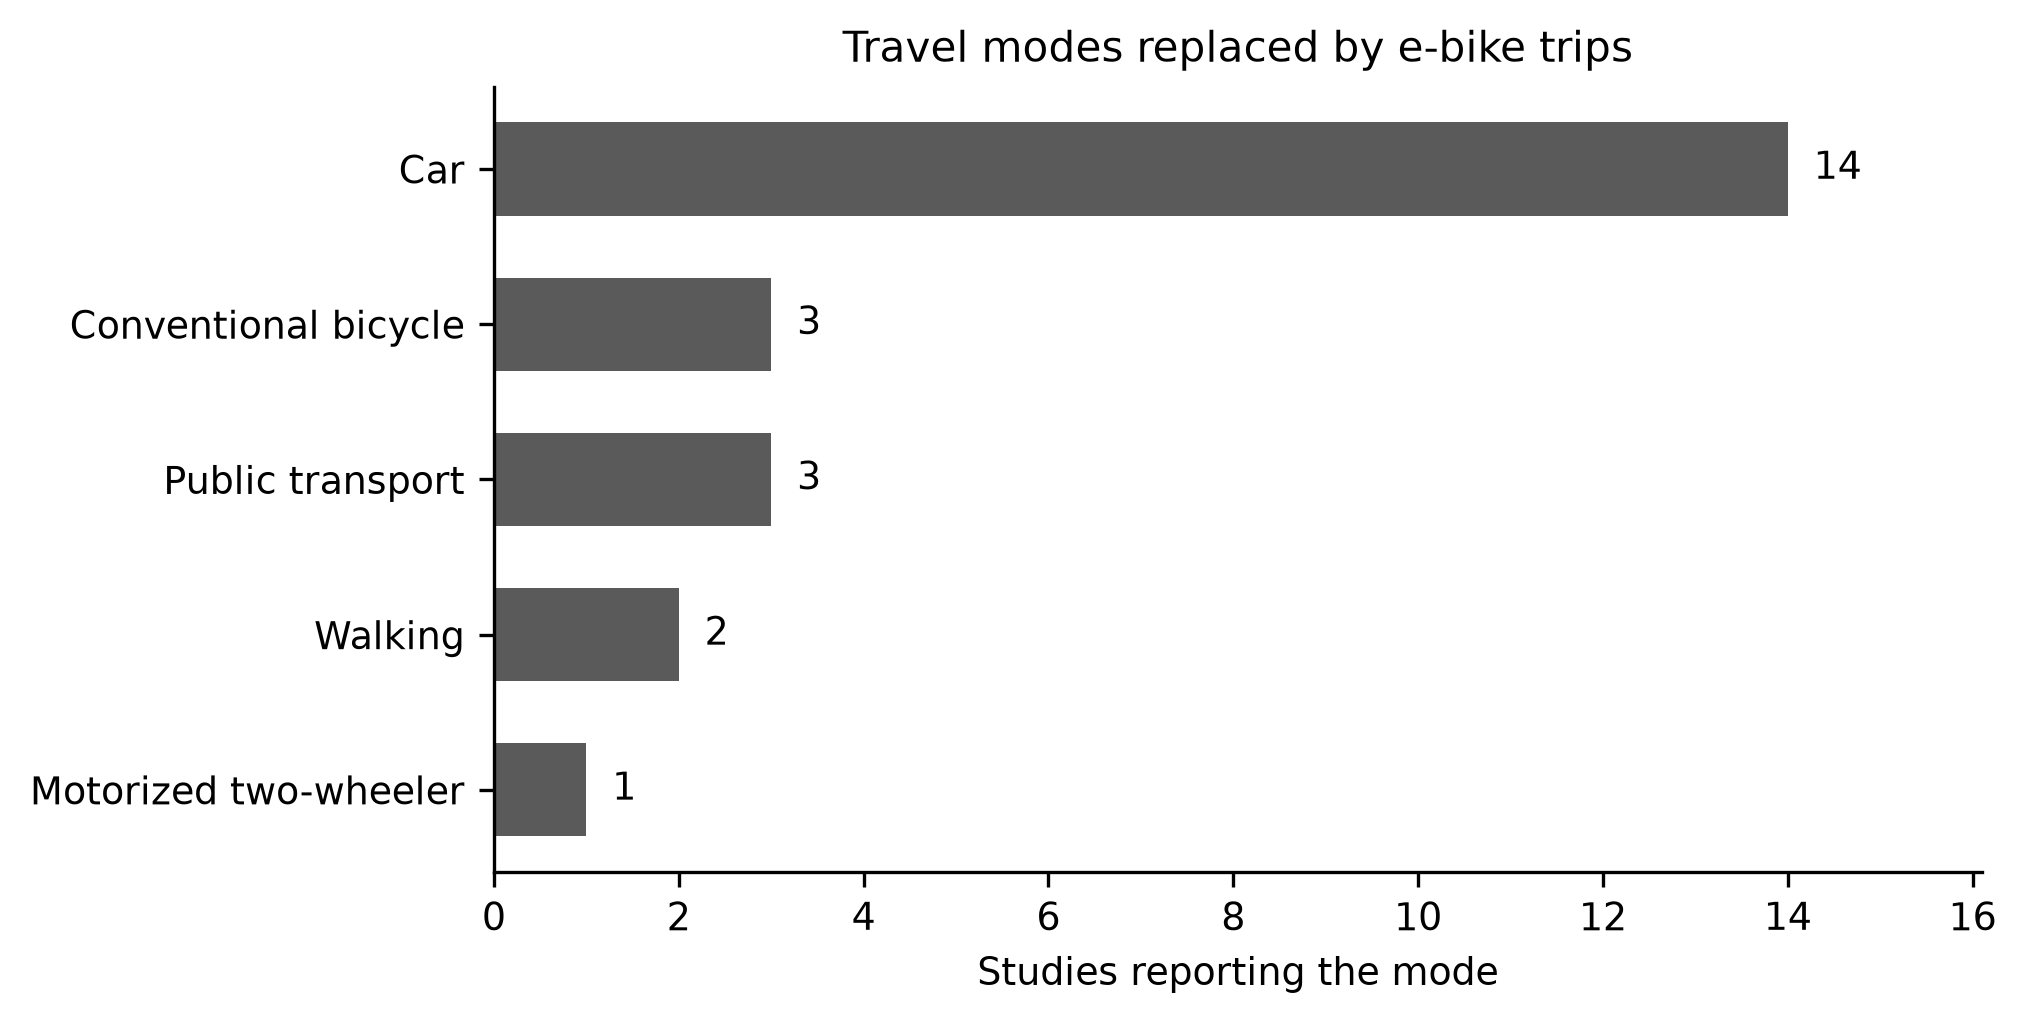
Figure 3. Travel modes reported as replaced by e-bike trips.
The designs spread across the evidence hierarchy, with 2 randomized controlled trials, 4 longitudinal or quasi-experimental studies, 3 cross-sectional surveys, 2 trip-data studies, 3 qualitative or mixed-methods studies and 1 spatial microsimulation (Figure 4). The two randomized trials both recruited frequent car users or car-owning parents, which aligns the strongest designs with the car-substitution question rather than with the broader population of e-bike adopters. The longitudinal and quasi-experimental programs likewise enrolled commuters who opted into an e-bike incentive or loan, so the designs that can measure change are also the designs most likely to start from car use. The included studies spanned 2016 to 2023, with a concentration in the most recent years of the window, when the rebate, lending and sharing programs were evaluated.
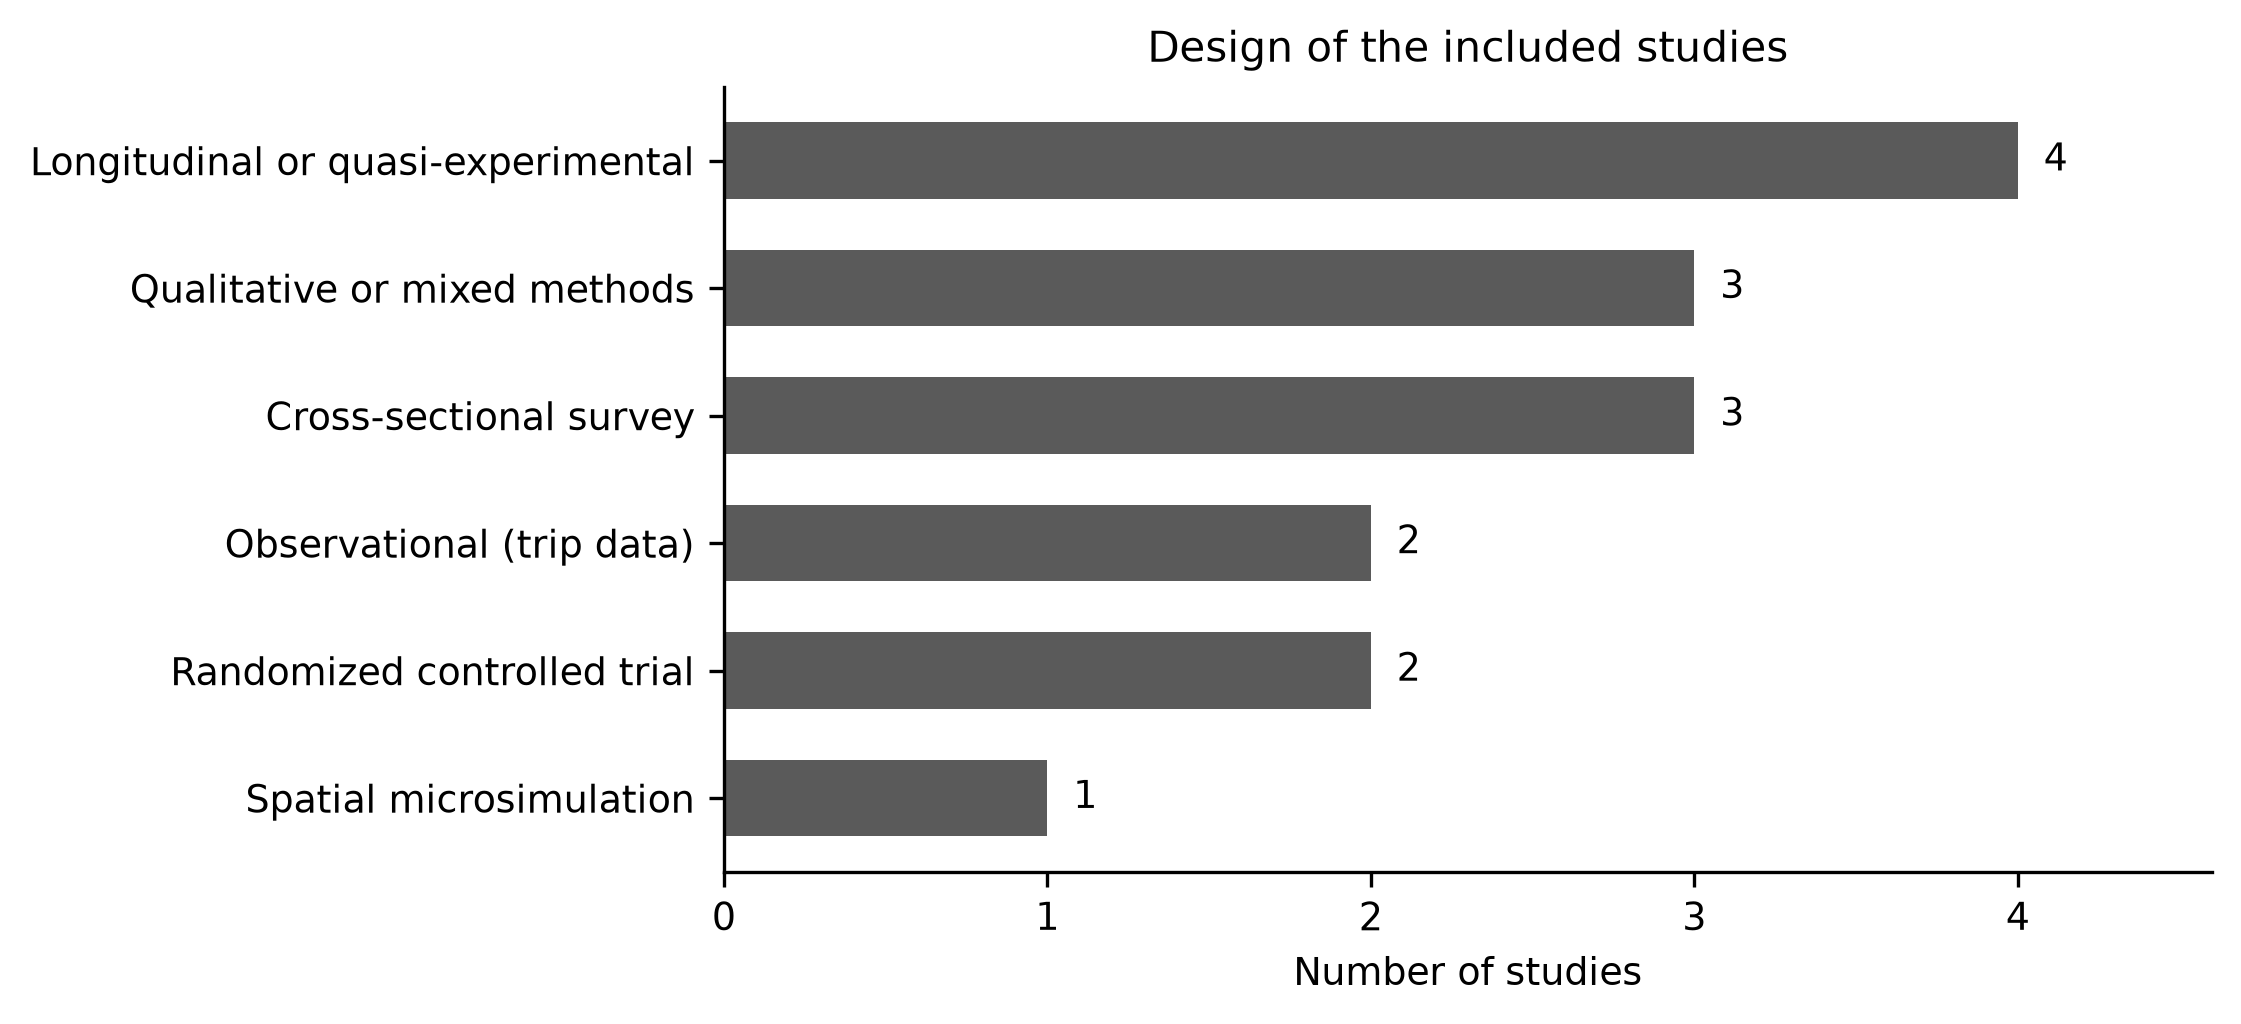
Figure 4. Design of the included studies.
The measurement of substitution also differed across designs. The two randomized trials used GPS or trip diaries to observe mode use directly, the panel study modeled trip rates from a national travel diary, the trip-data studies inferred substitution from trajectory and booking records, and the surveys and qualitative studies relied on participants' recall of the mode they would have used.(4,16,17) The samples ranged from small convenience groups to national coverage: the smallest studies, the 24 GPS-tracked commuters and the 36 parents, permitted detailed observation of individual behavior but limited statistical power, while the largest, the 12,215-person panel and the 2,712-employee program, described population or workplace effects with coarser exposure measures.(4,18-20) The trip-data studies covered city-wide fleets of shared e-bikes without individual survey responses, and the microsimulation covered the adult population of England through synthetic data.(17,21) The characteristics of the included studies are summarized in the matrix below (Table 1). Sample sizes ranged from 24 GPS-tracked commuters to a national panel of 12,215 people, and the estimates of car substitution were expressed in several metrics, from changes in car kilometers to shares of shifted trips, which prevented pooling.
Study | Country | Design | Sample | Main mode-substitution finding |
|---|---|---|---|---|
Söderberg et al., 2021 | Sweden | RCT with GPS | 98 frequent drivers | Cycling +6.5 km/day; car mileage -37% |
Bjørnarå et al., 2019 | Norway | RCT | 36 parents | Cycling up; car driving -0.2 to -1.7 days/week |
de Haas et al., 2022 | Netherlands | Longitudinal panel | 12,215 people | E-bike substitutes conventional bicycle; car only for commuting |
de Kruijf et al., 2018 | Netherlands | Longitudinal incentive | Commuter program | E-bike commute share 0% to 68%; half of trips replaced car |
Fitch et al., 2022 | United States | Quasi-experimental | 2,712 employees | Bike commuting +35 percentage points; SOV -55 percentage points |
Moser et al., 2018 | Switzerland | Longitudinal trial | Car owners | Car-use habit weakened after one year |
Di Gangi et al., 2022 | Italy | Observational pilot | 9 months of trip data | 6.9 km/day; CO2 -245 kg/person/year |
Li et al., 2023 | China | Observational trip data | Shared e-bike trajectories | Carbon -108 to -120 g/km |
Ravalet et al., 2023 | Switzerland | Cross-sectional survey | E-bike owners | 59.1% of speed-pedelec owners reduced car use |
Winslott Hiselius & Svensson, 2017 | Sweden | Cross-sectional survey | E-bike users | CO2 gains from modal change, larger in rural areas |
Lin et al., 2017 | China | Cross-sectional survey | >1,000 respondents | E-bikes displace walking, cycling and bus, not cars |
Van den Steen et al., 2019 | Belgium | Qualitative focus groups | 100 participants | Speed pedelec replaced the commuting vehicle |
Jones et al., 2016 | Netherlands, UK | Qualitative interviews | E-bike owners | E-bike bought to replace motorized trips |
Plazier et al., 2017 | Netherlands | Mixed methods | 24 commuters | E-bike alternated with car for work trips |
Philips et al., 2022 | England | Spatial microsimulation | National population | Capability to cut car CO2 by 24.4 MtCO2/year |
Note: SOV = single-occupancy vehicle; CO2 = carbon dioxide; RCT = randomized controlled trial.
The magnitude of car substitution spanned a wide range, and the strongest designs reported the largest effects. In the Swedish randomized trial, 98 frequent drivers were randomized and their trips were recorded with GPS, and the treatment group increased cycling by 1 trip and 6.5 km per person per day, a 25% increase, with the entire gain coming at the expense of car use, which fell by 1 trip and 14 km per person per day, a 37% reduction in car mileage.(16) A smaller Norwegian randomized trial among parents randomized 36 participants to an intervention that provided access to an e-bike, a longtail cargo bike or a traditional bike, and it found that cycling increased while the frequency of car driving fell by 0.2 to 1.7 days per week.(19) In the Dutch incentive program, the share of commute trips made by e-bike climbed from 0% to 68% within a month and reached 73% after half a year, and half of those e-bike trips replaced the car while the other half replaced the conventional bicycle.(22) The Google workplace lending program produced a comparable direction at larger scale: bike commuting rose by more than 35 percentage points during the program, single-occupancy vehicle commuting dropped by 55 percentage points, and the program was estimated to have removed nearly 400,000 single-occupancy vehicle commute miles.(20) The estimates ranged from no substantial car replacement in the Nanjing survey to a 55 percentage point reduction in single-occupancy vehicle commuting in the workplace program, and the units of measurement differed across studies, from kilometers per day to shares of shifted trips.(20,23)
Two studies qualified that headline and identified a different substitution pattern. In the Netherlands Mobility Panel, a random-intercept cross-lagged model over five waves found that, across all trip purposes, e-bike trips only substituted conventional bicycle trips, and the car was substituted only for commuting trips.(4) The same study separated commuting and leisure trips and showed that the car substitution observed for commuting disappeared in leisure and shopping trips, where the e-bike displaced the conventional bicycle alone.(4) In Nanjing, a survey of more than 1,000 respondents concluded that e-bikes were not replacing cars on a substantial scale and instead displaced walking, traditional bicycling and bus use.(23) Speed pedelecs behaved differently from regular pedelecs: in Lausanne, 59.1% of speed-pedelec owners reduced their car use against 50% of pedelec owners, and up to 20% reported giving up car ownership or plans to buy one, while more pedelec owners gave up a conventional bicycle.(5)
The substitution varied with user profile and vehicle type. Speed-pedelec owners reduced motorized two-wheeler use more than pedelec owners, at 30.9% against 22%, and reduced public transport less, at 54.8% against 62.3%.(5) Parents in the Norwegian trial increased cycling to the workplace but not to the kindergarten or grocery store, which suggests the e-bike replaced commuting car trips more readily than household errands.(19) The Swiss trial among car owners found that the habitual association with car use had weakened one year after a two-week e-bike trial, and this weakening held for participants who bought an e-bike and for those who did not.(24) The qualitative accounts described substitution as partial rather than total: speed-pedelec users in Flanders replaced their commuting vehicle during a three-week trial and framed the speed pedelec as a credible substitute for the car,(25) while GPS-tracked commuters in the Netherlands alternated between the e-bike and the car, using the e-bike mainly for single-destination work journeys.(18) E-bike owners in the Netherlands and the United Kingdom reported buying the e-bike to replace motorized trips, with health and mobility rather than emissions as the stated motive.(26)
Trip purpose moderated the substitution. Commuting produced the clearest car substitution: the Dutch incentive program and the workplace lending program both measured the shift in commute trips, and the panel study found car substitution only for commuting.(4,20,22) Leisure and shopping trips, by contrast, replaced the conventional bicycle in the same panel, and the GPS-tracked commuters used the e-bike for single-destination work journeys while continuing to drive for chained errands.(4,18) The Swedish and Swiss trials also framed the e-bike as a commuting vehicle, which reinforces that the car-substitution evidence is concentrated in the journey to work.(16,24) The Italian pilot, although it did not isolate the counterfactual mode, framed its commuting program as a shift from the car, which aligns with the commuting pattern.(27)
The studies that measured physical activity or active-mode displacement pointed to a mixed account. The Dutch incentive program found that half of the e-bike trips replaced conventional cycling, with fewer health benefits than the half that replaced the car, and the panel study found the conventional bicycle displaced across most trip purposes.(4,22) The Chinese survey reported displacement of walking and conventional cycling, and the Swiss speed-pedelec owners reduced public transport less than pedelec owners while some increased conventional bicycle use.(5,23) The Norwegian trial likewise reported an increase in cycling frequency but did not separate the substituted mode for each trip.(19)
The geographic split in the direction of substitution was consistent across study types. The two Chinese studies, one based on shared e-bike trajectories and one on a household survey, both concluded that the e-bike displaced non-motorized and public modes rather than the car, whereas the European surveys, trials and programs recorded car reduction as the dominant effect.(5,17,22,23) The single North American program matched the European pattern, with a 55 percentage point reduction in single-occupancy vehicle commuting.(20)
The emission implications followed the direction of substitution. Shared e-bikes in Chengdu and Kunming reduced carbon emissions by 108 to 120 g per kilometer on average, with stronger reductions in less developed non-central areas, where the trips replaced were motorized rather than walked or cycled.(17) The English microsimulation placed an upper limit of 24.4 million tonnes of CO2 per year on the capability to replace car travel with e-bikes, with per-person capability above 750 kg of CO2 per year in rural areas and more modest values in conurbations.(21) The Messina commuting pilot measured an average working-day distance of 6.9 km, an 81% usage rate and about 245 kg of CO2 avoided per person per year, and about 15% of participants adopted the e-bike as their primary mode.(27) In Sweden, the modal change attributed to e-bike use produced CO2 gains that were larger in rural than in urban environments.(28)
Risk of bias was moderate overall (Table 2). The two randomized trials had low risk from confounding but were small and relied partly on self-reported car use, and the Norwegian trial lost precision from its 36-participant sample. Longitudinal and quasi-experimental programs were exposed to self-selection, because participants enrolled to replace car commuting, and cross-sectional surveys carried serious risk from recall and the absence of a counterfactual. No study was rated low across all domains, and several ratings were unclear where attrition was not reported.
Study | Selection | Confounding | Measurement | Attrition | Reporting | Overall |
|---|---|---|---|---|---|---|
Söderberg et al., 2021 | L | L | M | M | L | M |
Bjørnarå et al., 2019 | L | L | M | M | L | M |
de Haas et al., 2022 | L | L | M | M | L | L |
de Kruijf et al., 2018 | S | S | M | M | L | S |
Fitch et al., 2022 | S | S | M | S | L | S |
Moser et al., 2018 | S | S | M | U | L | S |
Di Gangi et al., 2022 | M | S | M | NA | L | M |
Li et al., 2023 | L | M | M | NA | L | M |
Ravalet et al., 2023 | M | S | S | U | L | S |
Winslott Hiselius & Svensson, 2017 | M | S | S | U | L | S |
Lin et al., 2017 | M | S | S | U | L | S |
Van den Steen et al., 2019 | M | NA | NA | NA | L | M |
Jones et al., 2016 | M | NA | NA | NA | L | M |
Plazier et al., 2017 | M | NA | NA | NA | L | M |
Philips et al., 2022 | NA | M | M | NA | L | M |
Note: L = low; M = moderate; S = serious; U = unclear; NA = not applicable.
DISCUSSION
The central finding of this review is that the car was the travel mode reported as replaced by e-bike trips in 14 of 15 included studies, but that the substitution of active and public modes was common and that the magnitude of car substitution ranged from almost none in China and in general-purpose Dutch travel to roughly half of shifted trips in targeted commuter programs. The pattern matters because the emission and health benefit of the e-bike is conditional on which mode it displaces. Studies that recruited car commuters through subsidies, loans or trials reported large car reductions, while population panels and surveys in China reported that walking, conventional cycling and public transport absorbed much of the shift.
The comparison with prior quantitative syntheses is instructive. A meta-analysis of 38 observations in 24 studies placed the median mode substitution at 33% for public transit, 27% for the conventional bicycle, 24% for the automobile and 10% for walking, with wide interquartile ranges.(3) Our review found the automobile named more often, which likely reflects that several of the strongest included studies were car-targeted programs and randomized trials rather than a representative cross-section of adopters. The same meta-analysis found greater displacement of public transport in China and greater displacement of the automobile elsewhere, a geographic split that our included studies reproduce: the Nanjing survey found walking, cycling and bus displaced rather than cars, whereas the European and North American programs displaced cars.(3,23)
Longitudinal evidence from the Netherlands tempers the optimistic reading. Kroesen found that e-bike ownership mainly replaced conventional bicycle use, and Sun and colleagues reported that the year after acquiring an e-bike, conventional bicycle use fell the most while car, walking and public transport use declined to a smaller extent.(11,12) The panel study by de Haas and colleagues reached the same conclusion with a within-person model: only commuting trips showed car substitution, and the e-bike otherwise displaced the conventional bicycle.(4) In a cycling nation such as the Netherlands, the marginal e-bike adopter is often already a cyclist, which suppresses the car-substitution potential that policy makers attribute to the mode. This contrast with the Swedish and North American programs suggests that the substitution outcome is determined less by the vehicle than by who is recruited to use it.
The Chinese evidence describes a different pathway. E-bikes in China grew as a substitute for the conventional bicycle and public transport during a phase of motorization, and scholars have read that trajectory as a stepping stone toward car ownership rather than a durable escape from it.(6) Ownership dynamics in Kunming showed e-bikes competing with conventional bicycles and buses while car ownership continued to rise, the Nanjing survey concluded that e-bikes displaced benign modes, and a comparative study of China and the Netherlands contrasted a motorization pathway with a substitution pathway.(23,29,30) This stands in contrast to the Swiss and Belgian speed-pedelec evidence, where the faster vehicle displaced motorized two-wheelers and cars and led some owners to give up a car.(5,25) Speed-pedelec users also differ in profile, skewing male and middle-aged, which limits the population reach of that substitution.(31)
The mechanisms behind the commuting substitution are consistent with the physics and logistics of the mode. The electric assist removes the effort penalty that deters cycling on longer or hillier routes, and the higher speed brings a wider set of workplaces within a feasible travel time, which is why car substitution appears for commuting and single-destination work journeys but not for leisure or shopping.(4,18) Speed pedelecs extend that reach further, which explains their stronger displacement of cars and motorized two-wheelers in the Swiss and Belgian studies.(5,25) Weather, winter and storage constraints, by contrast, blunt the substitution for year-round commuting in colder climates, as novice riders in Canadian cities described.(32)
The randomized evidence deserves separate weight. The Swedish trial is the only included study that measured car substitution with GPS rather than self-report, and its 37% reduction in car mileage is the estimate least vulnerable to recall bias in this review.(16) The Norwegian trial confirms the direction in a different population, parents of young children, but its 36 participants make the effect imprecise.(19) Both trials provided the e-bike free of charge for a limited period, which raises the question of how the substitution persists once the vehicle is no longer subsidized, a question the Swiss trial addressed by showing a weakened car habit one year after a short exposure.(24)
A further source of divergence is measurement. The estimates obtained from GPS tracks, trip diaries and trajectory data describe observed behavior, whereas the share-based estimates from surveys depend on respondents correctly recalling the mode they would have used, a recall that is prone to optimism when the e-bike was acquired precisely to reduce driving.(4,16,17) The randomized and trip-data studies therefore carry greater internal validity, while the survey studies describe a broader and more representative population. The two families of evidence converge only in broad terms, that the car is replaceable but not the default counterfactual.
Adoption and use are not the same, and several included studies distinguished them. The Dutch incentive program showed that commuting distance conditioned whether the e-bike was used at all, and the Swiss trial showed that even car owners who did not buy an e-bike retained a weakened car habit, which suggests that exposure to the mode can shift intention without sustained use.(22,24) The GPS-tracked commuters used the e-bike for a narrow band of work trips, and the speed-pedelec owners reduced car use without necessarily selling the car, so the substitution recorded is a reduction in car use rather than a change in car ownership.(5,18)
The emission estimates converged on a substantial but bounded benefit. The Portland mode-replacement model estimated that a 15% e-bike mode share could cut car trip share from 84.7% to 74.8% and reduce passenger transport CO2 by 12%, about 225 kg per e-bike per year.(33) The English microsimulation placed the national capability at 24.4 million tonnes of CO2 per year, and the Chinese shared e-bike study measured 108 to 120 g of CO2 avoided per kilometer.(17,21) A data analysis of e-bike mobility likewise reported greenhouse gas benefits that hinge on the counterfactual mode.(34) These estimates assume that the replaced trip was a car trip, an assumption the substitution findings show is only partly met, and the modeling tools that convert cycling uptake into health and environmental impacts depend on the same substituted-mode assumption.(35) Life-cycle and use-phase accounting add a further caveat: the benefit of an e-bike trip depends on the electricity mix and on the emissions of the mode it displaces, and reviews of e-micromobility caution that these systems can also substitute for cleaner modes.(9)
The health framing points in the same conditional direction. Physical activity of e-bike users relative to conventional cyclists depends on the mode substituted, and older adults and people with chronic conditions use the e-bike to remain active when conventional cycling becomes difficult.(8,10) Qualitative accounts describe e-cycling as a way to stay physically active while managing effort, which supports the inclusion agenda reviewed for e-bikes as a mobility tool.(36,37) When the e-bike replaces a conventional bicycle or a walk trip, however, the activity gain is small or negative, and half of the shifted trips in the Dutch incentive program fell into that category.(22)
Adoption barriers also shape who substitutes what. Early adopters were younger, male and already interested in cycling, and stakeholder and infrastructure constraints limit the reach of the mode beyond enthusiasts.(7,38) Novice riders in Canadian cities saw the e-bike as a viable car substitute for short commutes but cited weight, winter weather and battery range as barriers, and a social-practice account argued that policies must shape the routines around e-bike commuting, not only the vehicle.(32,39) Bike-share evidence offers a parallel: shared bicycles replace car trips only for a minority of users, and micromobility integrates with public transport more often than it replaces it.(40,41) Reviews of e-micromobility and pedal-assist e-bikes reach a consistent conclusion, that car use decreases on average but the size of the effect depends on the population and the counterfactual.(2,9)
Infrastructure conditions the substitution as much as the vehicle. Speed pedelecs and e-bikes require storage, charging and safe routes, and the Belgian and Canadian studies both identified the lack of dedicated infrastructure and secure parking as barriers that push would-be car replacers back toward the car.(25,32) Where micromobility is integrated with public transport rather than set against it, the e-bike often feeds a train or bus trip instead of replacing one, which changes the emission accounting from substitution to complementarity.(41) Policies that pair e-bike support with cycling infrastructure and transport integration therefore widen the conditions under which car substitution occurs.
The geographic concentration of the evidence in Western Europe limits generalizability. Cycling infrastructure, urban form and the price of driving all condition whether an e-bike replaces a car, and the Chinese evidence indicates that substitution can invert in a motorizing context where the e-bike is itself a step toward car ownership.(6,30) Findings from the Netherlands, where cycling is already the norm, cannot be transferred to car-oriented settings without qualification, and findings from car-oriented North American programs cannot be transferred to contexts where public transport is the dominant alternative.
The equity dimension runs through these findings. E-bike adoption and speed-pedelec use skew toward men, middle-aged and higher-income users, and reviews of e-bikes as inclusive mobility caution that the benefits of car substitution do not automatically reach women, older adults or lower-income groups.(31,37) Programs that target car commuters therefore risk subsidizing the already mobile, and the inclusive-mobility literature suggests that pairing subsidies with outreach and with cargo and adaptive designs would spread the car-substitution benefit beyond the early-adopter profile.(37)
For practice, the distinction between the marginal adopter and the already active rider has a direct consequence. A subsidy paid to an existing cyclist who upgrades to an e-bike mostly reallocates cycling rather than replacing car travel, whereas a subsidy or loan that recruits a car commuter buys car kilometers back. Programs that report uptake alone therefore overstate their climate value, and evaluations should measure the counterfactual mode at baseline and follow-up. Verifying the baseline mode of program participants is a low-cost step that turns an uptake report into an evaluation of substitution. The speed-pedelec evidence suggests that a faster vehicle can extend substitution to longer commutes, but its demographic skew and higher purchase cost limit how far that lever reaches.(5,31)
For research, the field needs common metrics for mode substitution, longitudinal cohorts that follow adopters from before purchase to separate substitution from selection, and standardized questions on the counterfactual mode so that estimates expressed in incompatible units can be pooled. Emission models should be fed the observed substituted mode rather than an assumption of full car replacement, and evaluations of subsidy and lending programs should report the baseline mode of participants as a matter of course. Reviews in other languages and gray-literature searches would extend the evidence beyond the English-language record assembled here. The field would also benefit from reporting the counterfactual mode as a standard variable in every e-bike survey, so that substitution can be compared across settings rather than reconstructed case by case.
CONCLUSIONS
E-bike trips replace the car more often than any other mode, but the substitution of walking, conventional cycling and public transport is frequent. The magnitude of car substitution ranges from negligible in Chinese general travel to roughly half of shifted trips in targeted commuter programs, and it is largest in randomized and quasi-experimental studies that recruited car users. The emission benefit is conditional on that substitution, with estimates between 108 and 120 g of CO2 avoided per kilometer for shared e-bikes and up to 24.4 million tonnes per year at the national scale. Substitution patterns vary by user profile, trip purpose and context, and policies that target car commuters maximize the car-use and emission gains that the e-bike can deliver.
References
- 1 Zhou J, Li Z, Dong S, Sun J, Zhang Y. Visualization and bibliometric analysis of e-bike studies: A systematic literature review (1976–2023). Transportation Research Part D: Transport and Environment. 2023;122:103891. doi: 10.1016/j.trd.2023.103891
- 2 Jenkins M, Lustosa L, Chia V, Wildish S, Tan M, Hoornweg D, et al. What do we know about pedal assist E-bikes? A scoping review to inform future directions. Transport Policy. 2022;128:25-37. doi: 10.1016/j.tranpol.2022.09.005
- 3 Bigazzi A, Wong K. Electric bicycle mode substitution for driving, public transit, conventional cycling, and walking. Transportation Research Part D: Transport and Environment. 2020;85:102412. doi: 10.1016/j.trd.2020.102412
- 4 de Haas M, Kroesen M, Chorus C, Hoogendoorn-Lanser S, Hoogendoorn S. E-bike user groups and substitution effects: evidence from longitudinal travel data in the Netherlands. Transportation. 2022;49(3):815-840. doi: 10.1007/s11116-021-10195-3
- 5 Ravalet E, Marincek D, Rérat P. Are fast e-bikes an alternative to motorised individual transport? An exploratory study in Lausanne, Switzerland. belgeo. 2023;1(1). doi: 10.4000/belgeo.64678
- 6 Gu T, Kim I, Currie G. The two-wheeled renaissance in China—an empirical review of bicycle, E-bike, and motorbike development. International Journal of Sustainable Transportation. 2021;15(4):239-258. doi: 10.1080/15568318.2020.1737277
- 7 Wolf A, Seebauer S. Technology adoption of electric bicycles: A survey among early adopters. Transportation Research Part A: Policy and Practice. 2014;69:196-211. doi: 10.1016/j.tra.2014.08.007
- 8 Van Cauwenberg J, De Bourdeaudhuij I, Clarys P, de Geus B, Deforche B. E-bikes among older adults: benefits, disadvantages, usage and crash characteristics. Transportation. 2019;46(6):2151-2172. doi: 10.1007/s11116-018-9919-y
- 9 Şengül B, Mostofi H. Impacts of E-Micromobility on the Sustainability of Urban Transportation—A Systematic Review. Applied Sciences. 2021;11(13):5851. doi: 10.3390/app11135851
- 10 Castro A, Gaupp-Berghausen M, Dons E, Standaert A, Laeremans M, Clark A, et al. Physical activity of electric bicycle users compared to conventional bicycle users and non-cyclists: Insights based on health and transport data from an online survey in seven European cities. Transportation Research Interdisciplinary Perspectives. 2019;1:100017. doi: 10.1016/j.trip.2019.100017
- 11 Kroesen M. To what extent do e-bikes substitute travel by other modes? Evidence from the Netherlands. Transportation Research Part D: Transport and Environment. 2017;53:377-387. doi: 10.1016/j.trd.2017.04.036
- 12 Sun Q, Feng T, Kemperman A, Spahn A. Modal shift implications of e-bike use in the Netherlands: Moving towards sustainability?. Transportation Research Part D: Transport and Environment. 2020;78:102202. doi: 10.1016/j.trd.2019.102202
- 13 Bourne JE, Cooper AR, Kelly P, Kinnear FJ, England C, Leary S, et al. The impact of e-cycling on travel behaviour: A scoping review. Journal of Transport & Health. 2020;19:100910. doi: 10.1016/j.jth.2020.100910
- 14 Page MJ, McKenzie JE, Bossuyt PM, Boutron I, Hoffmann TC, Mulrow CD, et al. The PRISMA 2020 statement: an updated guideline for reporting systematic reviews. BMJ. 2021:n71. doi: 10.1136/bmj.n71
- 15 Rethlefsen ML, Kirtley S, Waffenschmidt S, Ayala AP, Moher D, Page MJ, et al. PRISMA-S: an extension to the PRISMA Statement for Reporting Literature Searches in Systematic Reviews. Syst Rev. 2021;10(1):39. doi: 10.1186/s13643-020-01542-z
- 16 Söderberg f.k.a. Andersson A, Adell E, Winslott Hiselius L. What is the substitution effect of e-bikes? A randomised controlled trial. Transportation Research Part D: Transport and Environment. 2021;90:102648. doi: 10.1016/j.trd.2020.102648
- 17 Li Q, Fuerst F, Luca D. Do shared E-bikes reduce urban carbon emissions?. Journal of Transport Geography. 2023;112:103697. doi: 10.1016/j.jtrangeo.2023.103697
- 18 Plazier PA, Weitkamp G, van den Berg AE. “Cycling was never so easy!” An analysis of e-bike commuters' motives, travel behaviour and experiences using GPS-tracking and interviews. Journal of Transport Geography. 2017;65:25-34. doi: 10.1016/j.jtrangeo.2017.09.017
- 19 Bjørnarå HB, Berntsen S, J te Velde S, Fyhri A, Deforche B, Andersen LB, et al. From cars to bikes – The effect of an intervention providing access to different bike types: A randomized controlled trial. PLoS ONE. 2019;14(7):e0219304. doi: 10.1371/journal.pone.0219304
- 20 Fitch DT, Gao Z, Noble L, Mac T. Effectiveness of Free Bikes and E-Bikes for Commute Mode Shift: The Case of Google’s Lending Program. Front Future Transp. 2022;3:886760. doi: 10.3389/ffutr.2022.886760
- 21 Philips I, Anable J, Chatterton T. E-bikes and their capability to reduce car CO2 emissions. Transport Policy. 2022;116:11-23. doi: 10.1016/j.tranpol.2021.11.019
- 22 de Kruijf J, Ettema D, Kamphuis CBM, Dijst M. Evaluation of an incentive program to stimulate the shift from car commuting to e-cycling in the Netherlands. Journal of Transport & Health. 2018;10:74-83. doi: 10.1016/j.jth.2018.06.003
- 23 Lin X, Wells P, Sovacool BK. Benign mobility? Electric bicycles, sustainable transport consumption behaviour and socio-technical transitions in Nanjing, China. Transportation Research Part A: Policy and Practice. 2017;103:223-234. doi: 10.1016/j.tra.2017.06.014
- 24 Moser C, Blumer Y, Hille SL. E-bike trials’ potential to promote sustained changes in car owners mobility habits. Environ Res Lett. 2018;13(4):044025. doi: 10.1088/1748-9326/aaad73
- 25 Van den Steen N, Herteleer B, Cappelle J, Vanhaverbeke L. Motivations and Barriers for Using Speed Pedelecs for Daily Commuting. WEVJ. 2019;10(4):87. doi: 10.3390/wevj10040087
- 26 Jones T, Harms L, Heinen E. Motives, perceptions and experiences of electric bicycle owners and implications for health, wellbeing and mobility. Journal of Transport Geography. 2016;53:41-49. doi: 10.1016/j.jtrangeo.2016.04.006
- 27 Di Gangi M, Comi A, Polimeni A, Belcore OM. E-bike use in urban commuting: empirical evidence from the home-work plan. AoT. 2022;62(2):91-104. doi: 10.5604/01.3001.0015.9568
- 28 Winslott Hiselius L, Svensson Å. E-bike use in Sweden – CO2 effects due to modal change and municipal promotion strategies. Journal of Cleaner Production. 2017;141:818-824. doi: 10.1016/j.jclepro.2016.09.141
- 29 Cherry CR, Yang H, Jones LR, He M. Dynamics of electric bike ownership and use in Kunming, China. Transport Policy. 2016;45:127-135. doi: 10.1016/j.tranpol.2015.09.007
- 30 Sun Q, Zhao J, Spahn A, Verbong G. Pathway towards sustainability or motorization? A comparative study of e-bikes in China and the Netherlands. Global Environmental Change. 2023;82:102735. doi: 10.1016/j.gloenvcha.2023.102735
- 31 van der Salm M, Chen Z, van Lierop D. Who are those fast cyclists? An analysis of speed pedelec users in the Netherlands. International Journal of Sustainable Transportation. 2023;17(9):1074-1086. doi: 10.1080/15568318.2022.2152402
- 32 Edge S, Dean J, Cuomo M, Keshav S. Exploring e‐bikes as a mode of sustainable transport: A temporal qualitative study of the perspectives of a sample of novice riders in a Canadian city. Canadian Geographies / G&#233;ographies canadiennes. 2018;62(3):384-397. doi: 10.1111/cag.12456
- 33 McQueen M, MacArthur J, Cherry C. The E-Bike Potential: Estimating regional e-bike impacts on greenhouse gas emissions. Transportation Research Part D: Transport and Environment. 2020;87:102482. doi: 10.1016/j.trd.2020.102482
- 34 Azevedo BF, Metzger K, Pereira AI. A comprehensive data analysis of e-bike mobility and greenhouse gas emissions in a higher education community: IPBike study of case. SN Appl Sci. 2023;5(11):291. doi: 10.1007/s42452-023-05504-7
- 35 Woodcock J, Abbas A, Ullrich A, Tainio M, Lovelace R, Sá TH, et al. Development of the Impacts of Cycling Tool (ICT): A modelling study and web tool for evaluating health and environmental impacts of cycling uptake. PLoS Med. 2018;15(7):e1002622. doi: 10.1371/journal.pmed.1002622
- 36 Way KM, Bourne JE, Armstrong MEG. “I’m Hooked on e-cycling, I Can Finally Be Active Again”: Perceptions of e-cycling as a Physical Activity Intervention during Breast Cancer Treatment. IJERPH. 2023;20(6):5197. doi: 10.3390/ijerph20065197
- 37 Lee K, Sener IN. E-bikes Toward Inclusive Mobility: A Literature Review of Perceptions, Concerns, and Barriers. Transportation Research Interdisciplinary Perspectives. 2023;22:100940. doi: 10.1016/j.trip.2023.100940
- 38 Aono S, Bigazzi A. Industry Stakeholder Perspectives on the Adoption of Electric Bicycles in British Columbia. Transportation Research Record: Journal of the Transportation Research Board. 2019;2673(5):1-11. doi: 10.1177/0361198119837158
- 39 Schneider PR. From elements to policies: A Shovian social practice perspective on pathways to facilitate daily E-bike commuting. Transport Policy. 2023;143:36-45. doi: 10.1016/j.tranpol.2023.08.015
- 40 Fishman E, Washington S, Haworth N. Bike share’s impact on car use: Evidence from the United States, Great Britain, and Australia. Transportation Research Part D: Transport and Environment. 2014;31:13-20. doi: 10.1016/j.trd.2014.05.013
- 41 Oeschger G, Carroll P, Caulfield B. Micromobility and public transport integration: The current state of knowledge. Transportation Research Part D: Transport and Environment. 2020;89:102628. doi: 10.1016/j.trd.2020.102628
Declarations
Funding
No financing
Conflict of interest
None
Authorship contributions
Drafting – original draft: Rómulo Esteban Montilla, Rosa Edilma Garzón González.
Writing–review and editing: Rómulo Esteban Montilla, Rosa Edilma Garzón González.