

Abstract
Tourism and real estate development are advancing on the coastal localities of southern Sinaloa, Mexico, yet the perceptions of their residents are rarely measured. Using the preliminary data cut from the pilot survey of project FZ-HAB-0021 on the Factoriza UAS platform, this study described the initial behaviour of a fifteen-item scale with three dimensions, Presence of tourism, Living conditions and Rootedness, in Teacapán (Escuinapa) and Chametla (El Rosario). With a cross-sectional design, 20 cases out of a target of 100 were analysed while data collection remained open. Descriptive statistics, Cronbach’s alpha, McDonald’s omega total, exploratory factor analysis and Spearman correlations between dimensions were estimated. Rootedness showed acceptable internal consistency (α = .763; ω = .786), whereas Presence of tourism (α = .355) and Living conditions (α = .277) did not behave as homogeneous scales. The factor analysis, with KMO = .325, suggested two factors: one of rootedness and a bipolar one that opposes the presence of real estate and commercial tourism to housing affordability and the sufficiency of services. Living conditions and Rootedness were positively associated (ρ = .631, 95% CI [.219, .852]). The findings do not yet provide structural validity evidence and point to revisions of the instrument.
Keywords
tourism gentrification, place attachment, habitability, coastal localities
INTRODUCTION
Tourism has been promoted for decades as a pathway to development for coastal and rural localities in Mexico. Investment-attraction policies, large tourism projects and the arrival of new temporary residents promise employment and better services, but recent literature has also documented unwanted effects, including tourism gentrification: the rising cost of land and everyday life, the transformation of commerce and of the uses of space, the privatization of common goods and the weakening of the bond between the resident population and their place (Nikšić Radić and Dragičević, 2025). In small localities, where life depends on fishing, agriculture and access to shared natural resources, these changes can profoundly alter habitability, understood not only as the material quality of housing and services, but as the possibility of continuing to live in and feel part of the place.
Southern Sinaloa is undergoing a process of this kind. In Mazatlán, the real estate boom oriented toward second homes and residential tourism has been accompanied by social tensions, pressure on infrastructure and the replacement of traditional uses along the coastal strip (Bojorquez Luque et al., 2023; Bojórquez Luque and Osuna Covarrubias, 2025; Mendieta Vega and Roldán Clarà, 2024). Outside the city, studies of other coastal areas of the state describe the expansion of residential tourism over fragile ecosystems, with progressive privatization of coastal areas and socio-spatial segregation (García-Macías and Leyva-Iturrios, 2026). In the municipality of Escuinapa, the Fondo Nacional de Fomento al Turismo (FONATUR, n. d.) promoted the Centro Integralmente Planeado Sustentable Costa Pacífico, marketed as “Playa Espíritu Teacapán,” with vacation housing, golf courses and marinas on a coast adjoining the Marismas Nacionales protected area. That wetland system provides ecosystem services on which the local population depends and shows signs of degradation associated with the intensification of human activities (Cervantes-Escobar and Ruiz-Luna, 2024).
Teacapán, in Escuinapa, and Chametla, in El Rosario, are two localities in southern Sinaloa exposed to these transformations, yet the voice of their inhabitants barely appears in the literature. The available studies on the region have focused on the tourism development of Mazatlán, on the planning of large projects or on coastal ecosystems, and no instruments were identified that measure, from the perception of the resident population, the presence of tourism, living conditions and rootedness in these localities. Without an instrument with evidence of validity, the discussion of tourism gentrification in small localities rests on qualitative case studies that, although valuable, do not allow systematic monitoring over time.
The FZ-HAB-0021 project of the Factoriza UAS platform set out to study the relationship between tourism, tourism gentrification and habitability in Teacapán and Chametla through a fifteen-item scale organized into three dimensions: Presence of tourism in the locality, Living conditions in the locality and Rootedness in the locality. This article reports the results of the first pilot survey, in a preliminary data cut of reduced size, so its scope is the initial review of the instrument and not the estimation of population parameters.
The general objective was to describe the initial behavior of a scale of presence of tourism, living conditions and rootedness in the preliminary data cut of its pilot survey in Teacapán and Chametla, Sinaloa. The specific objectives were, first, to describe the distribution of responses to each item; second, to estimate the internal consistency of each dimension using the alpha and omega coefficients; third, to explore the internal structure of the set of items through exploratory factor analysis; and fourth, to explore the relationship between the scores of the three dimensions. The project did not declare hypotheses, so the study has a descriptive and exploratory scope.
DEVELOPMENT
Tourism gentrification in rural and coastal spaces
Tourism gentrification designates the transformation of a place by the arrival of visitors, temporary residents and capital oriented toward tourism consumption, with effects of rising prices, changes in land use and displacement of the local population. The integrative review by Nikšić Radić and Dragičević (2025), which brought together tourism gentrification and lifestyle migration, found that both processes can produce displacement and inequality, but also opportunities for regeneration when they are accompanied by inclusive governance and local participation.
In Mexico, the study by Hernández Flores (2023) on San Pedro and San Andrés Cholula showed that the tourism designation of Pueblo Mágico was accompanied by gated developments, rising land and housing prices, the conversion of agricultural land into residential land and the replacement of traditional commerce; direct displacement of original residents was limited, but there was physical and symbolic segregation, and conflicts centered more on identity impacts than on economic ones. In a traditional industrial area of Beijing, Lin et al. (2023) identified, through Q methodology, the privatization of public spaces, the reorientation of services toward visitors, the weakening of community ties and the commodification of local consumption as sources of stress that were related to the desire to move away.
The Presence of tourism in the locality dimension of the instrument studied captures the perception of these changes: the increase in tourists (R1), the construction of houses for visitors (R2), food prices aimed at tourists (R3), the perception that life is no longer as it was before (R4, reverse) and the purchase of land by outsiders (R5). The dimension combines indicators of influx, real estate market, prices and general change, contents that the literature treats as related but not equivalent facets of the gentrification process.
Living conditions and habitability in coastal localities
The consequences of tourism for the living conditions of coastal communities are ambivalent. In the coastal community of Nhon Ly, Vietnam, Quang et al. (2023) documented that tourism improved household incomes and led many fishing families to shift toward tourism services, but they also recorded rising land prices, competition among businesses, a decline in fishing and limited local participation confined to the provision of services, with no presence in decision-making. On the coast of Sinaloa, García-Macías and Leyva-Iturrios (2026) described a residential tourism model that, together with short-term economic growth, is associated with habitat fragmentation, mangrove loss, pressure on water resources, gradual privatization of coastal areas and commodification of coastal commons.
The Living conditions in the locality dimension brings together enjoyment of living in the locality (R6), the ability to pay for housing (R7), the sufficiency of services for residents (R8), the opening of beaches to the population (R9) and the family's intention to leave the locality (R10, reverse). Its items combine an overall affective assessment, two material conditions, a condition of access to a common good and a behavioral intention. The opening of beaches and housing affordability refer directly to the mechanisms of privatization and rising costs described in the literature, while enjoyment of living in the locality is conceptually close to rootedness.
Rootedness, community identity and response to tourism
Rootedness or place attachment is the affective and symbolic bond that ties people to their territory. Kamani Fard and Paydar's (2024) review of place attachment in urban environments indicated that social interaction and local features that express history and culture are associated with a stronger bond. In tourism contexts, rootedness and community identity intervene in the way the population values tourism. At an agricultural heritage site in Jiangsu, China, Wang et al. (2021) found that perceived benefits of tourism were positively associated with support for tourism development and perceived costs negatively, and that perceived justice and community identity mediated that relationship.
In the Chinese-language literature, Xing (2026) analyzed the case of the ancient city of Pingyao and proposed understanding the emotions of residents of heritage destinations as the lived expression of tensions between heritage protection, local life and commercial development; the study found that social capital mediates the transition from emotion to collective action and that conflict can lead to institutional reforms. The Rootedness in the locality dimension of the instrument captures the feeling of belonging (R11), the currency of customs (R12), the desire for children to grow up in the locality (R13), the perception that the locality no longer belongs to the respondent (R14, reverse) and participation in local festivities (R15). From a cross-sectional design, the relationships between presence of tourism, living conditions and rootedness must be understood as associations and not as relations of dependence.
METHODOLOGY
Design
We conducted a quantitative, non-experimental, cross-sectional study with a descriptive and exploratory scope. The data come from survey LEV-0026, "Piloto Teacapán y Chametla · Turismo y arraigo", of project FZ-HAB-0021 on the Factoriza UAS platform, and from the frozen dataset DST-0026, with a cutoff date of 9 October 2026. The survey is an independent sample and the only one in the project. The project is registered in Factoriza with a mixed route; the results package contains only the survey component, which is the one analyzed here.
Population, sample and data cut
The population of the survey was defined as persons aged 18 or older residing in Teacapán or Chametla. The territory comprises Teacapán, in the municipality of Escuinapa, and Chametla, in the municipality of El Rosario, Sinaloa. According to the Factoriza record, 51 persons opened the questionnaire and 20 completed it; no cases were excluded for quality control, so 20 cases were analyzed (Table 2).
The data cut analyzed is preliminary: it brings together 20 cases out of a target of 100, and the survey remained open, in field status, as of the cutoff date. With 20 cases for 15 items, the ratio is 1.3 cases per item, far below the ratio recommended for item factor analysis, whose first condition is to verify the adequacy of the data and of the sample (Ferrando et al., 2022; Goretzko et al., 2021). The dataset does not distinguish the locality of residence, so the analyses treat the two localities as a single sample.
Instrument
A fifteen-item scale was applied with a five-point response format, from Strongly disagree (1) to Strongly agree (5), organized into three dimensions of five items each: Presence of tourism in the locality (R1 to R5), Living conditions in the locality (R6 to R10) and Rootedness in the locality (R11 to R15). Three items are worded in the reverse direction, R4 ("In my locality life goes on as before"), R10 ("My family has thought about leaving the locality") and R14 ("I feel that my locality no longer belongs to me"), and are recoded in the data matrix. After recoding, a higher score indicates greater perceived presence of tourism, better perceived living conditions and greater rootedness. Table 1 presents the code, the dimension, the text and the direction of each item.
Code | Dimension | Item | Reverse |
|---|---|---|---|
R1 | Presence of tourism in the locality | In my locality there are more tourists than a few years ago | No |
R2 | Presence of tourism in the locality | In my locality, houses are built for visitors | No |
R3 | Presence of tourism in the locality | Food prices in my locality are aimed at tourists | No |
R4 | Presence of tourism in the locality | In my locality, life goes on as before | Yes |
R5 | Presence of tourism in the locality | People from outside buy land in my locality | No |
R6 | Living conditions in the locality | I like living in my locality | No |
R7 | Living conditions in the locality | I can afford the housing where I live | No |
R8 | Living conditions in the locality | In my locality, services are sufficient for the inhabitants | No |
R9 | Living conditions in the locality | The beaches of my locality remain open to residents | No |
R10 | Living conditions in the locality | My family has considered leaving the locality | Yes |
R11 | Rootedness in the locality | I feel part of my locality | No |
R12 | Rootedness in the locality | My customs are still present in my locality | No |
R13 | Rootedness in the locality | I want my children to grow up in this locality | No |
R14 | Rootedness in the locality | I feel that my locality no longer belongs to me | Yes |
R15 | Rootedness in the locality | I take part in the festivities of my locality | No |
Note. 5-point response scale (Strongly disagree, Disagree, Neither agree nor disagree, Agree, Strongly agree). Reverse-scored items are already recoded in the delivered matrix. Source: Factoriza UAS, project FZ-HAB-0021, survey LEV-0026, dataset DST-0026.
Procedure
Responses were collected through the survey questionnaire administered in Factoriza UAS, which records express online informed consent before the first item and does not collect identifying data. Factoriza froze dataset DST-0026 with a cryptographic fingerprint, generated the matrix with the reverse-scored items recoded, and produced the descriptive statistics and internal consistency analyses (runs RUN-00138 to RUN-00144). The complementary analyses were run with the data file and the item dictionary exported by the platform.
Data analysis
In a first stage, Factoriza UAS calculated the mean, standard deviation, skewness, kurtosis and response percentages at the extreme values of each item, as well as the internal consistency of each dimension using Cronbach's alpha (Cronbach, 1951), with the corrected item-total correlation and alpha if the item is deleted. In a second stage, the program analisis_psicometrico.py, version 1.0, was run in Python 3.13.16 (Python Software Foundation, 2026), with NumPy 2.5.3 (Harris et al., 2020), SciPy 1.18.1 (Virtanen et al., 2020) and pandas 3.0.5. The program applies fixed, declared procedures, with no manual intervention in the calculations.
The program estimated McDonald's omega total (McDonald, 1999/2013) for each dimension from a one-factor model, without reversing items; when any item correlates or loads negatively with respect to the rest of its dimension, the program does not report omega because the coefficient ceases to be interpretable. Internal structure was explored through exploratory factor analysis on the Pearson correlation matrix of the fifteen items, after verifying the Kaiser-Meyer-Olkin measure of sampling adequacy (Kaiser, 1974), the item-level adequacy (Lorenzo-Seva and Ferrando, 2021) and Bartlett's test of sphericity (Bartlett, 1950). The number of factors was determined through parallel analysis (Horn, 1965) with 100 simulations and seed 2026; extraction was by minimum residual and rotation was oblimin, which allows correlation between factors. All loadings, the communality and the adequacy of each item are reported. Finally, the program estimated the relationship between the mean scores of the dimensions with Spearman's coefficient and its 95% confidence interval, using Fisher's transformation with the standard error of Bonett and Wright (2000).
The reference values for interpreting the indices, such as the value of 0.60 for the KMO, are treated as guidelines and not as decision rules (Ferrando et al., 2022). No item was eliminated; the program flags problematic items and leaves the decision to the authors. No confirmatory factor analysis was run, which is proposed as future work.
Ethical considerations
Participation was voluntary and anonymous. Factoriza UAS records express informed consent online and does not collect names, email addresses or other identifying data. In small localities, where people know one another and conflicts over land or tourism can have consequences for community life, anonymity is an indispensable condition for obtaining sincere opinions.
Statement on the use of artificial intelligence
During the preparation of this manuscript, the following were used: the Factoriza UAS platform, for data management and descriptive statistics and internal consistency analyses; a Python analysis program with fixed and validated procedures, for omega, exploratory factor analysis and correlations between dimensions; and the Claude Opus language model (Anthropic), to run that program, assist in the literature search, draft the manuscript and assemble the document from the results. The authors reviewed, corrected and approved the entire text, verified every reference and assume full responsibility for the content of the article.
RESULTS
Sample composition
Indicator | Value |
|---|---|
People who opened the questionnaire | 51 |
Completed questionnaires | 20 |
Cases excluded due to quality control | 0 |
Cases analyzed | 20 |
Items | 15 |
Note. Survey "Piloto Teacapán y Chametla · Turismo y arraigo" (LEV-0026); population: persons aged 18 or older residing in Teacapán or Chametla; territory: Teacapán (Escuinapa) and Chametla (El Rosario), Sinaloa. Dataset DST-0026, fingerprint d55643a0e887aff3. Source: Factoriza UAS. Preliminary data cut: n = 20 of a target of 100, with the open data collection.
Descriptive statistics
Table 3 and Figure 1 present the descriptive statistics. In Presence of tourism, the highest mean in the set corresponded to R5, the purchase of land by outsiders (M = 4.00, SD = 1.17), with 40 % of responses at the maximum value and a distribution skewed toward high values (skewness = -1.32). Next came R4, the perception that life is no longer the same as before in its recoded version (M = 3.65, SD = 1.35), and R2, the construction of houses for visitors (M = 3.35, SD = 1.23). The lowest mean in the dimension was that of R1, the increase in tourists compared with previous years (M = 3.05, SD = 1.39), which also showed the greatest dispersion in the set.
In Living conditions, the highest mean was that of R9, the opening of the beaches to residents (M = 3.85, SD = 0.88), and the lowest that of R8, the sufficiency of services for residents (M = 2.70, SD = 1.03), which was also the lowest mean in the set; the ability to pay for housing (R7) obtained M = 3.05 (SD = 1.19). In Rootedness, the highest means were those of R12, the continued vitality of customs (M = 3.70, SD = 0.47), and R11, the feeling of belonging (M = 3.60, SD = 0.68), and the lowest those of R14, the perception that the locality no longer belongs to the respondent in its recoded version (M = 3.00, SD = 0.79), and R13, the desire for one's children to grow up in the locality (M = 3.05, SD = 0.94). The small standard deviations of R12 and R11 indicate responses concentrated in few values.
Item | M | SD | Skewness | Kurtosis | Floor | Ceiling |
|---|---|---|---|---|---|---|
R1 | 3.05 | 1.39 | 0.03 | -1.24 | 15% | 20% |
R2 | 3.35 | 1.23 | -0.19 | -1.05 | 5% | 20% |
R3 | 3.20 | 0.77 | -0.37 | -1.13 | 20% | 40% |
R4 | 3.65 | 1.35 | -0.86 | -0.46 | 10% | 30% |
R5 | 4.00 | 1.17 | -1.32 | 1.17 | 5% | 40% |
R6 | 3.40 | 0.94 | -0.95 | 0.98 | 5% | 5% |
R7 | 3.05 | 1.19 | -0.52 | -0.75 | 15% | 5% |
R8 | 2.70 | 1.03 | 0.04 | 0.28 | 15% | 5% |
R9 | 3.85 | 0.88 | -0.73 | 0.40 | 10% | 20% |
R10 | 3.30 | 0.98 | 0.07 | -0.96 | 25% | 10% |
R11 | 3.60 | 0.68 | -0.40 | 0.36 | 5% | 5% |
R12 | 3.70 | 0.47 | -0.95 | -1.24 | 30% | 70% |
R13 | 3.05 | 0.94 | -0.94 | 0.41 | 10% | 35% |
R14 | 3.00 | 0.79 | -0.70 | 0.81 | 5% | 25% |
R15 | 3.20 | 1.01 | -0.79 | -0.83 | 5% | 55% |
Note. N = 20. Floor and ceiling indicate the percentage of responses at the minimum and maximum values. The item-total correlation column across the fifteen items is omitted because it combines three dimensions; the item-total correlation by dimension is presented in Table 4. Factoriza UAS run RUN-00138. Preliminary data cut: n = 20 of a target of 100, with the open survey.
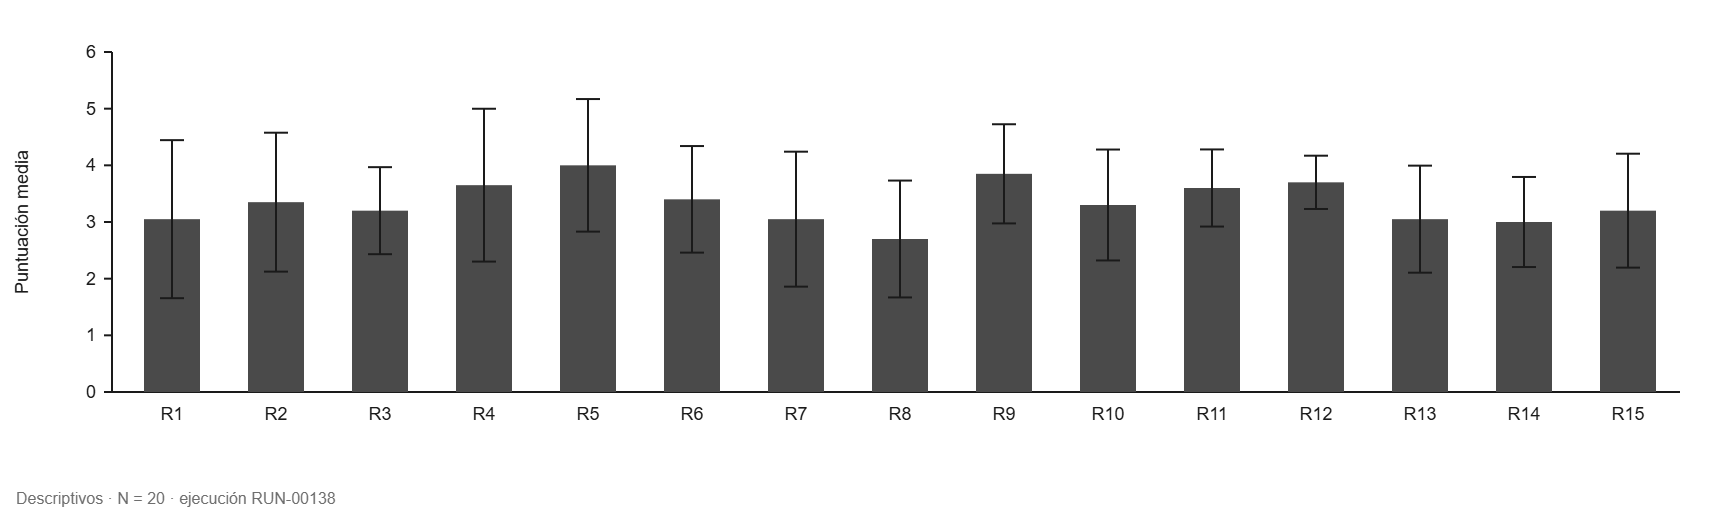
Figure 1. Mean scores by item with one-standard-deviation bars.
Note. N = 20. Scale from 1 to 5; reverse items R4, R10 and R14 are shown recoded. Factoriza UAS run RUN-00138. Preliminary data cut: n = 20 of a target of 100, with the open survey.Internal consistency
Table 4 brings together the item-by-dimension analysis computed by Factoriza, and Table 5 presents the coefficients from the complementary program. The alpha values coincided in both calculations. Rootedness in the locality reached α = .763 and ω = .786, with corrected item-total correlations from .443 to .693 and no item whose removal raised alpha. Presence of tourism in the locality obtained α = .355 and Living conditions in the locality α = .277; in both, omega is not reported, because the program identified items in the opposite direction to the rest of the dimension: R4 in Presence of tourism, and R9 and R10 in Living conditions.
The item-by-item analysis locates the problems. In Presence of tourism, R5 obtained the highest corrected item-total correlation (.478) and its removal would reduce alpha to .029, which indicates that the low internal consistency of the dimension rests almost entirely on the purchase of land by outsiders; R4 presented a correlation of .044 and its removal would raise alpha to .425, and R1, R2 and R3 showed correlations from .124 to .157. In Living conditions, R8, the sufficiency of services, was the most coherent item (.407) and its removal would bring alpha to -.068; R10 presented a correlation of -.045 and R9 of .009, and the removal of either of them would raise alpha to .382 and .328, respectively.
Dimension | Item | Corrected item-total r | α if item deleted |
|---|---|---|---|
Presence of tourism in the locality | R1 | .124 | .359 |
Presence of tourism in the locality | R2 | .151 | .325 |
Presence of tourism in the locality | R3 | .157 | .327 |
Presence of tourism in the locality | R4 | .044 | .425 |
Presence of tourism in the locality | R5 | .478 | .029 |
Living conditions in the locality | R6 | .227 | .147 |
Living conditions in the locality | R7 | .098 | .274 |
Living conditions in the locality | R8 | .407 | -.068 |
Living conditions in the locality | R9 | .009 | .328 |
Living conditions in the locality | R10 | -.045 | .382 |
Rootedness in the locality | R11 | .595 | .704 |
Rootedness in the locality | R12 | .474 | .752 |
Rootedness in the locality | R13 | .443 | .761 |
Rootedness in the locality | R14 | .564 | .709 |
Rootedness in the locality | R15 | .693 | .656 |
Note. N = 20. The corrected item-total correlation excludes the item itself from its dimension total. Cronbach's α for the full dimension, with 5 items each: Presence of tourism in the locality = .355 (RUN-00139); Living conditions in the locality = .277 (RUN-00141); Rootedness in the locality = .763 (RUN-00143). Source: Factoriza UAS, Tables 4, 6 and 8 of the package, compiled without modifying values. Preliminary data cut: n = 20 of a target of 100, with the open survey.
Dimension | Items | n | α | ω | Observation |
|---|---|---|---|---|---|
Presence of tourism in the locality | 5 | 20 | .355 | n/a | Reverse-worded items: R4; ω not interpretable |
Living conditions in the locality | 5 | 20 | .277 | n/a | Reverse-worded items: R9, R10; ω not interpretable |
Rootedness in the locality | 5 | 20 | .763 | .786 |
Note. α = Cronbach's alpha; ω = McDonald's omega total from a one-factor minimum residual model, without reversing items. Complete cases per dimension. Source: own elaboration with analisis_psicometrico.py 1.0 (Python 3.13.16), dataset DST-0026_FZ_HAB_0021. Preliminary data cut: n = 20 out of a target of 100, with the survey open.
Internal structure
The exploratory factor analysis could be estimated, but the data conditions were unfavorable. The overall measure of sampling adequacy was KMO = .325, below the indicative reference of 0.60, and most items showed low individual adequacies, flagged by the program (Table 7). Bartlett's test was significant, χ²(105) = 138.90, p = .015, indicating that the matrix is not an identity matrix, but this is not sufficient to justify factorization. Parallel analysis indicated the retention of two factors (Figure 2), which together explained 36.14 % of the variance: the first, 19.52 %, with a sum of squared loadings of 2.93, and the second, 16.62 %, with 2.49 (Table 6). The correlation between factors estimated by oblimin rotation was .183.
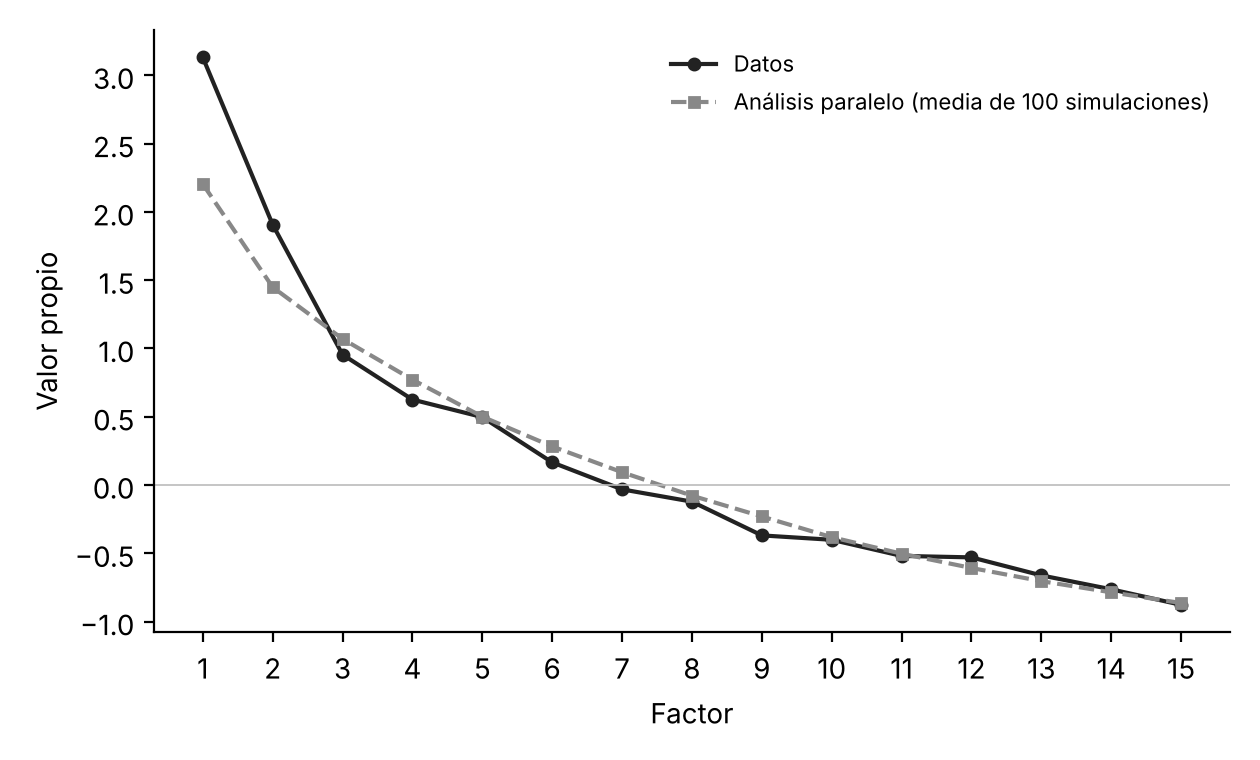
Figure 2. Scree plot with parallel analysis.
Note. Eigenvalues of the reduced data matrix versus the mean of 100 simulated matrices of the same size (seed 2026). Source: own elaboration with analisis_psicometrico.py 1.0 (Python 3.13.16), dataset DST-0026_FZ_HAB_0021. Preliminary data cut: n = 20 of a target of 100, with the open survey.Factor | Sum of squared loadings | % of variance | Cumulative % |
|---|---|---|---|
1 | 2.93 | 19.52 | 19.52 |
2 | 2.49 | 16.62 | 36.14 |
Note. KMO = .325; Bartlett's test of sphericity: χ²(105) = 138.90, p = .015. Number of factors by parallel analysis: 2. Source: own elaboration with analisis_psicometrico.py 1.0 (Python 3.13.16), dataset DST-0026_FZ_HAB_0021. Preliminary data cut: n = 20 of a target of 100, with the open survey. With KMO below the reference value and 1.3 cases per item, the solution is presented only as a preliminary exploration.
The pattern matrix (Table 7) did not reproduce the three expected dimensions, but it did show an interpretable organization. Factor 1 grouped the rootedness items, with the highest loadings on R11, the feeling of belonging (.818), R15, participation in the festivities (.803), and R14, belonging to the locality in its recoded version (.630), together with R6, liking living in the locality (.646), and R9, the opening of the beaches (.445). Factor 2 was bipolar: at one pole, R2, the construction of houses for visitors (-.755), R3, food prices for tourists (-.612), and R5, the purchase of land by outsiders (-.354) loaded negatively; at the other pole, R8, the sufficiency of services (.610), R7, the ability to pay for housing (.565), R15 (.465) and R13, the desire for children to grow up in the locality (.432) loaded positively.
Three items, R1, R4 and R10, did not reach a sufficient loading on any factor, and R3 and R15 showed cross-loadings. The communality of R15 was .997, very close to 1, which suggests a solution at the limit of what is admissible. The program flagged thirteen items that require a decision by the authors. For these reasons, the loading matrix documents the behavior of the items and guides the revision of the instrument, but it does not constitute evidence about its dimensionality.
Factor | |||||
|---|---|---|---|---|---|
Item | 1 | 2 | h² | MSA | Observation |
R1 | .275 | -.141 | .081 | .215 | insufficient loading; low MSA |
R2 | .019 | -.755 | .566 | .562 | opposite sign |
R3 | .423 | -.612 | .459 | .276 | cross-loading; opposite sign; low MSA |
R4 | -.262 | .189 | .086 | .155 | insufficient loading; opposite sign; low MSA |
R5 | -.025 | -.354 | .130 | .193 | opposite sign; low MSA |
R6 | .646 | -.201 | .410 | .228 | low MSA |
R7 | .107 | .565 | .353 | .276 | low MSA |
R8 | .211 | .610 | .464 | .329 | low MSA |
R9 | .445 | -.237 | .215 | .204 | low MSA |
R10 | -.047 | .290 | .081 | .175 | insufficient loading; low MSA |
R11 | .818 | -.089 | .650 | .528 | |
R12 | .374 | .241 | .230 | .367 | low MSA |
R13 | .285 | .432 | .313 | .477 | low MSA |
R14 | .630 | -.155 | .385 | .500 | |
R15 | .803 | .465 | .997 | .642 | cross-loading |
Note. Pattern matrix. Principal axis extraction with minimum residual and oblimin rotation (γ = 0) on the Pearson correlation matrix; 20 complete cases. h² = communality; MSA = measure of sampling adequacy per item. All loadings are shown. Source: own elaboration with analisis_psicometrico.py 1.0 (Python 3.13.16), dataset DST-0026_FZ_HAB_0021. Preliminary data cut: n = 20 of a target of 100, with the open survey. The expected dimension column is omitted to fit the table to the page width: R1 to R5 correspond to Presence of tourism in the locality, R6 to R10 to Living conditions in the locality and R11 to R15 to Rootedness in the locality (Table 1).
Relationship between the dimensions
Pair of dimensions | n | ρ | IC 95 % | p |
|---|---|---|---|---|
Presence of tourism in the locality and Living conditions in the locality | 20 | -.333 | [-.683, .141] | .152 |
Presence of tourism in the locality and Rootedness in the locality | 20 | -.095 | [-.516, .364] | .691 |
Living conditions in the locality and Rootedness in the locality | 20 | .631 | [.219, .852] | .003 |
Note. Spearman's ρ between the mean scores of each dimension (cases with all items of both). Interval by Fisher transformation with the Bonett and Wright standard error. Cross-sectional design: associations, not effects. Source: own elaboration with analisis_psicometrico.py 1.0 (Python 3.13.16), dataset DST-0026_FZ_HAB_0021. Preliminary data cut: n = 20 of a target of 100, with the open survey.
Discussion of results
The purpose of this study was to describe the initial behavior of a scale of presence of tourism, living conditions and rootedness in Teacapán and Chametla. The central result is twofold. On the one hand, the Rootedness in the locality dimension showed acceptable internal consistency and items coherent with one another, and its items defined the first factor of the exploratory analysis; on the other hand, Presence of tourism and Living conditions did not behave as homogeneous scales. With 20 cases, all coefficients are provisional: the simulation literature on alpha and omega coefficients has been developed with much larger samples (Malkewitz et al., 2023). Even so, the pattern of results offers substantive clues worth examining before the survey is closed.
The coherence of the rootedness dimension, which brings together belonging, customs, desire to remain and participation in festivities, is compatible with the conception of place attachment as a bond that rests on social interaction and on the local characteristics that express history and culture (Kamani Fard and Paydar, 2024). That the liking for living in the locality and the openness of the beaches loaded on the same factor suggests that, for the surveyed population, rootedness includes the valuation of the environment and access to common goods, in line with studies that place the privatization of coastal areas among the processes that threaten local life (García-Macías and Leyva-Iturrios, 2026). The positive association between living conditions and rootedness, the most robust of the data cut, points in the same direction, although its confidence interval is wide and the cross-sectional design prevents establishing its direction.
The second factor offers the most relevant clue for the object of the project. Its bipolar character opposed the perception of the presence of real estate and commercial tourism, that is, the construction of houses for visitors, prices designed for tourists and the purchase of land by outsiders, to the perception that housing is affordable and services suffice for the inhabitants. This pattern is consistent with the literature that links tourism gentrification with the rising cost of land and of living and with the reorientation of services toward visitors (Hernández Flores, 2023; Lin et al., 2023; Quang et al., 2023), and with the negative, though not conclusive, correlation between Presence of tourism and Living conditions. If the pattern holds in the final data cut, it could indicate that the perception of tourism and the perception of material conditions are not separate dimensions, but poles of a single valuation of the process of change.
The weakness of Presence of tourism admits other explanations. The fact that the purchase of land by outsiders concentrated the consistency of the dimension, whereas the increase in tourists (R1) and the change in daily life (R4) barely covaried with it, suggests that the perception of the real estate market is more shared than the perception of tourist influx. The two localities of the survey could differ in the intensity and type of presence of tourism, and the dataset does not allow them to be distinguished; heterogeneity between localities is a plausible explanation that can only be examined if the locality of residence is recorded. In Living conditions, the opening of the beaches (R9) and the intention to leave (R10) did not covary with the rest, which indicates that the dimension mixes material conditions, access to common goods and behavioral intentions that do not vary together in this sample.
Two of the three reverse items, R4 and R10, are among those that did not covary with their dimension or reach a sufficient loading. Scales with items worded in both directions require more careful reading, and some people respond inconsistently to the positive and negative items of the same dimension (Steinmann et al., 2022); detecting these inconsistent responses can appreciably reduce wording effects (García-Batista et al., 2021). Finally, response quality must be reviewed before the final analysis, because in small samples careless response patterns can distort correlations (Ward and Meade, 2023).
CONCLUSIONS
The study met its objective within the scope allowed by a preliminary data cut of 20 cases. In its pilot survey, the scale of presence of tourism, living conditions and rootedness of the FZ-HAB-0021 project showed acceptable internal consistency for Rootedness in the locality (α = .763; ω = .786) and low internal consistency for Presence of tourism (α = .355) and Living conditions (α = .277). The exploratory factor analysis, with insufficient sampling adequacy (KMO = .325), suggested two factors: one of rootedness and another bipolar one that opposes the presence of real estate and commercial tourism to housing affordability and the sufficiency of services. The only relationship between dimensions with an interval that excludes zero was the positive association between Living conditions and Rootedness. The results do not yet provide evidence of structural validity, but they identify a promising dimension and guide the revision of the other two.
The limitations are substantial. The sample of 20 cases, against a target of 100, with 1.3 cases per item, makes the statistics and the factor solution unstable; the survey was still open and most of those who started the questionnaire did not complete it. The dataset does not distinguish between Teacapán and Chametla, so it is not possible to know how many cases each locality contributes or to examine differences between them. No information is available on the selection procedure, occupation, length of residence or housing tenure of the respondents, variables that the literature on gentrification considers central. The cross-sectional design prevents establishing dependency relationships, and no confirmatory factor analysis was performed.
These results lead to decisions for the authors. The first is to record the locality of residence in the questionnaire, so that Teacapán and Chametla can be analyzed separately or compared. The second is to review the Presence of tourism dimension, in particular R1 and R4, and to assess whether the perception of tourist influx should be separated from the perception of the real estate market. The third is to review R9 and R10 in Living conditions and to assess whether access to common goods and the intention to emigrate constitute facets of their own. The fourth is to examine, with the final data cut, whether the second bipolar factor holds. None of these decisions was taken in the present analysis, which retains the fifteen original items.
As future lines of work, we propose completing the survey up to the planned target, repeating the exploratory factor analysis with the final data cut, and then evaluating the resulting structure by means of confirmatory factor analysis in an independent sample. The measurement could be complemented with documentary indicators on the land market, the supply of tourist accommodation and access to beaches, as well as with interviews with key informants, in order to contrast the population's perception with the transformations recorded. An instrument with documented validity evidence would make it possible to monitor the habitability of the localities of southern Sinaloa in the face of the advance of tourism and to provide information for governance that protects rootedness and the population's access to its territory.
References
- 1 Bartlett, M. S. (1950). Tests of significance in factor analysis. British Journal of Statistical Psychology, 3(2), 77–85. https://doi.org/10.1111/j.2044-8317.1950.tb00285.x
- 2 Bojorquez Luque, J., Olivarría Núñez, C. A., y Sánchez Sánchez, E. (2023). Producción del espacio turístico vertical y tensiones sociales en Mazatlán (México). Ateliê Geográfico, 17(3), 45–64. https://doi.org/10.5216/ag.v17i3.75540
- 3 Bojórquez Luque, J., y Osuna Covarrubias, J. E. (2025). Turismo y destrucción creativa en Mazatlán, México. La zona de Playa Norte (2009-2024). Bitácora Urbano Territorial, 35(1), 30–45. https://doi.org/10.15446/bitacora.v35n1.117255
- 4 Bonett, D. G., y Wright, T. A. (2000). Sample size requirements for estimating Pearson, Kendall and Spearman correlations. Psychometrika, 65(1), 23–28. https://doi.org/10.1007/BF02294183
- 5 Cervantes-Escobar, A., y Ruiz-Luna, A. (2024). Identification and participatory mapping of ecosystem services in Marismas Nacionales Sinaloa, Mexico. Acta Universitaria, 34, 1–24. https://doi.org/10.15174/au.2024.4247
- 6 Cronbach, L. J. (1951). Coefficient alpha and the internal structure of tests. Psychometrika, 16(3), 297–334. https://doi.org/10.1007/BF02310555
- 7 Ferrando, P. J., Lorenzo-Seva, U., Hernández-Dorado, A., y Muñiz, J. (2022). Decalogue for the factor analysis of test items. Psicothema, 34(1), 7–17. https://doi.org/10.7334/psicothema2021.456
- 8 Fondo Nacional de Fomento al Turismo. (s. f.). Libro blanco: CIP Costa Pacífico (Playa Espíritu). FONATUR. Recuperado el 9 de octubre de 2026, de http://www.fonatur.gob.mx/gobmx/transparencia/LibrosBlancos/5%20CIP%20Costa%20Pac%C3%ADfico%20Playa%20Espiritu.pdf
- 9 García-Batista, Z. E., Guerra-Peña, K., Garrido, L. E., Cantisano-Guzmán, L. M., Moretti, L., Cano-Vindel, A., Arias, V. B., y Medrano, L. A. (2021). Using constrained factor mixture analysis to validate mixed-worded psychological scales: The case of the Rosenberg Self-Esteem Scale in the Dominican Republic. Frontiers in Psychology, 12, Artículo 636693. https://doi.org/10.3389/fpsyg.2021.636693
- 10 García-Macías, P., y Leyva-Iturrios, M. (2026). Residential tourism, real estate urbanization, and socio-ecological fragility: Rethinking resilience in Isla Cortés, México. Sustainability, 18(10), Artículo 5109. https://doi.org/10.3390/su18105109
- 11 Goretzko, D., Pham, T. T. H., y Bühner, M. (2021). Exploratory factor analysis: Current use, methodological developments and recommendations for good practice. Current Psychology, 40(7), 3510–3521. https://doi.org/10.1007/s12144-019-00300-2
- 12 Harris, C. R., Millman, K. J., van der Walt, S. J., Gommers, R., Virtanen, P., Cournapeau, D., Wieser, E., Taylor, J., Berg, S., Smith, N. J., Kern, R., Picus, M., Hoyer, S., van Kerkwijk, M. H., Brett, M., Haldane, A., Fernández del Río, J., Wiebe, M., Peterson, P., . . . Oliphant, T. E. (2020). Array programming with NumPy. Nature, 585(7825), 357–362. https://doi.org/10.1038/s41586-020-2649-2
- 13 Hernández Flores, J. Á. (2023). El rol gentrificador del Programa Pueblos Mágicos. El caso de San Pedro y San Andrés Cholula, Puebla. Estudios Demográficos y Urbanos, 38(3), 715–761. https://doi.org/10.24201/edu.v38i3.2134
- 14 Horn, J. L. (1965). A rationale and test for the number of factors in factor analysis. Psychometrika, 30(2), 179–185. https://doi.org/10.1007/BF02289447
- 15 Kaiser, H. F. (1974). An index of factorial simplicity. Psychometrika, 39(1), 31–36. https://doi.org/10.1007/BF02291575
- 16 Kamani Fard, A., y Paydar, M. (2024). Place attachment and related aspects in the urban setting. Urban Science, 8(3), Artículo 135. https://doi.org/10.3390/urbansci8030135
- 17 Lin, B., Lee, W., y Wang, Q. (2023). Residents’ perceptions of tourism gentrification in traditional industrial areas using Q methodology. Sustainability, 15(22), Artículo 15694. https://doi.org/10.3390/su152215694
- 18 Lorenzo-Seva, U., y Ferrando, P. J. (2021). MSA: The forgotten index for identifying inappropriate items before computing exploratory item factor analysis. Methodology, 17(4), 296–306. https://doi.org/10.5964/meth.7185
- 19 Malkewitz, C. P., Schwall, P., Meesters, C., y Hardt, J. (2023). Estimating reliability: A comparison of Cronbach’s α, McDonald’s ωt and the greatest lower bound. Social Sciences & Humanities Open, 7(1), Artículo 100368. https://doi.org/10.1016/j.ssaho.2022.100368
- 20 McDonald, R. P. (2013). Test theory: A unified treatment. Psychology Press. https://doi.org/10.4324/9781410601087 (Obra original publicada en 1999)
- 21 Mendieta Vega, R. A., y Roldán Clarà, B. (2024). Turistificación y gentrificación turística en la ciudad de Mazatlán: impactos socioculturales del modelo de desarrollo turístico neoliberal. LATAM Revista Latinoamericana de Ciencias Sociales y Humanidades, 5(1), 1592–1610. https://doi.org/10.56712/latam.v5i1.1695
- 22 Nikšić Radić, M., y Dragičević, D. (2025). Integrative review on tourism gentrification and lifestyle migration: Pathways towards regenerative tourism. Sustainability, 17(11), Artículo 5163. https://doi.org/10.3390/su17115163
- 23 Python Software Foundation. (2026). Python (Versión 3.13.16) [Software]. https://www.python.org/
- 24 Quang, T. D., Nguyen, Q. X. T., Nguyen, H. V., Dang, V. Q., y Tang, N. T. (2023). Toward sustainable community-based tourism development: Perspectives from local people in Nhon Ly coastal community, Binh Dinh province, Vietnam. PLOS ONE, 18(10), Artículo e0287522. https://doi.org/10.1371/journal.pone.0287522
- 25 Steinmann, I., Strietholt, R., y Braeken, J. (2022). A constrained factor mixture analysis model for consistent and inconsistent respondents to mixed-worded scales. Psychological Methods, 27(4), 667–702. https://doi.org/10.1037/met0000392
- 26 Virtanen, P., Gommers, R., Oliphant, T. E., Haberland, M., Reddy, T., Cournapeau, D., Burovski, E., Peterson, P., Weckesser, W., Bright, J., van der Walt, S. J., Brett, M., Wilson, J., Millman, K. J., Mayorov, N., Nelson, A. R. J., Jones, E., Kern, R., Larson, E., . . . Vázquez-Baeza, Y. (2020). SciPy 1.0: Fundamental algorithms for scientific computing in Python. Nature Methods, 17(3), 261–272. https://doi.org/10.1038/s41592-019-0686-2
- 27 Wang, B., He, S., Min, Q., Cui, F., y Wang, G. (2021). Influence of residents’ perception of tourism’s impact on supporting tourism development in a GIAHS site: The mediating role of perceived justice and community identity. Land, 10(10), Artículo 998. https://doi.org/10.3390/land10100998
- 28 Ward, M. K., y Meade, A. W. (2023). Dealing with careless responding in survey data: Prevention, identification, and recommended best practices. Annual Review of Psychology, 74, 577–596. https://doi.org/10.1146/annurev-psych-040422-045007
- 29 Xing, B. (2026).¿Cómo pasan los conflictos a la cocreación? Estudio sobre la lógica evolutiva de las emociones y acciones de los residentes en destinos de turismo patrimonial: el caso de la ciudad antigua de Pingya]. Advances in Social Sciences, 15(3), 602–615. https://doi.org/10.12677/ass.2026.153265
Declarations
Funding
The authors received no funding for the development of this research.
Conflict of interest
The authors declare that there is no conflict of interest.
Authorship contributions
Conceptualization: Alejandra Berenice Aguilar Galindo
Data curation: Pedro Antonio Valdez Lizárraga
Formal analysis: Víctor Manuel Martínez García
Investigation: Alejandra Berenice Aguilar Galindo
Methodology: Yennifer Díaz Romero
Project administration: Pedro Antonio Valdez Lizárraga
Software: Pedro Antonio Valdez Lizárraga
Supervision: Víctor Manuel Martínez García
Validation: Víctor Manuel Martínez García
Visualization: Yennifer Díaz Romero
Writing – original draft: Alejandra Berenice Aguilar Galindo
Writing – review and editing: Yennifer Díaz Romero