

Abstract
Introduction: At present they yield different mathematical models to describe the evolution of the epidemic of the Coronavirus, however the realized predictions do not characterize themselves for the desired precisions, and at times, they had been applied models of continuous, probabilistic processes, still when we know that they have an operation with data, which represent a discontinuous phenomenon of behavior (of finite leaps), aspect that affects the approximations of the real development of the epidemic of the new Coronavirus. Aims to: they develop a mathematical algorithm for the prediction of the epidemic of the Covid-19 through mathematical quantitative and qualitative models in compliance with humanity's needs according to the evolution of the paradigms. Methods: Theoretical methods are used: analysis and synthesis, induction and deduction, abstraction and concretion, and the logical historical method. Revision of reports of studies. Construction of function curves and their reasons for change. Mathematical methods, procedures and algorithms are applied, as well as the focuses of the clinical and epidemiologic methods. Results: The empirical methods applied are framed mainly in the observation of the records of the experimental data, the bibliographic review, in order to deepen the problem and obtain information on the main difficulties that affect the research process, and the published reports, from of the search for methods and procedures. The document review method is used, through books, and articles referring to the topic epimics evolution about experimental and statistics data in the Scielo, DOAJ, Latindex, Google Scholar Databases, Elsevier, among others. A method of work is designed, which makes easy the analysis of the quantitative real registered data to characterize the evolution of the epidemics. The May 6, 2021 is illustrated by means of the yielded information in Israel, as from the December 14, 2020. Conclusions: An alternative constitutes the mathematical designed algorithm that it assures the tracking and the control of the epidemics, as well as the performance of the data recollected to understand, explaining and interpreting essential features, from the topologic point of view, which represent the global tendencies of growth, decrease, and the cycle of epidemic attenuation.
Keywords
method, epidemics, quantitative and qualitative mathematical models, prediction, covid-19
INTRODUCTION
At present they yield different mathematical models to describe the evolution of the epidemic of the Coronavirus, however the realized predictions do not characterize themselves for the desired precisions, and at times, they had been applied models of continuous, probabilistic processes, still when we know that they have an operation with data, which represent a discontinuous phenomenon of behavior (of finite leaps), aspect th at affects the approximations of the real development of the epidemic of the Covid-19.(1, 2, 3, 4, 5, 6, 7, 8, 9, 10, 1 1 , 12, 13, 14, 15, 16, 17, 18, 19, 20)
Disease transmission is represented through mathematical models defined by differential equations.( 8, 13,15, 17, 18 , 19, 20, 21, 22, 23, 24, 25, 26) Thus, linear and non-linear correlation models have been widely referenced by different authors, who have applied them in various fields of knowledge. For example,( 27, 28, 29, 30, 31, 32, 33, 34, 35, 36) make use of non-linear models such as of the Brody, Von Bertalanffy, Richards, logistic and Gompertz models, called fixed effects models.
Thus, other authors propose and analyze six types of logistic and growth models to approximate the data on the distribution of COVID-19, while proposing a clear answer to the possible advantages of some considerations. They investigate intrinsic properties of growth models with transfer of polynomial variables, which provide an accurate approximation of the specific data on the pandemic.
These models are used in the treatment of questions in different fields of scientific knowledge, based on numerical data in a mathematical model to calculate the cases. (34, 37, 38, 39, 40, 41, 42, 43, 44, 45, 46, 47, 48, 49, 50) However, the results published in consideration of the author do not specify, and predict the results as expected at the present time to control the evolution of the epidemic, subject to measures that minimize growth, which is observed in almost all recent publications, without actually representing the speed of spread of the epidemic, as an essential element in their development.
In countries such as Cuba, the rate of change in the percentages of daily illnesses from Covid-19 with respect to time is exceeded (speed of spread of the epidemic), so that in the months of July and August 2021 there have been registered percentages of patients by the Covid-19 records, facts that move the country.
It is defined as a scientific problem: how do we develop a mathematical algorithm for the prediction of the epidemic of the Covid-19 through mathematical quantitative and qualitative models in compliance with humanity's needs? It aims to: they develop mathematical algorithm for the prediction of the epidemic of the Covid-19 through mathematical quantitative and qualitative models in compliance with humanity's needs according to the evolution of the paradigms.
MATERIALS AND METHODS
Theoretical methods are used: analysis and synthesis, induction and deduction, abstraction and concretion, and the logical historical method. Construction of function curves and their reasons for change. Mathematical methods, procedures and algorithms are applied, as well as the focuses of the clinical and epidemiologic methods.
A methodology is designed to ensure the processes of understanding, explanation and interpretation in the analysis of experimental data, to guarantee the reliability and veracity of the study.
The empirical methods applied are framed mainly in the observation of the records of the experimental data, the bibliographic review, in order to deepen the problem and obtain information on the main difficulties that affect the research process, and the published reports, from of the search for methods and procedures.
The document review method is used, through books, and articles referring to the topic epimics evolution about experimental and statistics data in the Scielo, DOAJ, Latindex, Google Scholar Databases, Elsevier, among others.( 51)
RESULTS
The origin of the design of the work method proposed by the author of this article arises from his doctoral thesis, as well as reports of publications before, and after the final report of this study was concluded in June 2019. In this way, an algorithm is proposed mathematical associated with the evolution of epidemics. A computer program (Excel) is used that facilitates the calculations and graphs the information collected:
Step 1. The daily information of the patients diagnosed with the disease (Covid-19) is collected in the first column.
Step 2. The percentage with respect to the total mean population of the area or geographic zone is calculated in the second column.
Step 3. The percentage of patients accumulated daily is calculated, medical discharges and daily deaths are subtracted from the third column.
Step 4. The daily rate of change of the percentage of diagnosed patients is calculated, as the difference of two consecutive percentages, divided by the minimum unit of time; constitutes an approximation to the speed of propagation of the epidemic, in the fourth column.
Step 5. The daily rate of change of the accumulated patients is calculated by the difference of the consecutive percentages (numerator) and divided by the minimum unit of time; constitutes an approximation to the speed of spread of the epidemic, in the fifth column.
Step 6. The graphs of the percentage of daily patients, and the percentage of accumulated patients, and their corresponding rates of change, are constructed from the data in the columns corresponding to the second, third, fourth, and fifth columns.
Step 7. The intervals of increasing and decreasing trend of the percentages are indicated; that is to say, the global trends of the percentage of patients (accumulated), and of the rate of change of the corresponding percentage of patients.
Step 8. The global trends of the evolution of the epidemic in general are deduced.
Step 9. Changes in the evolution of the epidemic are predicted, as well as its possible causes, effects, controlled and uncontrolled effective measures.
The mathematical algorithm designed to detail the evolution of the Covid-19 epidemic in Israel is applied, from December 14, 2020 to May 6, 2021; according to the information collected, through real data extracted from the Internet.( 51)
DISCUSSION
The following illustrates the monitoring of the evolution of the Covid-19 epidemic in Israel, from December 14, 2020 to May 6, 2021.
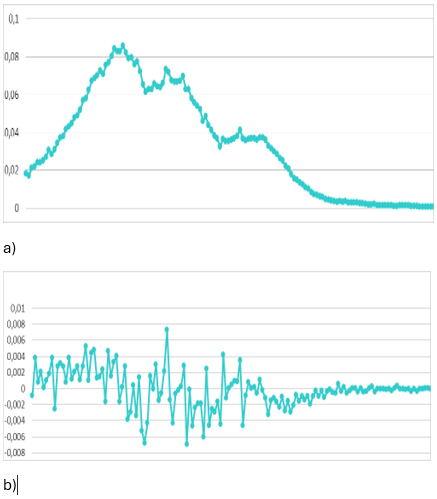
Figure 1. Polygonal line of daily percentages of sick persons for Covid-19 (y axis) and the time measured in days (horizontal axle) and the polygonal line of the reason of change daily permanent percentages for sick persons for Covid-19 (y axis) and the time measured in days (horizontal axle).
A mathematical model that describes the population evolution happening very different health situations by nature is examined. Which may apply him with respect to Coronavirus' evolution (Covid-19).
Changes are observed in the daily percentages, and in the rates of change of the daily percentages in polygonal A, and B respectively in figure 1, however it is necessary to identify the global trends of increasing and decreasing monotony; a relative maximum is reached, this first interval with an increasing global trend, corresponding to it the ratios of positive changes, different from zero.
Then a second interval with a decreasing global trend with negative rates of change, different from zero.
These cycles can be repeated several times. Until the general trend of the rate of change of the daily percentages is negative and positive, but decreases; and finally, for long periods of time, an approach to zero begins due to positive values, and negative values suddenly, which indicates the decrease in the percentages of daily patients, verified in polygonal A of figure 1, or vice versa, it is defined as an attenuation cycle epidemic.
As the behavior of the percentages of daily patients, and their rates of change are close (approximate) to zero, it is concluded that the control measures applied to reduce the epidemic in Israel until May 2021 are effective, otherwise it is necessary to continue the recording of daily information, reaffirming measures, for example in the case of Cuba.( 52)
As a result of applying the elaborated algorithm, the following graphs are obtained, represented in figure 2: Traverse A and B.
The accumulated data are added during 14 consecutive days, there are no contradictions between the daily percentages in figure 1, and the accumulated percentages in figure 2.
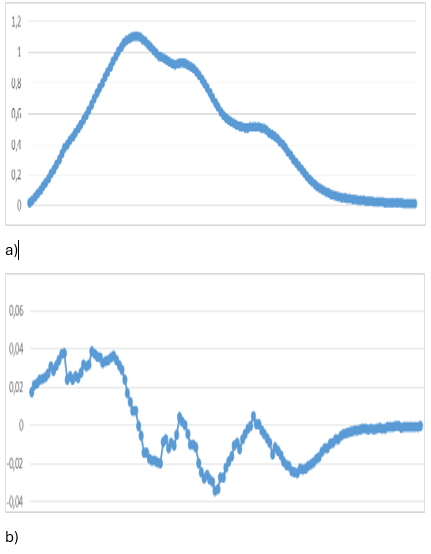
Figure 2. Polygonal line of daily percentages of sick persons for Covid-19 (y axis) and the time measured in days (horizontal axle) and the polygonal line of the reason of change daily permanent percentages for sick persons for Covid-19 (y axis) and the time measured in days (horizontal axle).
The results of the real collected data represented are verified to clarify, specify, and demonstrate the global trends associated with the behavior of the evolution of the Covid-19 epidemic in Israel in the months of December 2020 to May 2021.
Changes are observed in the percentages of accumulated daily patients, and in the rates of change in the daily percentages corresponding to polygonal A, and B respectively in Figure 2, however it is necessary to identify the global increasing and decreasing trends; a relative maximum is reached, this first interval with an increasing trend, corresponding to the ratios of positive changes, different from zero.
A second interval with a decreasing global trend with negative rates of change, different from zero.
These cycles can be repeated several times. Until the general trend of the rate of change of the daily percentages is negative and positive; decreases for prolonged times, begins to approach zero due to positive and negative values, suddenly, which indicates the decrease in the percentages of daily patients, verified in polygonal A of figure 2, or vice versa, the attenuation cycle is identified epidemic. After an uncontrollable sprout, again in this month of August 2021, the global increasing tendency in Israel is identified, which indicates that the vigilance of the evolution of the epidemic has to be for ever.
As the behavior of the accumulated daily sickness percentages, and their corresponding change ratios are close (approximate) to zero, it is concluded that the control measures applied to reduce the epidemic in Israel until May 2021 are effective, otherwise it is It is necessary to continue recording daily information, reaffirm measures, and include others.
When comparing the graphs associated with the behavior of the epidemic, a topological equivalence is verified in figures 1 and 2.
For example, in the case of Cuba, publications are reported.( 52) In figure 6, in which it is deduced that the epidemic at 100 days is reduced, according to the theoretical (quadratic) curves of the model used; however this prediction was not correct.
There is no correspondence by comparison between the polygonal lines of figures 1 and 2, which are obtained from the application of the algorithm proposed in this work, and the curves recently reported by different mathematical models to represent the evolution of the epidemic,( 53, 54) from the following aspects: clarity, precision, and prediction,
In the case of mathematical models applied in Colombia,( 53) the data is interpreted on the basis of the first cycle of increasing global trend. Figure 1 of this article presents a point cloud of the accumulated data model. from day one to day 44, that is, the evolution of the epidemic, has not yet lasted in time, and practice has determined much longer and more diverse cycles, in the case of the Covid-19 epidemic.
It is concluded that the collected data have a quadratic behavior; However, it does not correspond to the reality of the epidemic evolution in Colombia, that is to say, if the data used in the research are random, the sample studied has the required size, thus for only pointing out aspects that influence the credibility of the results achieved in this study; however, it leaves aspects of considerable value, but too hasty.
In the report published by the authors of Plovdiv University,( 54) which carries out a study analogous to the report developed in the research,( 52) the first cycle of increasing global trend is identified in the model, starting at 51 days monitoring the evolution of the epidemic in Cuba from March to May 2020. It follows that the evolution of the epidemic in Cuba must be analyzed in longer periods of time, as it has actually happened.
It is recommended to compare the results of the application of the mathematical algorithm designed in this study report, which synthesizes the analysis, and the presentation of Figures 1 and 2 to characterize the evolution of the epidemic in Israel, compare with reports made by The author of this work, among others, according to the similarity of the graphs in their topological forms, when different biomedical phenomena of different nature are studied, and specifically the evolution of the dengue epidemic in Holguín.(9, 11, 55, 56, 57, 58, 59) As well as the similarity and coincidence of the characteristics of the graphs of the elementary real functions of classical Mathematical Analysis, and the topological forms of the polygonal A and B of figures 1, and 2.
The transformation of the evolution of the Covid-19 epidemic is predictable in the coming months, from the complex current health situation in Cuba, according to the percentages of Covid-19 patients registered in August 2021, with evidence of a growing global trend, from the mass vaccination process, strict compliance, and aware of rectified control measures; as well as new measures.
CONCLUSIONS
They developed mathematical algorithm for the prediction of the epidemic of the Covid-19 through mathematical quantitative and qualitative models in compliance with humanity's needs according to the evolution of the paradigms.
An alternative constitutes the mathematical designed algorithm that it assures the tracking and the control of the epidemics, as well as the performance of the data recollected to understand, explaining and interpreting essential features, from the topologic point of view, which represent the global tendencies of growth, decrease, and the cycle of epidemic attenuation.
References
- 1 Trainini J C. Towards the need for a new medical paradigm. Argentine Magazine. 2003 [cited 2025 Dec 28]; 71 (6) 439-445. Available at:
- 2 https://www.sac.org.ar/consensos/cardiologia-clinica/
- 3 Dossey L. Time, Space and Medicine. Barcelona: Ed. Kaidos. 2016 [cited Dec 15, 2025]; p.33. Available at: http://editorialkairos.com/catalogo/tiempo-espacio-y-medicina
- 4 Capra F. The Tao of Physics. Madrid: Luis Cármano Ed; 2016 [cited 2025 Dec 17]; p.65. Available at: https://www.iberlibro.com/buscar-libro/titulo/el-tao-de-la-fisica/autor/capra-fritjof/
- 5 Bunque M. Science. His method and his philosophy. Buenos Aires: Ed. Sudamericana. 2001 [cited Dec 17 2019]; p.1-193. Available at:
- 6 https://losapuntesdefilosofia.files.wordpress.com/2017/11/bunge_ciencia.pdf
- 7 Engel G. L. The need a new medical models. A chanllege for biomedicine. Science. 1977 [cited 2025 Nov 6]; 196: 129-36.
- 8 Available at: https://www.ncbi.nlm.nih.gov/pubmed/84746
- 9 Sametband M J. Between order and chaos. The complexity. Buenos Aires: Economic Culture Fund. 1994 [cited 2025 Dec 12]; p.33. Available at: https://articulo.mercadolibre.com.ar/MLA-788562244-entre-el-orden-y-el-caos-la-complejidad-m-j-sametband-_JM
- 10 LeShan L. The Medium, the Mystic, and the Physicist. New York: Viking Ed. 2012 [cited 2025 Dec 8]; p.85. Available at:
- 11 https://archive.org/details/mediummystica00lesh/page/n1
- 12 Barnett R, Ziegler M, and Byleen K. L. Applied Calculus for business and economics, life sciences, and social sciences, 13th Edition. San Francisco, California, United States of America, Dellen Macmillan. 2015 [cited 2025 Dec 16]; [approx. 670p.]. Available at: https://www.pearson.com/us/higher-education/product/Barnett-Calculus-for-Business-Economics-Life-Sciences-and-Social-Sciences-13th-Edition/9780321869838.html
- 13 Escalona L A. Construction and interpretation of curves of elementary functions and the resolution of optimization problems to solve professional medical problems. Thesis as an option to the scientific degree of Doctor of Pedagogical Sciences, University of Holguín. Cuba. 2019 [cited 2026 Jan 10]; [approx. 216p.]. Available at: http://tesis.sld.cu/index.php?P=Hom
- 14 Guyton A C. Treatise on Medical Physiology II. 2016 [cited 2025 Dec 21]. Available at: https://www.elsevier.com/__data/assets/pdf_file/0005/604427/Folleto_Ciencias_Basicas_Clinicas.pdf
- 15 Escalona L, Castro N, Castellanos L, Palacio G, and Terán M. Modeling, evolution and development of the dengue epidemic. Holguin. July to September, 2015. Journal of University Pedagogy, Cuba. 2017 [cited 2025 Nov 6]; XXII (1). Available at: http://www.cvi.mes.edu/peduniv/index.php/peduniv/view[23íritu23
- 16 Escalona L and Pérez S. Didactic alternative to stimulate the creative thinking of teachers and students. Camagüey Medical Archive Magazine, Cuba. 2019 [cited 2025 Dec 27]; 23 (1) 75-84. Available at: http://www.revistaamc.sld.cu/index.php/amc/article/view/6113
- 17 Lombardero A. A look at Biomathematics. Magazine Numbers. 2014 [cited 2026 Feb 21]; 86 (July / 2019), 29-38. Available at: http://www.sinewton.org/numeros/numeros/86/Articulos_02.pdf
- 18 Torres N. Chaos in biological systems. University of La Laguna. 2016 [cited 2025 Dec 27]; [approx. 20p.]. Available at: http://webpages.ull.es/users/sympbst/
- 19 Stewart, I. The 17 mathematical equations that changed the world. Editorial
- 20 Robert Laffont, 2016 [cited May 15 2026]; [approx. 366p.]. Available at:
- 21 http://www.librosmaravillosos.com/17ecuacionesquecambiaronelmundo/pdf/17%20ecuaciones%20que%20cambiaron%20el%20mundo%20-20Ian%20Stewart.pdf
- 22 Antúnez J C. and Madrid. C. Mathematics, chaos and medicine: A very productive ménage à Trois. Complutense University of Madrid. 2016 [cited 2025 Dec 27]; [approx.7p.]. Available at: http://www.encuentros-multidisciplinares.org/Revistan%C2%BA34/Jose%20Carlos%20Antoranz%20y%20Carlos%20Madrid.pdf
- 23 Chen T, Rui J, Wang Q. et al. A mathematical model for simulating the phase-based
- 24 transmissibility of a novel coronavirus. Infect Dis Poverty [Internet]. 2020 Jan [cited Feb
- 25 ]; 9(24). Available at: https://doi.org/10.1186/s40249-020-00640-3..
- 26 Velasco Hernández JX. Modelos matemáticos en epidemiología: enfoques y alcances. Miscelánea Matemática [Internet]. 2007 [citado Feb 2026]; 44 11–27 SMM Disponible en: http://www.matcuer.unam.mx/~max/Misc44/Velazco_j.pdf
- 27 Qiangyng L, Zhao S, Gao D, Lou Y, Yang S, Musa S, et AL. A conceptual model for the coronavirus disease 2019 (COVID-19) outbreak in Wuhan, China with individual
- 28 reaction and governmental action. International Journal of Infectious Diseases [Internet]. 2020 Apr [cited Apr 2026]; 23:211-6. Available at: https://www.ijidonline.com/article/S1201-9712(20)30117-X/fulltext .
- 29 Delamater PL, Street EJ, Leslie TF, Yang Y, Jacobsen KH. Complexity of the Basic
- 30 Reproduction Number (R0). Emerg Infect Dis [Internet]. 2019; [cited Feb 2026];
- 31 (1):1-4. Available from: https://dx.doi.org/10.3201/eid2501.171901
- 32 Galindo Uribarri S, Rodríguez Meza MA, Cervantes Cota JL. Las matemáticas de las
- 33 epidemias: caso México 2009 y otros. Espacio del Divulgador [Internet]. 2009; [cited
- 34 Feb 2026]; Available at: https://www.redalyc.org/pdf/104/10428759009.pdf
- 35 Gutiérrez JM, Varona JL. Análisis del Covid-19 por medio de un modelo SEIR. Blog del Instituto de Matemáticas de la Universidad de Sevilla [Internet]. 2020 Mar [cited Abr
- 36 ]; Available at: https://institucional.us.es/blogimus/2020/03/covid-19-analisis-
- 37 por-medio-de-un-modelo-seir/.
- 38 López-Cruz R. Structured SI Epidemic Models with Applications to HIV Epidemic[Internet]. EEUU: Arizona State University; 2006 [cited Feb 2026]. p. 27-46. Available at: https://math.la.asu.edu/~kuang/paper/Roxana.pdf
- 39 Kim KH.COVID-19. Int Neurourol J. 2020; 24(1):1-1.
- 40 Wu YCh, Chen ChS, Chan YJ. The outbreak of COVID-19: An overview. J Chin Med Assoc. 2020;83(3):217-220.
- 41 Ministerio de Salud y Protección Social. Prevención enfermedades transmisibles CORONAVIRUS (COVID-19) ¿A quiénes afecta y cuáles son sus síntomas? Colombia: Ministerio de Salud y Protección Social; 2020.
- 42 Malhado C, Ramos A, Carneiro P, Souza J, Wechsler F, Eler J. Modelos no lineales para describir el crecimiento de bufalinos de la raza Murrah. Archivos de zootecnia. 2008;57(220):497-503.
- 43 Noguera R, Pereira R y Solarte C. Comparación de modelos no lineales para describir curvas de crecimiento en cuyes (Cavia porcellus) desde el nacimiento hasta la edad de sacrificio. Livestock Research for Rural Development. 2008; 20(5):1-9.
- 44 Galeano V, Cerón M. Modelación del crecimiento de pollitas Lohmann LSL con redes neuronales y modelos de regresión no lineal. Revista MVZ Córdoba. 2013; 18(13):3861-7.
- 45 Domínguez V, Ortega G, Rodríguez A, Aguilar P, Santillán M, Callejas J. Ajuste de modelos no lineales para caracterizar el crecimiento de bovinos Hereford y Salers. Revista Científica. 2014;24(5):436-2.
- 46 Parés C, Pere M, Kucherova I. Comparación de modelos no lineales para describir curvas de crecimiento en la cabra catalana. Revista de Investigaciones Veterinarias del Perú. 2014;25(3):390-8.
- 47 Torres V, Barbosa I, Meyer R, Noda A, Sarduy L. Criterios de bondad de ajuste en la selección de modelos no lineales en la descripción de comportamientos biológicos. Revista Cubana de Ciencia Agrícola. 2012;46(4):345-50.
- 48 Tomás J, Rodrigo M, Oliver A. Modelos lineales y no lineales en la explicación de la siniestralidad laboral. Psicothema. 2005;7(1):154-63.
- 49 Medina Mendieta JF, Cortés Cortés ME, Cortés Iglesias M. Ajuste de curvas de crecimiento poblacional aplicadas a la COVID-19 en Cuba. Rev haban cienc méd [Internet]. 2020 [cited 04/04/2026];19(Supl.):e3353. Available at: https://www.revhabanera.sld.cu/index.php/rhab/article/view/3353
- 50 Kyurkchiev N, Iliev A, Rahnev A. On the Half-Logistic Model with ”polynomial variable transfer”. Application to approximate the specific ”data CORONA VIRUS”. International Journal of Differential Equations and Applications [Internet]. 2020 [cited 04/04/2026];19(1):45–61. Available at: https://www.researchgate.net/publication/340443868_On_the_Half-logistic_Model_with_Polynomial_Variable_TransferApplication_to_Approximate_the_Specific_Data_Corona_Virus
- 51 Kyurkchiev N, Iliev A, Rahnev A. A Look at the New Logistic Models with ”Polynomial Variable Transfer” [Internet]. Alemania: LAP LAMBERT Academic Publishing; 2020 [cited 04/04/2026]. Available at: https://www.researchgate.net/publication/341868069_A_Look_at_the_New_Logistic_Models_with_Polynomial_Variable_Transfer4. Cordeiro G, Alizadeh M, Ortega E. The exponentiated Half–Logistic Family of Distributions: Properties and Applications. J Prob Stat [Internet]. 2014 [cited 04/04/2026]; 28:21. Available at: https://www.academia.edu/11421814/The_exponentiated_half-logistic_family_of_distributions_properties_and_applications
- 52 Yang Z, Zeng Z, Wang K, Wong SS, Liang W, Zanin M, et al. Modified SEIR and AI prediction of the epidemics trend of COVID-19 in China under public health interventions. J Thorac Dis. 2020;12(3):165.
- 53 Cagigal MAG, Becario FPU. Modelado y análisis de la evolución de una epidemia vírica mediante filtros de Kalman: el caso de la COVID-19 en España. En: Depósito de investigación de la Universidad de Sevilla [Internet]. España: Universidad de Sevilla; 2020 [cited 13/05/2026]. Available from: https://idus.us.es/bitstream/handle/11441/94508/A
- 54 nalisis%20de%20la%20evolucion%20del%20COVID-
- 55 %20con%20Filtros%20de%20Kalman%20v1%20%2801-04-2020%29.pdf?sequence=7&isAllowed=yLoguarde pdf
- 56 Simón Mínguez F. Procesos de difusión Logístico y Gompertz. Métodos numéricos clásicos en la estimación paramétrica [Tesis de maestría]. España: Universidad de Granada; 2016 [cited 13/05/2026]. Available at: https://masteres.ugr.es/moea/pages/curso201516/tfm1516/simon_minguez_tfm/4. Jia L, Li K, Jiang Y, Guo X. Prediction and analysis of Coronavirus Disease 2019 [Internet]. Nueva York: ArXiv; 2020 [cited 13/05/2026]. Available from: https://arxiv.org/abs/2003.05447
- 57 Yang W, Zhang D, Peng L, Zhuge C, Hong L. Rational evaluation of various epidemic models based on the COVID-19 data of China [Internet]. Nueva York: ArXiv; 2020 [cited 13/05/2026]. Available from: http://arxiv.org/abs/2003.05666
- 58 Batista M. Estimation of the final size of the COVID-19 epidemic [Internet]. Estados Unidos: MedRxiv; 2020 [cited 13/05/2026]. Available at: https://www.medrxiv.org/content/10.1101/2020.02.16.20023606v5
- 59 Dattoli G, Di Palma E, Licciardi S, Sabia E. A Note on the Evolution of Covid-19 in Italy [Internet]. Nueva York: ArXiv; 2020 [cited 13/05/2026]. Disponible en: http://arxiv.org/abs/2003.086848. Remuzzi A, Remuzzi G. COVID-19 and Italy: what next?. The Lancet [Internet]. 2020 Abr [cited 13/05/2026];395:1225-8. Available at: https://www.thelancet.com/article/S0140-6736%2820%2930627-9/abstract
- 60 Qeadan F, Honda T, Gren LH, Dailey Provost J,Benson LS, Van Derslice JA, et al. Naive Forecast for COVID-19 in Utah Based on the South Korea and Italy Models-the Fluctuation between Two Extremes. Int J Environ Res Public Health [Internet]. 2020 [cited 13/05/2026];17(8):2750. Available at: https://www.ncbi.nlm.nih.gov/pubmed/32316165
- 61 Villalobos-Arias M. Estimation of population infected by Covid-19 using regression Generalized logistics and optimization heuristics [Internet]. Nueva York: ArXiv; 2020 [cited 13/05/2026]. Available from: https://arxiv.org/abs/2004.01207
- 62 Tátrai D, Várallyay Z. COVID-19 epidemic outcome predictions based on logistic fitting and estimation of its reliability [Internet]. Nueva York: ArXiv; 2020 [cited 13/05/2026]. Available at: https://arxiv.org/pdf/2003.14160
- 63 Seber GAF. Nonlinear Regression Models. En su: The Linear Model and Hypothesis: A General Unifying Theory. Cham [Internet]. Nueva York: Springer International Publishing; 2015 p.117-28 [cited 13/05/2026]. Available at: https://www.springer.com
- 64 Moamer S, Baghestani AR, PourhoseingholiMA, Maboudi AAK, Shahsavari S, Zali MR, et al. Application of the parametric regression model with the four-parameter log-logistic distribution for determining of the effecting factors on the survival rate of colorectal cancer patients in the presence of competing risks. Iran Red Crescent Med J [Internet]. 2017 [cited 13/05/2026];19(6):[aprox. 2 p.]. Available at: https://sites.kowsarpub.com/ircmj/articles/13185.html
- 65 Finney DJ. Bioassay and the practice of statistical inference. Int Stat Rev Int Stat [Internet]. 1979 [cited 13/05/2026];47(1):1-12. Available at: https://www.sciencedirect.com/science/article/pii/0169260796017257/
- 66 Kyurkchiev N, Iliev A. Extension of Gompertz- type Equation in Modern Science: 240 Anniversary of the birth of B. Gompertz. [Internet]. Deutschland: LAP LAMBERT Academic Publishing; 2018. [cited 13/05/2026]. Available at: https://www.researchgate.net/publication/327137112_Extension_of_Gompertz-type_Equation_in_Modern_Science_240_Anniversary_of_the_birth_of_B_Gompertz
- 67 Wais P. A review of Weibull functions in wind sector. Renew Sustain Energy Rev. 2017;70:1099-1107.
- 68 [Internet]. 2021 [cited 30/08/2026];47(1):1-12. Available at: https://www.google.com/search?q=Evoluci%C3%B3n+de+la+Covid+en+Isarael+2021&source=hp&ei=0gYtYd-cKYOMwbkPluyI4AY&iflsig=ALs-wAMAAAAAYS0U4jqrYn4wjTlCmeRD2zL0NNChyO7P&oq=Evoluci%C3%B3n+de+la+Covid+en+Isarael+2021&gs_lcp=Cgdnd3Mtd2l6EAMyCgghEBYQChAdEB46CAguEIAEEJMCOgUIABCABDoOCC4QgAQQsQMQxwEQ0QM6CwgAEIAEELEDEIMBOgUIABCxAzoICC4QsQMQgwE6CAguEIAEELEDOggIABCxAxCDAToECAAQQzoKCC4QsQMQgwEQQzoHCC4QsQMQQzoKCAAQsQMQgwEQQzoRCC4QgAQQsQMQgwEQxwEQ0QM6BAguEEM6BQguEIAEOgYIABAWEB46BQghEKABOgcIIRAKEKABOggIIRAWEB0QHlCCS1jzkgJgmKgCaABwAHgAgAGSBYgB7DCSAQwwLjI4LjcuMS4wLjGYAQCgAQE&sclient=gws-wiz&ved=0ahUKEwjfzfDqlNnyAhUDRjABHRY2AmwQ4dUDCAg&uact=5
- 69 Meció D, Bayolo G, Marrero A. Analysis of Mathematical Model with risk perception for the CoVid19. Results for Cuba. [Internet]. Revista Cubana de Informática Médica 2020:12(2) [cited 15/08/2026]. Available at: http://scielo.sld.cu/
- 70 Obando Bastidas JA, Peña Pita AP, Obando Vargas LN, Franco Montenegro A. Importancia de los modelos de regresión no
- 71 lineales en la interpretación de datos de la COVID-19 en Colombia. Rev haban cienc méd [Internet]. 2020 [cited 15/08/2026];19(Supl.):e_3309. Available at: http://www.revhabanera.sld.cu/index.php/rhab/article/view/3309
- 72 Kyurkchiev N, Illiev A, Rahnev A, Terzieva T. Another look at a good approximation of data for the distribution of COVID-19 in Cuba. Rev haban cienc méd [Internet]. 2020 [cited 15/08/2026]; 19(3):e3445. Available at: http://www.revhabanera.sld.cu/index.php/rhab/article/view/3445
- 73 Escalona LA, Castro NV, Proenza YC. Integration and systematization of biomedical and mathematical contents when training a practitioner. Revista Correo Científico Médico Holguín, 2020 Vol. 24 No (4). [cited 15/08/2026] Available at: http://www.revcocmed.sld.cu/index.php/cocmed
- 74 Ain QT, Shen J, Xu P, Qiang X, Kou Z. A co-evolution model that integrates both epidemiological and evolutionary dynamics. Sci Rep. 2024;14(1): [extensión de páginas desconocida]. DOI: 10.1038/s41598-023-30800-y [cited 15/08/226]
- 75 Lexmond AS, Nouwen CJA, Callan JP. Evolution of COVID-19 cases in selected low- and middle-income countries: past the herd immunity peak? Preprint. medRxiv. 2020. DOI: 10.1101/2020.09.26.20201814 [cited 15/08/226]
- 76 Yang J, Tang S, Lou J. A stochastic discrete-time co-evolution model and its application in simulating the impacts of behavior changes on the secondary and multiple outbreaks of the COVID-19 pandemic. Eur Phys J Plus. 2023;138:1086. DOI: 10.1140/epjp/s13360-023-04702-x [cited 15/08/226]
- 77 Zingano P, Zingano J, Silva A, Zingano C. Defining and computing reproduction numbers to monitor the outbreak of Covid-19 or other epidemics. Preprint. Preprints. 2021. DOI: 10.20944 [cited 15/08/226]
Declarations
Funding
The authors did not receive funding for the development of this research.
Conflict of interest
The authors declare that there is no conflict of interest.
Authorship contributions
Conceptualization: Luis Alberto Escalona Fernández.
Data curation: Luis Alberto Escalona Fernández. Eliseo López Rodríguez.
Formal analysis: Luis Alberto Escalona Fernández.
Research: Luis Alberto Escalona Fernández.
Methodology: Luis Alberto Escalona Fernández. Eliseo López Rodríguez.
Software: Luis Alberto Escalona Fernández. Eliseo López Rodríguez
Supervision: Luis Alberto Escalona Fernández. Eliseo López Rodríguez.
Validation: Luis Alberto Escalona Fernández.
Visualization: Luis Alberto Escalona Fernández.
Writing – original draft: Luis Alberto Escalona Fernández. Eliseo López Rodríguez.
Writing – review and editing: Luis Alberto Escalona Fernández.