

Abstract
Introduction: Bedside tests are recommended to detect peripheral arterial disease in people with diabetes, but medial arterial calcification can produce falsely normal results and their accuracy remains uncertain. Methods: Systematic review following PRISMA 2020. Scopus, PubMed, OpenAlex and Crossref were searched from 2018 to 2026 for diagnostic accuracy studies of the ankle-brachial index, the toe-brachial index and Doppler waveform analysis against a reference standard. Risk of bias was assessed with QUADAS-2 and results were synthesized narratively. Results: Fifteen studies were included (60 to 604 participants). Ankle-brachial index sensitivity ranged from 35% to 95% and specificity from 62% to 98%; in the largest prospective comparison sensitivity was 41% (95% CI 32-50) and specificity 84% (95% CI 79-89). Toe-brachial index sensitivity ranged from 55% to 100% and specificity from 57% to 92%. Doppler waveform analysis detected additional cases, with sensitivity between 63% and 100% in most studies. Conclusions: Bedside tests show high specificity but limited sensitivity for peripheral arterial disease in diabetes. The toe-brachial index and waveform analysis outperform the ankle-brachial index and should complement it when calcification is suspected.
Keywords
peripheral arterial disease, diabetes mellitus, ankle brachial index, toe brachial index, diagnostic accuracy, systematic review
INTRODUCTION
Peripheral arterial disease is one of the most consequential vascular complications of diabetes and the principal driver of the excess risk of foot ulceration, failure to heal and major amputation that characterizes the diabetic foot.(1) Diabetes is a strong and independent risk factor for atherosclerotic disease of the lower limbs, and the combination of chronic hyperglycemia, dyslipidemia, smoking and kidney disease accelerates the occlusion of the tibial and pedal vessels that supply the foot.(2) More than half of the people with peripheral arterial disease report no classic claudication, partly because coexisting neuropathy suppresses the ischemic pain signal, so the condition frequently goes unrecognized until a foot lesion appears.(2) Retrospective cohorts from diabetic foot clinics confirm that arterial disease is present in a large share of ulcers at first presentation, that its presence prolongs healing and that it worsens the risk of amputation and death.(3) Because neuropathy and altered foot biomechanics convert minor skin damage into limb-threatening wounds, the early and correct recognition of ischemia is a central component of every contemporary guideline on the diabetic foot and on chronic limb-threatening ischemia.(4-6) The recognition of ischemia therefore sits upstream of every subsequent decision, from offloading and revascularization to the level of amputation, and false reassurance at the bedside propagates into delayed referral and preventable tissue loss.(4)
The bedside instruments used for this recognition are the ankle-brachial index, the toe-brachial index and Doppler waveform analysis, all of them non-invasive, inexpensive and feasible in outpatient and primary care, where imaging and vascular laboratory access are often limited.(7) The ankle-brachial index is the traditional first-line test because it compares the systolic pressure at the ankle with that at the arm and therefore estimates the hemodynamic significance of occlusive disease, and its measurement and interpretation are standardized in vascular medicine.(7,8) Its validity is nonetheless compromised in diabetes, because medial arterial calcification stiffens the tunica media of the tibial arteries and prevents cuff compression, which inflates the measured ankle pressure and can yield a falsely normal or falsely elevated index even when occlusive disease is present.(9) The toe-brachial index and arterial waveform morphology are proposed as alternatives that remain interpretable when the ankle vessels are calcified, because the digital arteries are relatively spared from medial calcification and because waveform shape reflects downstream resistance regardless of arterial compressibility.(9,10) Existing systematic reviews of these tests in diabetes report discordant estimates, with sensitivity of the ankle-brachial index ranging from markedly reduced to acceptable, and they differ on which test should be used first.(11-15) These syntheses have pooled between 18 and 35 studies and still disagree, partly because the reference standard and the diabetic populations differ across reports, and several of them flag a high risk of bias in patient selection.(13,14) An inaccurate bedside test is not a benign convenience, because the decision to revascularize, to offload or to proceed to amputation often rests on these measurements, and the same instruments are used to monitor patients after intervention.(5,10) To resolve this uncertainty, this systematic review aimed to synthesize the diagnostic accuracy of the ankle-brachial index, the toe-brachial index and Doppler waveform analysis for detecting peripheral arterial disease in people with diabetes.
The scope was restricted to diagnostic accuracy studies published between 2018 and 2026 that compared at least one of the three bedside tests against an imaging reference standard, and the synthesis was planned as a narrative aggregation of sensitivity, specificity and area under the curve rather than as a meta-analysis, because the tests, thresholds and reference standards were expected to be heterogeneous. The objective was therefore to determine whether any single bedside test, or a combination of them, is accurate enough to detect or exclude peripheral arterial disease in this population, and to identify the precise circumstances in which each bedside test should be preferred in routine care. The review complements the largest prospective diagnostic accuracy study in this population, which reported its primary results within the search window and is included here, and it extends the comparison across the full set of bedside instruments rather than a single test.(16,17)
METHODS
The review was conducted and reported in accordance with the PRISMA 2020 statement.(18) Studies were eligible when they enrolled adults with diabetes mellitus, or mixed populations in which people with diabetes were included and analyzed separately or as a substantial subgroup, and when they evaluated the ankle-brachial index, the toe-brachial index or Doppler waveform analysis for detecting peripheral arterial disease against a reference standard.
The reference standard had to be an imaging technique, computed tomographic or magnetic resonance angiography, digital subtraction angiography or duplex ultrasonography. Studies of other index tests, such as pedal acceleration time, maximal systolic acceleration, transcutaneous oxygen pressure or circulating biomarkers, were excluded, as were protocols, reviews, editorials and letters. Studies that defined disease with the same hemodynamic measurements under evaluation rather than with an independent reference standard were also excluded, because such designs cannot estimate diagnostic accuracy and they overstate the performance of the tests. No language restriction was imposed at the search stage, and the publication window was 2018 to 2026 in accordance with the review protocol.
Scopus, PubMed, OpenAlex and Crossref were searched. Each database query combined terms for the index tests, terms for peripheral arterial disease and terms for diabetes, restricted to the publication window, and all queries, dates and record counts were recorded for reproducibility.
Search 1. Vascular indices and peripheral arterial disease
"ankle-brachial index"
"ankle brachial index"
"toe-brachial index"
"toe brachial index"
"peripheral arterial disease"
"peripheral artery disease"
diabet*
Search 2. Doppler waveform analysis
"Doppler waveform"
"continuous wave Doppler"
"waveform analysis"
"peripheral arterial disease"
"peripheral artery disease"
diabet*
Search 3. Diagnostic accuracy and performance
"ankle-brachial index"
"toe-brachial index"
"peripheral arterial disease"
"peripheral artery disease"
"sensitivity"
"specificity"
"diagnostic accuracy"
"diagnostic performance"
The reference lists of the retrieved systematic reviews were inspected for additional records that the database queries might have missed, and the screening records from the databases were cross-checked against each other so that the same report retrieved from two sources was counted once.
Effect measures and synthesis
The planned effect measures were sensitivity, specificity, area under the receiver operating characteristic curve, and positive and negative likelihood ratios, extracted or derived when reported. Because the index tests, thresholds, reference standards and populations differed across studies, the estimates were not pooled in a meta-analysis, and a narrative synthesis stratified by test was used instead, with ranges reported and the largest prospective comparison serving as the anchor. Studies were grouped by index test so that the accuracy of the ankle-brachial index, the toe-brachial index and Doppler waveform analysis could be compared directly across investigations. Studies were also grouped by reference standard so that the influence of the reference technique on the estimates could be examined, and the conventional thresholds of 0.9 for the ankle-brachial index and 0.6 for the toe-brachial index were used as the reference points for the narrative comparison.
Data extraction
One reviewer extracted study design, country, sample size, population, index test, reference standard, diagnostic thresholds and accuracy estimates into a structured form, together with the section of each report from which each datum was taken. When a study reported accuracy at several thresholds, the estimate at the conventional threshold was preferred, and the alternative thresholds were recorded to allow the range to be described. Missing data were not imputed.
RESULTS
Across the fifteen included studies, the ankle-brachial index missed a large proportion of people with diabetes and peripheral arterial disease: in the largest prospective comparison, the sensitivity of the ankle-brachial index was 41% (95% CI 32-50) with a specificity of 84% (95% CI 79-89) against computed tomographic or magnetic resonance angiography.(16) Below that value, the sensitivity of the same test stood at 35.5% in a Brazilian community cohort referenced to duplex ultrasonography and at 35.3% in an Indian cohort referenced to computed tomography angiography.(20,21)
The anchor study enrolled 604 participants with diabetes and suspected disease between April 2022 and November 2023 and obtained valid reference imaging in 536 of them, and it evaluated six index strategies in the same cohort.(16) The exercise ankle-brachial index reached a sensitivity of 41% (95% CI 31-51) and a specificity of 83% (95% CI 78-88), and a scanning device applied to a smaller subgroup reached the highest sensitivity of the series at 89% (95% CI 74-100) at the cost of a specificity of 69%.(16) Reclassifying all biphasic waveforms as abnormal raised the sensitivity of visual Doppler from 42% to 72% (95% CI 64-81) and lowered its specificity to 52% (95% CI 45-59), which demonstrated that the choice of waveform threshold changes the trade-off between missed cases and false alarms.(16) The anchor study also reported the likelihood-based performance of each test, and the audible Doppler achieved the highest positive predictive value of 75% (95% CI 64-87) and the highest specificity of 93% (95% CI 90-97), although its negative predictive value remained 72% (95% CI 66-77), which meant that nearly three of every ten negative audible Doppler readings were wrong.(16) The toe-brachial index missed 84 of the cases despite being the most sensitive single bedside test in that cohort, and the ankle-brachial index missed an even larger share.(16)
The upper end of the range reached 95% in a small Indonesian series referenced to angiography, and a study of people with type 2 diabetes found a sensitivity of 72.7% for the Doppler-derived index.(22,23) The plethysmographic method in that same study reached only 20% sensitivity, which represented the widest divergence between two measurement techniques applied to the same population, and the optimal cut-off for the toe-brachial index in that cohort was 0.38 rather than the conventional 0.6.(23) The sensitivity of the ankle-brachial index across all studies therefore ranged from 35% to 95%, with most estimates below 70%.
Specificity was the strength of the ankle-brachial index and fell to a lesser extent across studies, from 62% to 98%, with most estimates at or above 80%.(16, 19, 20,24,25) In the community cohort the specificity reached 97.6%, which gave the index a positive likelihood ratio of 14.5 and a negative likelihood ratio of 0.66.(20) A clearly abnormal index was therefore a dependable marker of disease even though a normal index did not exclude it. The cuffless estimate derived from the Doppler acceleration index matched the standard ankle-brachial pressure index and reached a sensitivity of 97% and a specificity of 96% against ultrasound, confirmed against computed tomography angiography with a specificity of 100%, although its sensitivity was numerically lower in the subgroup with diabetes, at 85% versus 89%.(26)
The toe-brachial index reached a sensitivity between 55% and 100% and a specificity between 57% and 92%.(16,21,25) In the three head-to-head comparisons its sensitivity exceeded that of the ankle-brachial index while specificity remained similar or higher.(16,21,25) The retrospective study of foot ulcer patients reproduced this gradient with a sensitivity of 100% for the toe-brachial index and of 82% for the ankle-brachial index, and the Canadian wound cohort reported an area under the curve between 0.82 and 0.87 for the toe-brachial index against Doppler waveform morphology.(25,27) In the Indian cohort, the toe-brachial index at the conventional threshold of 0.6 reached a sensitivity of 82.4% and a specificity of 92%, whereas the ankle-brachial index below 0.9 reached only 35.3% sensitivity, and the toe index showed substantially better agreement with computed tomography angiography than the ankle index did.(21)
In the anchor study the toe-brachial index reached the highest sensitivity of the pressure-based tests but still missed 84 of the cases, which indicated that even the best single bedside pressure test does not close the detection gap.(16) In the Canadian cohort the cut-off points for toe pressure were lower in people with diabetes, between 78 and 86 mmHg, than in those without diabetes, which reinforced the need to interpret distal pressures against diabetes-specific thresholds.(27) Toe pressure performed comparably to the toe-brachial index in that cohort, with a sensitivity between 79% and 90% and a specificity between 67% and 79% at the optimal cut-offs, and the sensitivity and specificity of the two distal measures did not differ at the established severity thresholds.(27) Of the 108 patients in that cohort, 55% had diabetes and 40% had a monophasic dorsalis pedis waveform on the left foot, and the area under the curve was higher when the dorsalis pedis waveform served as the comparator than when the tibial waveform did.(27)
Doppler waveform analysis detected additional cases that the ankle-brachial index overlooked. The sensitivity of printed continuous-wave Doppler waveforms was 81.8% (95% CI 76.8-85.9) with a specificity of 89.3% (95% CI 82.6-93.7) in a community sample, and the sensitivity was similar in the subgroup with diabetes, which indicated that diabetes did not by itself degrade the waveform reading.(28) The sensitivity against angiography as the reference was 81.7% (95% CI 69.6-90.5), comparable to the estimate against duplex ultrasound.(28) Waveform analysis reached a sensitivity of 83% and a specificity of 100% in foot ulcer patients.(25) The maximum systolic amplitude of pulse volume recordings reached a sensitivity of 91.4% and a specificity of 80.8% against invasive angiography in diabetic foot syndrome, with an area under the curve of 0.89 at a cut-off of 0.58 mmHg for any peripheral arterial disease, and abnormal pulse volume morphology judged semiquantitatively reached a sensitivity of 63.3% and a specificity of 85.7% for severe disease with a substantial interobserver agreement.(29) A pulse wave handheld Doppler reached 100% sensitivity against angiography in one small series, and when that handheld Doppler was combined with the ankle-brachial index the sensitivity was 100% with a specificity of 80%, which illustrated the gain achievable by pairing a pressure ratio with a waveform reading.(22)
Second, audible and visual Doppler in the anchor study reached only 36% and 42% sensitivity, which represented the lower boundary of waveform-based performance and showed that the operator-dependent reading of Doppler signals is not equivalent across settings.(16) A cuffless Doppler-derived index reached an area under the curve of 0.99 in a cohort that included people with diabetes, and a deep learning classifier applied to handheld Doppler spectrograms identified masked ischemia in 37 of 40 symptomatic diabetic patients with a normal ankle-brachial index.(26,30) At the same time, a prospective comparison in a mixed at-risk population found that a portable Doppler device reached 82.5% sensitivity and 93.9% specificity, both higher than the ankle-brachial index in the same cohort, and this advantage persisted across the analyzed subgroups, including the subgroup with diabetes.(31) The pulse volume wave analysis in the type 2 diabetes cohort reached the highest sensitivity of all the tests examined there.(23) The optimal cut-off of 0.38 for the toe-brachial index in that cohort was substantially lower than the conventional 0.6, which again illustrates that the threshold that maximizes sensitivity in a diabetic population is not the threshold validated in general populations.(23)
The plethysmographic and Doppler methods of obtaining the ankle-brachial index agreed in most studies, and the automated oscillometric device reached an area under the curve of 0.89 with a specificity of 100% at the conventional threshold, although its sensitivity of 57% remained limited and the area under the curve in the diabetic subgroup was 0.870.(24) The automated devices therefore reproduced the Doppler ankle-brachial index but did not escape its underlying sensitivity limit, and the cuffless method derived from the Doppler acceleration index was the most accurate single estimate in its cohort, which suggests that waveform-derived indices can recover information lost by the cuff-based measurement, although it has not yet been validated across centers.(26) The alternative calculation of the index that combined a low value with the percentage of mean arterial pressure raised sensitivity from 56.5% to 76.9% in a series referenced to multidetector computed tomography angiography.(32) In people with diabetes-related foot ulceration, the likelihood ratios confirmed that the ankle-brachial index and pedal pulses had limited utility for exclusion, with negative likelihood ratios of 0.53 and 0.75, whereas the distal tibial waveform and the toe-brachial index approached useful exclusion with negative likelihood ratios of 0.15 and 0.24.(33)
The selection flow is shown in the PRISMA diagram (Figure 1). Searches identified 731 records, and after 155 duplicates were removed, 576 records were screened by title and abstract, of which 548 were excluded at that stage. Of the 28 reports sought for retrieval, 4 could not be retrieved, and 24 were assessed for eligibility, of which 9 were excluded because no independent reference standard was used in seven, because the design differed in one and because the index test differed in one, leaving 15 studies in the review (Figure 1).
The characteristics of the included studies are described in (Table 1). Publication years ranged from 2018 to 2026 and sample sizes from 60 to 604 participants. Eleven studies evaluated the ankle-brachial index, seven the toe-brachial index and ten a form of Doppler waveform or pulse volume analysis, with most studies reporting more than one test (Table 1). The reference standard was computed tomographic or magnetic resonance angiography in four studies, duplex ultrasonography in seven, invasive angiography in two, mixed vascular imaging in one and Doppler waveform morphology in one (Table 1). The geographic spread was wide, with studies from Europe, Asia, South America and North America, and the largest investigation was the prospective multicenter comparison that enrolled 604 participants with diabetes and suspected disease (Table 1). In terms of design, most studies were cross-sectional, three were prospective and two were retrospective, and the populations ranged from community-dwelling adults with diabetes screened in Brazil to hospital-based cohorts with diabetic foot syndrome referenced to invasive angiography.(20,29) The prevalence of peripheral arterial disease differed accordingly, from 16% in the community cohort to 66% in the foot ulcer cohort, which partly explains the spread of the predictive values across the reports.(20,25)
The accuracy estimates are summarized by test in (Table 2) and in (Figure 2). Risk of bias was low for the reference standard domain in fourteen studies and for patient selection in five, whereas the flow and timing domain was rated low in five studies and the remaining judgments were unclear because the reports did not state the interval between the index test and the reference standard (Table 3). One study used waveform morphology rather than imaging as its reference, which raised applicability concerns, and one study used a case-control spectrum that contrasted established disease with healthy controls, which inflated the reported accuracy (Table 3). No study reported a meta-analyzable bivariate estimate that could be pooled across investigations, and the wide variation in the reported cut-offs reinforced the decision to keep the synthesis descriptive rather than quantitative.
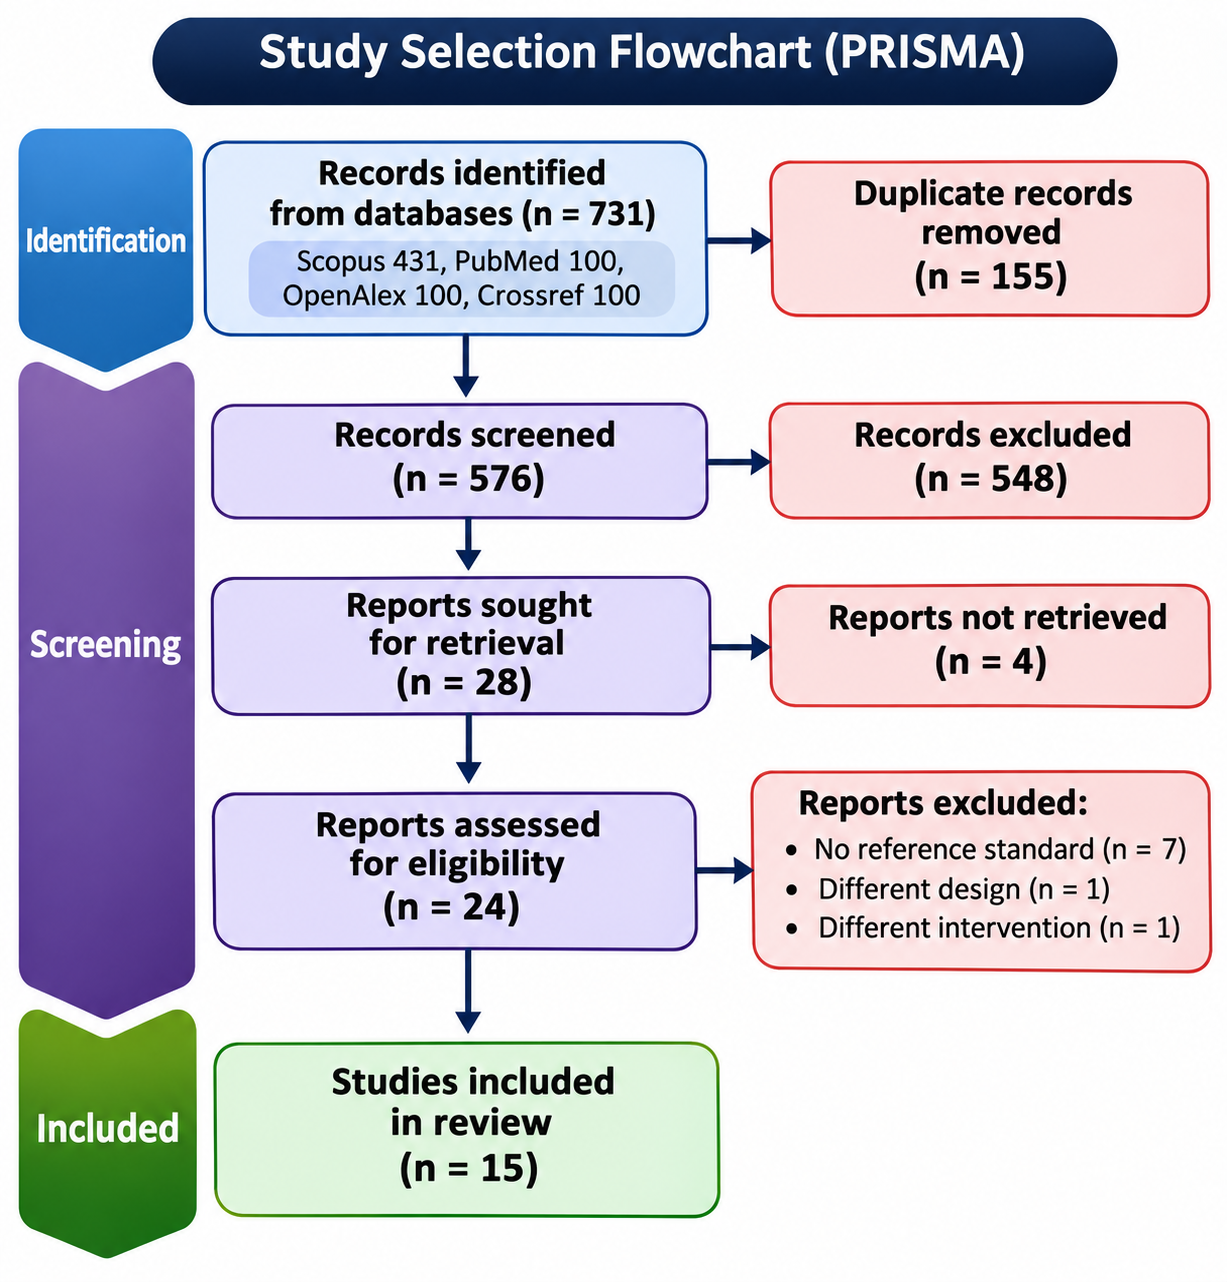
Figure 1. PRISMA 2020 flow diagram of study selection.
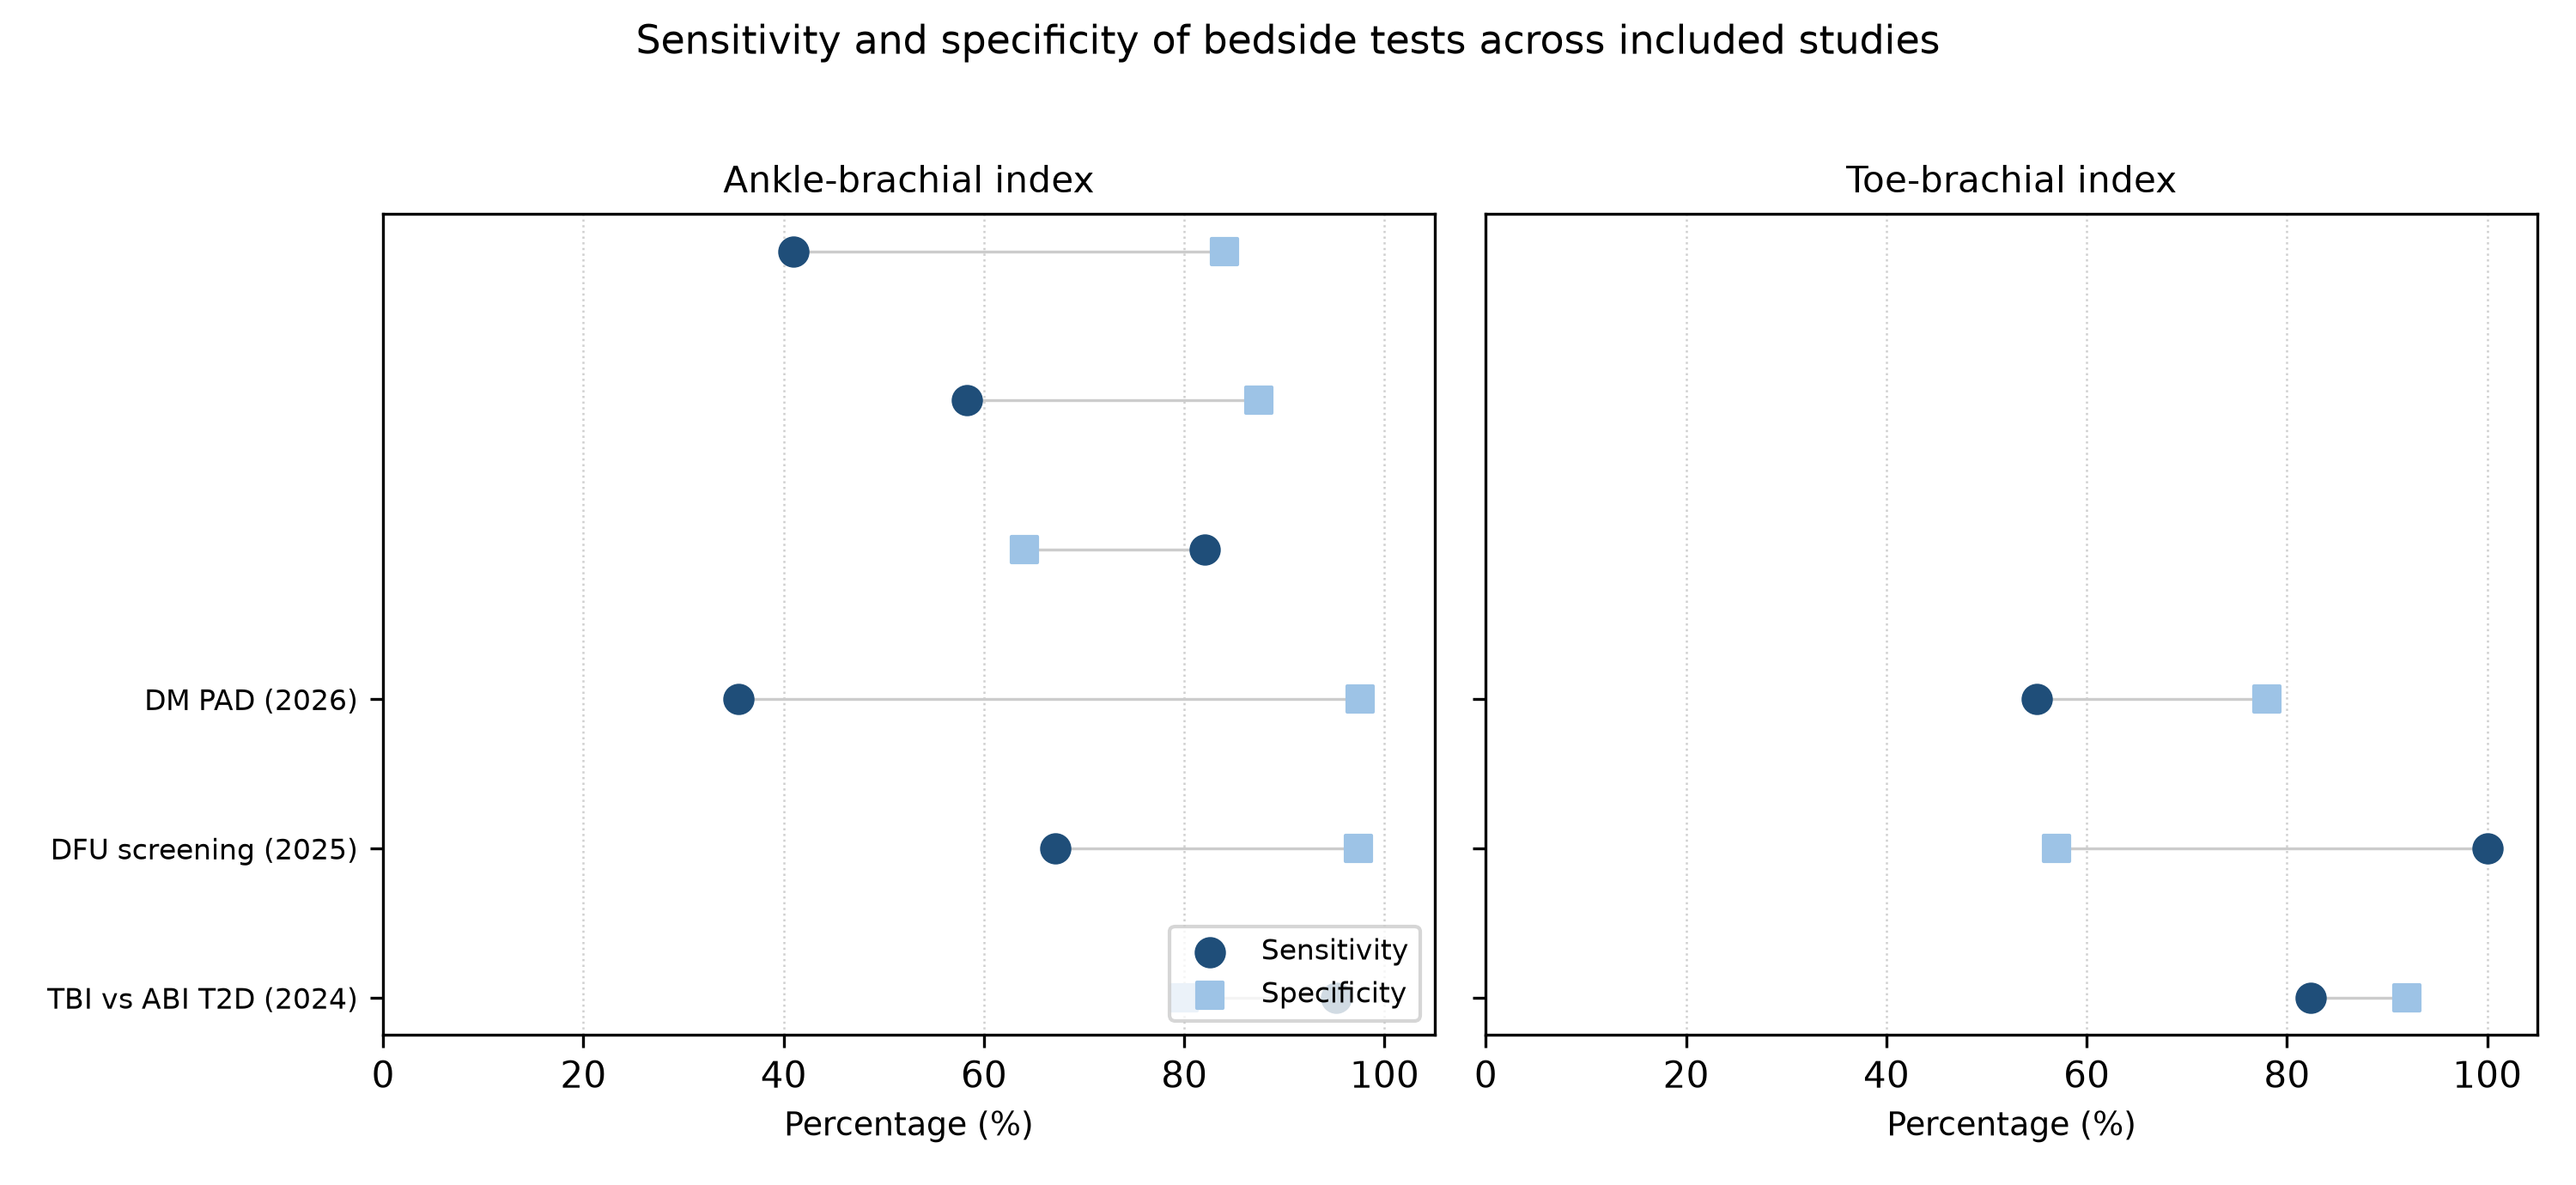
Figure 2. Sensitivity and specificity of the ankle-brachial index and the toe-brachial index across included studies.
Study (year) | Country | Design | n | Population | Index test | Reference standard |
|---|---|---|---|---|---|---|
DM PAD (2026) | United Kingdom | Prospective multicenter | 604 | Diabetes, suspected PAD | ABI, TBI, audible and visual Doppler | CTA or MRA |
Beyond the Cuff (2026) | Not stated | Prospective | 120 | Diabetic, masked ischemia | Deep learning on handheld Doppler | Imaging |
BlueDop (2026) | United Kingdom | Prospective | 751 limbs | Mixed risk, including diabetes | BlueDop, ABI | Full-leg DUS |
Cuffless ABI (2022) | United Kingdom | Retrospective and prospective | 348 | Suspected PAD, with and without diabetes | Cuffless Doppler ABI | Ultrasound and CTA |
ABI, TBI and PVR (2020) | Iran | Cross-sectional | 303 | Type 2 diabetes | Doppler and plethysmographic ABI, TBI, PVR | Doppler ultrasound |
Continuous-wave Doppler (2018) | United Kingdom | Cross-sectional | 396 | Suspected PAD, 176 with diabetes | Continuous-wave Doppler waveform | DUS and angiography |
DFU screening tests (2025) | Italy | Retrospective | 97 | Diabetic foot ulcer | ABI, TBI, toe pressure, waveform | DUS |
Segmental PVR (2025) | Germany | Cross-sectional | 90 extremities | Diabetic foot syndrome | Forefoot PVR | Invasive angiography |
TBI versus ABI (2024) | India | Cross-sectional | 175 | Type 2 diabetes | ABI, TBI | CTA |
Community ABI (2024) | Brazil | Cross-sectional | 99 | Diabetes, community | ABI | DUS |
MESI and Doppler (2023) | Hungary | Cross-sectional | 117 | Incompressible ankle arteries | Doppler and automated ABI, TBI | DUS, DSA or CTA |
ABI and PWHD (2021) | Indonesia | Cross-sectional | 67 | PAD patients | ABI, PWHD | Angiography |
Vriens (2018) | Netherlands | Prospective | 60 | Diabetes-related foot ulcer | ABI, TBI, toe pressure, waveforms | DUS |
Toe pressure (2025) | Canada | Retrospective | 108 | Foot wounds, 55% diabetes | Toe pressure, TBI | Doppler waveforms |
ABI plus %MAP (2018) | Taiwan | Retrospective | 215 extremities | Suspected PAD | ABI, %MAP from PVR | Multidetector CTA |
Note: ABI = ankle-brachial index; TBI = toe-brachial index; DUS = duplex ultrasonography; CTA = computed tomography angiography; MRA = magnetic resonance angiography; DSA = digital subtraction angiography; PVR = pulse volume recording; PWHD = pulse wave handheld Doppler.
Study (year) | Test | Sensitivity (95% CI) | Specificity (95% CI) | AUC |
|---|---|---|---|---|
DM PAD (2026) | ABI | 41 (32-50) | 84 (79-89) | NR |
DM PAD (2026) | TBI | 55 (46-64) | 78 (72-83) | NR |
DM PAD (2026) | Audible Doppler | 36 (27-45) | 93 (90-97) | NR |
DM PAD (2026) | Visual Doppler | 42 (33-51) | 86 (81-91) | NR |
BlueDop (2026) | BlueDop | 82.5 | 93.9 | NR |
BlueDop (2026) | ABI | 58.3 | 87.4 | NR |
ABI, TBI and PVR (2020) | Doppler ABI | 72.7 | NR | NR |
ABI, TBI and PVR (2020) | PVR | 81.8 | NR | NR |
Continuous-wave Doppler (2018) | Waveform | 81.8 (76.8-85.9) | 89.3 (82.6-93.7) | NR |
DFU screening tests (2025) | ABI | 82 | 64 | NR |
DFU screening tests (2025) | TBI | 100 | 57 | NR |
DFU screening tests (2025) | Waveform | 83 | 100 | NR |
Segmental PVR (2025) | PVR morphology | 63.3 | 85.7 | NR |
Segmental PVR (2025) | PVR amplitude | 91.4 | 80.8 | 0.89 |
TBI versus ABI (2024) | ABI | 35.3 (21-52) | NR | 0.67 |
TBI versus ABI (2024) | TBI | 82.4 (66-92) | 92 (87-96) | NR |
Community ABI (2024) | ABI | 35.5 | 97.6 | NR |
MESI and Doppler (2023) | Doppler ABI | 67.1 | 97.4 | 0.89 |
MESI and Doppler (2023) | Automated ABI | 57.0 | 100 | 0.89 |
ABI and PWHD (2021) | ABI | 95.2 | 80 | NR |
ABI and PWHD (2021) | PWHD | 100 | 100 | NR |
Toe pressure (2025) | TBI | 85-90 | 64-77 | 0.82-0.87 |
Toe pressure (2025) | Toe pressure | 79-90 | 67-79 | 0.80-0.85 |
ABI plus %MAP (2018) | ABI | 56.5 | NR | NR |
Note: ABI = ankle-brachial index; TBI = toe-brachial index; CI = confidence interval; AUC = area under the curve; NR = not reported. Values are percentages unless stated otherwise.
Study (year) | Selection | Index test | Reference standard | Flow and timing |
|---|---|---|---|---|
DM PAD (2026) | L | L | L | L |
Beyond the Cuff (2026) | H | L | L | U |
BlueDop (2026) | U | L | L | U |
Cuffless ABI (2022) | L | L | L | L |
ABI, TBI and PVR (2020) | U | U | L | U |
Continuous-wave Doppler (2018) | U | L | L | U |
DFU screening tests (2025) | U | U | L | U |
Segmental PVR (2025) | U | L | L | L |
TBI versus ABI (2024) | U | L | L | L |
Community ABI (2024) | L | L | L | L |
MESI and Doppler (2023) | U | L | L | U |
ABI and PWHD (2021) | U | U | L | U |
Vriens (2018) | L | L | L | L |
Toe pressure (2025) | U | U | H | U |
ABI plus %MAP (2018) | U | L | L | U |
Note: L = low risk; U = unclear risk; H = high risk. Domains: selection, index test, reference standard, flow and timing.
DISCUSSION
The clinical implication of the main finding is that a normal or near-normal ankle-brachial index cannot be used to exclude peripheral arterial disease in people with diabetes, because the test leaves roughly half of the cases undetected. This conclusion follows directly from the anchor study and from the community and imaging-referenced cohorts that reproduced the same pattern.(16,20,21) At the same time, the consistently high specificity means that a clearly abnormal index is a reliable marker of disease, which preserves the test as a rule-in instrument but disqualifies it as a screening gate for exclusion in this population. The practical consequence is that a normal ankle-brachial index in a person with diabetes and a foot ulcer should trigger additional testing rather than reassurance, a message that is already present in the diabetic foot guidelines but is not yet reflected in routine practice.(4)
The low sensitivity found here agrees with earlier syntheses of the ankle-brachial index in diabetes, including a meta-analysis of 33 studies that compared the index with angiography or colour duplex ultrasound.(11) Second, it agrees with the review that described the limited value of the index in diabetes because of arterial calcification and with the meta-analysis of 18 studies that pooled the performance of bedside tests in this population.(12,14) To a lesser extent, the estimates are lower than those reported in general populations, where the index is regarded as sensitive and specific, a discrepancy explained by the preferential inclusion of symptomatic patients and by the exclusion of calcified, incompressible vessels in non-diabetic cohorts.(34,35) The anchor study is informative here because it recruited consecutive people with diabetes prospectively and referenced every test to angiography, and it still found no single test with an acceptable combination of sensitivity and specificity, a result summarized in the published synopsis of that investigation.(16,17) The interpretation of the ankle-brachial index in diabetes is further complicated by the grey zone between 0.91 and 1.40, within which the index is conventionally read as normal but in which color Doppler studies find hemodynamically significant stenosis.(36) This grey zone is precisely where medial calcification clusters, so the combination of a borderline index with a history of diabetes should lower the threshold for additional testing rather than close the investigation.(9,10)
For the toe-brachial index, the superiority over the ankle-brachial index observed in the head-to-head studies is consistent with the meta-analysis that pooled 35 studies of the ankle-brachial index and nine of the toe-brachial index across a wide spectrum of populations.(13) Second, the Cochrane review of the toe-brachial index and toe systolic pressure examined these distal measures within the suite of non-invasive tests, and the Taiwanese comparison in diabetic kidney disease reached the same conclusion for the toe-brachial index over the ankle-brachial index.(37,38) Below that value, the advantage was clearest when the ankle-brachial index fell into the grey zone between 0.91 and 1.40, the interval in which color Doppler studies also detect disease that the index misses, because the digital arteries are relatively spared from medial calcification.(9,36) The lower specificity of the toe-brachial index in the foot ulcer cohort, where it fell to 57%, indicates that the gain in sensitivity is partly traded against false positives and that the toe index should be interpreted together with the ankle index rather than in isolation.(25) The pathophysiological explanation for this pattern is that medial calcification in diabetes affects the media of medium-sized arteries while the digital vessels remain compressible for longer, so the toe pressure remains a valid estimate of downstream perfusion when the ankle pressure is no longer informative.(9) Toe pressure and the toe-brachial index performed similarly in the Canadian wound cohort, with overlapping confidence intervals for their areas under the curve, which suggests that either distal pressure can substitute for the other when the ankle index is unreliable.(27) This equivalence is useful in practice because toe pressure requires only a small cuff and a photoplethysmographic sensor and can be obtained where toe-brachial index equipment is unavailable. The optimal thresholds reported in the primary studies, from 0.38 to 0.6 for the toe-brachial index, show that a single universal cut-off is not established, and the choice of threshold materially changes the balance between sensitivity and specificity in a diabetic population.(21,23)
For Doppler waveform analysis, the finding that waveform morphology and pulse volume recording identify additional cases is supported by the systematic review of bedside investigations in diabetes, which found no consensus on the most accurate bedside test and examined both accuracy and reliability.(15) The standardization of waveform interpretation remains incomplete, however, and a reliability review in patients prone to medial arterial calcification found variable performance, while consensus processes on portable ankle and toe pressure systems emphasize that device choice and operator training change the measured performance.(39,40) This explains why the audible and visual Doppler readings in the anchor study performed below the waveform estimates reported elsewhere, and it cautions against assuming that any Doppler signal conveys the same information.(16) The encouraging results of automated and machine learning analyses of Doppler signals suggest that removing the subjective reading step may raise the consistency of waveform-based diagnosis, although these tools remain investigational.(26,30) The clinical guideline documents for diabetes-related foot disease recommend waveform-based and distal pressure tests precisely because of the ankle index limitation documented here, and the present synthesis provides the quantitative basis for that recommendation.(10,41) The secondary analysis of the anchor study reinforces a practical point: when biphasic waveforms were treated as abnormal, the sensitivity of visual Doppler rose from 42% to 72% at the expense of specificity, so the reading threshold can be tuned toward screening or toward confirmation depending on the clinical question.(16)
The low prevalence of peripheral arterial disease in the community cohort also explains why the negative predictive value of the ankle-brachial index appeared acceptable there even though sensitivity was low, because in a low-prevalence setting most negative tests are correct regardless of the test.(20) In the foot ulcer cohort the higher prevalence of disease made the false negatives clinically more consequential, which is why the toe-brachial index and waveform analysis were preferred in that setting.(25)
The heterogeneity of the estimates is explained by four sources. Patient selection differed, because case-control designs that contrast severe disease with healthy controls inflate accuracy, whereas consecutive community cohorts lower it.(20,30) Second, the reference standard ranged from duplex ultrasonography to catheter angiography, which changes the definition of disease and the estimated sensitivity, and the guideline documents that describe these reference techniques differ in the stenosis threshold they apply.(5,8) To a lesser extent, the index thresholds differed across studies, from 0.9 to 1.0 for the ankle-brachial index and from 0.38 to 0.6 for the toe-brachial index, and several reports compared automated devices against the Doppler method rather than against imaging.(42,43) These differences prevented a meaningful pooled estimate and justify the narrative approach adopted here.
The strengths of this review include the prospective anchor study, which enrolled consecutive participants and referenced every index test to angiography, and the geographic spread of the evidence, which reduces the risk that a single clinical setting drives the conclusions.(16) The restriction to imaging reference standards also minimized the verification bias that weakens studies in which the index test defines the diagnosis. These strengths allow a firmer conclusion than earlier reviews could draw: the low sensitivity of the ankle-brachial index is not an artifact of any single study design but a consistent property of the test in diabetes. The inclusion of the largest prospective diagnostic accuracy study published to date also means that the central estimate is unlikely to change materially as more small studies accumulate.(16)
The certainty of the evidence is highest for the central conclusion that the ankle-brachial index is insensitive in diabetes, because it is supported by the prospective anchor study, two independent imaging-referenced cohorts and three prior systematic reviews that reach the same conclusion.(11,16,20,21) The certainty is lower for the comparative ranking of the toe-brachial index and waveform analysis, because those estimates come from fewer and smaller studies with heterogeneous reference standards, and the advantage of the toe-brachial index was not confirmed in every cohort.(27) A formal grading of certainty was not performed, and the narrative synthesis should be read with that limitation in mind. For population screening, the low sensitivity of the ankle-brachial index means that a substantial number of people with diabetes and early arterial disease would be classified as unaffected, which argues against relying on the index alone in screening programmes and supports adding waveform or toe pressure measurements when the pretest probability is high.(27,34)
For bedside decision-making, the results translate into three operating rules. A low ankle-brachial index in a person with diabetes is a reliable sign of arterial disease and should prompt imaging. A normal or borderline index, between 0.91 and 1.40, does not exclude disease and should be followed by a toe pressure or a waveform assessment. A monophasic or otherwise abnormal waveform, or a low toe pressure, should trigger imaging even when the ankle index is normal.(16,25,36) Because these bedside tests are also used to monitor disease progression and the response to revascularization, the same sensitivity limit applies to monitoring, and a stable or rising ankle-brachial index over time does not guarantee that perfusion has improved, which is why waveform and toe pressure measures are increasingly recommended for serial assessment.(10,41)
For clinical practice, the findings support a sequential strategy in which the ankle-brachial index is used for rule-in, the toe-brachial index or waveform analysis is added when the index is normal or when calcification is suspected, and imaging is requested when the bedside tests conflict.(4,41) The combined use of tests is supported by the foot ulcer cohort, in which combining two tests raised sensitivity without reducing specificity, and by the observation that the percentage of mean arterial pressure adds information to the ankle-brachial index in calcified vessels.(25,32) Clinicians should also record the device and the operator, because the consensus evaluations of portable systems show that apparently interchangeable instruments do not always return identical pressure and waveform readings, and the reproducibility of waveform interpretation depends on the training of the reader.(39,40) For research, diagnostic accuracy studies in diabetes should recruit consecutive unselected participants, report sensitivity and specificity at prespecified thresholds against angiography, and stratify results by the presence of medial arterial calcification, so that future syntheses can quantify the gain from combining tests.
CONCLUSIONS
The ankle-brachial index has high specificity but limited sensitivity for peripheral arterial disease in people with diabetes, and it missed nearly half of the cases in the largest prospective comparison. The toe-brachial index and Doppler waveform analysis detect additional cases and outperformed the ankle-brachial index in head-to-head studies, at the cost of moderate specificity for the toe-brachial index. Bedside tests should therefore be used in combination and followed by imaging when they disagree, rather than as standalone rules for exclusion.
References
- 1 Aday AW, Matsushita K. Epidemiology of Peripheral Artery Disease and Polyvascular Disease. Circulation Research. 2021;128(12):1818-1832. doi: 10.1161/circresaha.121.318535
- 2 Fowkes FGR, Rudan D, Rudan I, Aboyans V, Denenberg JO, McDermott MM, et al. Comparison of global estimates of prevalence and risk factors for peripheral artery disease in 2000 and 2010: a systematic review and analysis. The Lancet. 2013;382(9901):1329-1340. doi: 10.1016/s0140-6736(13)61249-0
- 3 Alem GM, Fatani S, Aldosari SA, Ahmed N, Balaha M, Balaha MF. Prevalence and impact of peripheral artery disease in diabetic foot: A retrospective multicenter cohort from three tertiary vascular centers in Saudi Arabia. Journal of Tissue Viability. 2026;35(3):101014. doi: 10.1016/j.jtv.2026.101014
- 4 Fitridge R, Chuter V, Mills J, Hinchliffe R, Azuma N, Behrendt C, et al. The intersocietal IWGDF, ESVS, SVS guidelines on peripheral artery disease in people with diabetes and a foot ulcer. Diabetes Metabolism Res. 2024;40(3):e3686. doi: 10.1002/dmrr.3686
- 5 Conte MS, Bradbury AW, Kolh P, White JV, Dick F, Fitridge R, et al. Global vascular guidelines on the management of chronic limb-threatening ischemia. Journal of Vascular Surgery. 2019;69(6):3S-125S.e40. doi: 10.1016/j.jvs.2019.02.016
- 6 Armstrong DG, Boulton AJM, Bus SA. Diabetic Foot Ulcers and Their Recurrence. N Engl J Med. 2017;376(24):2367-2375. doi: 10.1056/nejmra1615439
- 7 Aboyans V, Criqui MH, Abraham P, Allison MA, Creager MA, Diehm C, et al. Measurement and Interpretation of the Ankle-Brachial Index. Circulation. 2012;126(24):2890-2909. doi: 10.1161/cir.0b013e318276fbcb
- 8 Gerhard-Herman MD, Gornik HL, Barrett C, Barshes NR, Corriere MA, Drachman DE, et al. 2016 AHA/ACC Guideline on the Management of Patients With Lower Extremity Peripheral Artery Disease: A Report of the American College of Cardiology/American Heart Association Task Force on Clinical Practice Guidelines. Circulation. 2017;135(12). doi: 10.1161/cir.0000000000000471
- 9 Lanzer P, Schurgers L, Twarda-Clapa A, Ferraresi R, Hui H, Kamenskiy A, et al. Medial arterial calcification in ageing and disease: current evidence and knowledge gaps. European Heart Journal. 2025;46(45):4876-4900. doi: 10.1093/eurheartj/ehaf341
- 10 Hinchliffe RJ, Forsythe RO, Apelqvist J, Boyko EJ, Fitridge R, Hong JP, et al. Guidelines on diagnosis, prognosis, and management of peripheral artery disease in patients with foot ulcers and diabetes (IWGDF 2019 update). Diabetes Metabolism Res. 2020;36(S1):e3276. doi: 10.1002/dmrr.3276
- 11 Chuter VH, Searle A, Barwick A, Golledge J, Leigh L, Oldmeadow C, et al. Estimating the diagnostic accuracy of the ankle–brachial pressure index for detecting peripheral arterial disease in people with diabetes: A systematic review and meta‐analysis. Diabet Med. 2021;38(2):e14379. doi: 10.1111/dme.14379
- 12 Abouhamda A, Alturkstani M, Jan Y. Lower sensitivity of ankle-brachial index measurements among people suffering with diabetes-associated vascular disorders: A systematic review. SAGE Open Medicine. 2019;7:2050312119835038. doi: 10.1177/2050312119835038
- 13 Herraiz-Adillo Á, Cavero-Redondo I, Álvarez-Bueno C, Pozuelo-Carrascosa DP, Solera-Martínez M. The accuracy of toe brachial index and ankle brachial index in the diagnosis of lower limb peripheral arterial disease: A systematic review and meta-analysis. Atherosclerosis. 2020;315:81-92. doi: 10.1016/j.atherosclerosis.2020.09.026
- 14 Normahani P, Mustafa C, Shalhoub J, Davies AH, Norrie J, Sounderajah V, et al. A systematic review and meta-analysis of the diagnostic accuracy of point-of-care tests used to establish the presence of peripheral arterial disease in people with diabetes. Journal of Vascular Surgery. 2021;73(5):1811-1820. doi: 10.1016/j.jvs.2020.11.030
- 15 Chuter V, Schaper N, Mills J, Hinchliffe R, Russell D, Azuma N, et al. Effectiveness of bedside investigations to diagnose peripheral artery disease among people with diabetes mellitus: A systematic review. Diabetes Metabolism Res. 2024;40(3):e3683. doi: 10.1002/dmrr.3683
- 16 Normahani P, Burgess L, Graham C, Norrie J, Epstein DM, Kandiyil N, et al. Diagnostic Tools to Establish the Presence of Peripheral Arterial Disease in People With Diabetes (DMPAD): A Multicenter Comparative Diagnostic Accuracy Study. Diabetes Care. 2026;49(10):1795-1802. doi: 10.2337/dc25-1693
- 17 Burgess L, Normahani P, Norrie J, Tuck S, Graham C, Mark Epstein D, et al. Diagnostic tools to establish the presence and severity of peripheral arterial disease in people with diabetes: a synopsis of the DM PAD prospective multicentre diagnostic accuracy study. Health Technol Assess. 2026;30(62):1-22. doi: 10.3310/gjuj2819
- 18 Page MJ, McKenzie JE, Bossuyt PM, Boutron I, Hoffmann TC, Mulrow CD, et al. The PRISMA 2020 statement: an updated guideline for reporting systematic reviews. BMJ. 2021:n71. doi: 10.1136/bmj.n71
- 19 Whiting PF, Rutjes AWS, Westwood ME, Mallett S, Deeks JJ, Reitsma JB, et al. QUADAS-2: A Revised Tool for the Quality Assessment of Diagnostic Accuracy Studies. Ann Intern Med. 2011;155(8):529-536. doi: 10.7326/0003-4819-155-8-201110180-00009
- 20 Cerqueira MMBDF, Bastos NSSG, Silva DARD, Gregori D, Magalhães LBNC, Pimentel MMW. Accuracy of ankle-brachial index in screening for peripheral arterial disease in people with diabetes. PLoS ONE. 2024;19(10):e0309083. doi: 10.1371/journal.pone.0309083
- 21 Singhania P, Das TC, Bose C, Mondal A, Bhattacharjee R, Singh A, et al. Toe brachial index and not ankle brachial index is appropriate in initial evaluation of peripheral arterial disease in type 2 diabetes. Diabetol Metab Syndr. 2024;16(1):52. doi: 10.1186/s13098-024-01291-2
- 22 Thomas V, Tjandra D, Sumangkut R, Karundeng B, Korompis G. Sensitivity and Specificity of Ankle Brachial Index (ABI) and Pulse Wave Handheld Doppler (PWHD) Compared with Angiography as Diagnostic Test for Patients with Peripheral Artery Disease (PAD). JINASVS. 2021;2(1):10-11. doi: 10.36864/jinasvs.2021.1.005
- 23 Babaei MR, Malek M, Rostami FT, Emami Z, Madani NH, Khamseh ME. Non-invasive vascular assessment in people with type 2 diabetes: Diagnostic performance of Plethysmographic-and-Doppler derived ankle brachial index, toe brachial index, and pulse volume wave analysis for detection of peripheral arterial disease. Primary Care Diabetes. 2020;14(3):282-289. doi: 10.1016/j.pcd.2019.09.005
- 24 Fendrik K, Biró K, Endrei D, Koltai K, Sándor B, Tóth K, et al. Screening for Peripheral Artery Disease Using an Automated Four-Limb Blood Pressure Monitor Equipped with Toe–Brachial Index Measurement. JCM. 2023;12(20):6539. doi: 10.3390/jcm12206539
- 25 Ragghianti B, Bandini G, Ciuti G, Silverii A, Mannucci E, Monami M. Which and how many screening tests for an accurate diagnosis of peripheral artery disease in patients with diabetic foot ulcers? A retrospective study. Nutrition, Metabolism and Cardiovascular Diseases. 2025;35(11):104196. doi: 10.1016/j.numecd.2025.104196
- 26 Rodway AD, Cheal D, Allan C, Pazos-Casal F, Hanna L, Field BCT, et al. Ankle Doppler for Cuffless Ankle Brachial Index Estimation and Peripheral Artery Disease Diagnosis Independent of Diabetes. JCM. 2022;12(1):97. doi: 10.3390/jcm12010097
- 27 Beaumier M, Gignac T, Turcotte S, Patry J. Toe Pressure As A Standalone Vascular Assessment Of The Foot. LPJ. 2025;6(1). doi: 10.56885/203259znyvty
- 28 Tehan PE, Sebastian M, Barwick AL, Chuter VH. How sensitive and specific is continuous-wave Doppler for detecting peripheral arterial disease in people with and without diabetes? A cross-sectional study. Diabetes and Vascular Disease Research. 2018;15(5):396-401. doi: 10.1177/1479164118782887
- 29 Nützel A, Reik LJU, Hamberger M, Lottspeich C, Deniz S, Löw A, et al. Segmental Pulse Volume Recordings at the Forefoot Level as a Valuable Diagnostic Tool for Detection of Peripheral Arterial Disease in the Diabetic Foot Syndrome. Biomedicines. 2025;13(6):1281. doi: 10.3390/biomedicines13061281
- 30 Aydin E, Kurt D. Beyond the Cuff: Deep Learning Analysis of Handheld Doppler Signals Detects Masked Peripheral Ischemia in Diabetic Patients with Normal Ankle-Brachial Index. Annals of Vascular Surgery. 2026;132:296-304. doi: 10.1016/j.avsg.2026.06.003
- 31 Bockern BJV, Woldt MR, Devine JR, Withrow AD, Tessendorf CD, Bleeker C, et al. Expanding access to vascular care using BlueDop Vascular Expert: an artificial intelligence-driven diagnostic tool. J Wound Care. 2026;35(Sup6a):S5-S10. doi: 10.12968/jowc.2025.0595
- 32 Lin HW, Lee IT. Combination of the ankle-brachial index and percentage of mean arterial pressure to improve diagnostic sensitivity for peripheral artery disease. Medicine. 2018;97(39):e12644. doi: 10.1097/md.0000000000012644
- 33 Vriens B, D'Abate F, Ozdemir BA, Fenner C, Maynard W, Budge J, et al. Clinical examination and non‐invasive screening tests in the diagnosis of peripheral artery disease in people with diabetes‐related foot ulceration. Diabet Med. 2018;35(7):895-902. doi: 10.1111/dme.13634
- 34 US Preventive Services Task Force, Curry SJ, Krist AH, Owens DK, Barry MJ, Caughey AB, et al. Screening for Peripheral Artery Disease and Cardiovascular Disease Risk Assessment With the Ankle-Brachial Index. JAMA. 2018;320(2):177. doi: 10.1001/jama.2018.8357
- 35 Patel Y, Shah A, Patel P, Patel V, Bhut N, Desai D, et al. Diagnostic Accuracy of Ankle-Brachial Index in Patients With Peripheral Arterial Disease: A Meta-analysis. Cardiology in Review. 2025. doi: 10.1097/crd.0000000000001085
- 36 Hur KY, Jun JE, Choi YJ, Lee YH, Kim DJ, Park SW, et al. Color Doppler Ultrasonography Is a Useful Tool for Diagnosis of Peripheral Artery Disease in Type 2 Diabetes Mellitus Patients with Ankle-Brachial Index 0.91 to 1.40. Diabetes Metab J. 2018;42(1):63. doi: 10.4093/dmj.2018.42.1.63
- 37 Tehan PE, Mills J, Leask S, Oldmeadow C, Peterson B, Sebastian M, et al. Toe-brachial index and toe systolic blood pressure for the diagnosis of peripheral arterial disease. Cochrane Database of Systematic Reviews. 2024;2024(10):CD013783. doi: 10.1002/14651858.cd013783.pub2
- 38 Chang CW, Sung YW, Huang YT, Chung YC, Lee MY. Better Detection of Peripheral Arterial Disease with Toe-Brachial Index Compared to Ankle-Brachial Index among Taiwanese Patients with Diabetic Kidney Disease. JCM. 2023;12(23):7393. doi: 10.3390/jcm12237393
- 39 Brouwers JJWM, Willems SA, Goncalves LN, Hamming JF, Schepers A. Reliability of bedside tests for diagnosing peripheral arterial disease in patients prone to medial arterial calcification: A systematic review. eClinicalMedicine. 2022;50:101532. doi: 10.1016/j.eclinm.2022.101532
- 40 Watson EL, Patel B, Katsogridakis E, Pepper CJ, Messeder SJ, Saratzis A, et al. Selecting Portable Ankle/Toe Brachial Pressure Index Systems for a Peripheral Arterial Disease Population Screening Programme: a Systematic Review, Clinical Evaluation Exercise, and Consensus Process. European Journal of Vascular and Endovascular Surgery. 2022;64(6):693-702. doi: 10.1016/j.ejvs.2022.08.008
- 41 Chuter V, Quigley F, Tosenovsky P, Ritter JC, Charles J, Cheney J, et al. Australian guideline on diagnosis and management of peripheral artery disease: part of the 2021 Australian evidence‐based guidelines for diabetes‐related foot disease. Journal of Foot and Ankle Research. 2022;15(1):51. doi: 10.1186/s13047-022-00550-7
- 42 Boyers D, Cruickshank M, Aucott L, Kennedy C, Manson P, Bachoo P, et al. Automated devices for identifying peripheral arterial disease in people with leg ulceration: an evidence synthesis and cost-effectiveness analysis. Health Technol Assess. 2024;28(37):1-158. doi: 10.3310/twcg3912
- 43 Danieluk A, Kamieńska A, Chlabicz S. Assessing Automatic Plethysmographic Ankle-Brachial Index Devices in Peripheral Artery Disease Detection: A Comparative Study with Doppler Ankle-Brachial Index Measurements. Med Sci Monit. 2023;29:e940829-e940829. doi: 10.12659/msm.940829
Declarations
Funding
No financing
Conflict of interest
None
Authorship contributions
Drafting – original draft: Michel Oria Saavedra, Carolina Ortiz Martínez, Cecilia Capriles Lemus.
Writing–review and editing: Michel Oria Saavedra, Carolina Ortiz Martínez, Cecilia Capriles Lemus.