

Abstract
Introduction: Diabetic foot ulcers precede most diabetes-related lower-limb amputations, and early detection depends on specialist clinical assessment that is not always available. Smartphone-based and artificial intelligence image tools could extend screening, but their diagnostic accuracy remains scattered across heterogeneous studies. Methods: A systematic review; the bibliographic databases consulted were Scopus, Pubmed, Google Scholar, Open Alex and Crossref. Results: From 963 records, 19 studies were included, 8 of smartphone-based tools and 11 of artificial intelligence models. A smartphone artificial intelligence system detected ulcers with 0.9% sensitivity and 0.9% specificity against expert judgement. Deep learning models reported accuracy between 78.3% and 99.9%, sensitivity between 95.2% and 99.9%, and specificity between 94.0% and 99.9%. Patient selection was at high risk of bias in 15 of 19 studies. Conclusions: Smartphone and artificial intelligence tools reach high diagnostic accuracy for diabetic foot screening, but the evidence derives mostly from retrospective image datasets and requires prospective external validation before clinical use.
Keywords
diabetic foot, diabetic foot ulcer, smartphone, artificial intelligence, deep learning, sensitivity and specificity
INTRODUCTION
Diabetic foot ulcers are the most frequent pathway to diabetes-related lower-limb amputation, and their prevention depends on recognizing the foot at risk before the skin breaks down. Around 18.6 million people develop a diabetic foot ulcer each year worldwide, and up to one third of people with diabetes will experience one during their lifetime.(1,2) Ulceration recurs in about 40% of patients within one year and in 65% within five years, and the five-year mortality after an ulcer rivals that of several cancers.(2) A meta-analysis of 26 studies estimated the global prevalence of diabetic foot ulceration at 6.3% of people with diabetes, with wide variation across regions and income settings.(3) Foot disease affects roughly 6% of people with diabetes at any time, a burden that rises when neuropathy, peripheral arterial disease and deformity coincide.(4) Diabetes accounts for more than one million lower-limb amputations each year, and the large majority of those amputations are preceded by an ulcer that might have been detected earlier.(1) These figures matter because ulceration is preventable, and prevention is cheaper than the amputation that follows neglect.
The clinical answer to this burden is structured screening followed by risk stratification. Guidelines recommend an annual examination of the foot for loss of protective sensation, peripheral arterial disease, deformity and previous ulceration, after which each patient is assigned to a risk category that determines the frequency and intensity of follow-up.(5,6) The examination itself combines several measurements that a photograph could plausibly reproduce. Loss of protective sensation is tested with a monofilament, peripheral arterial disease by palpation of pulses or the ankle-brachial index, deformity by inspection, and previous ulceration from history, and these components are then combined into the risk categories defined by the International Working Group on the Diabetic Foot.(5,6) A camera cannot yet replace the monofilament or the Doppler probe, but it can capture the visible consequences of neuropathy and ischemia, namely deformity, callus, skin breaks and established ulceration, which is precisely the information that a photograph carries. The proportion of people with diabetes who actually receive this examination each year remains below guideline targets in most health systems, and the prevalence of the foot at risk identified when it is performed is substantial.(7) Where specialist expertise is scarce, detection is postponed until ulceration or infection is already established, and the opportunity for early intervention is lost.(4) The clinical examination is inexpensive, but its reach is limited by the number of trained examiners, and this is the constraint that a camera-based tool could relax. The stakes of getting this right are concrete: an ulcer detected at the earliest stage is usually managed with offloading and local wound care, whereas a missed ulcer can progress to infection, hospitalization and amputation within weeks. The practical question is therefore not whether screening works, but whether it can be extended beyond the clinic wall with the devices that patients already carry.
Smartphone cameras and artificial intelligence could move part of this assessment to the patient or to non-specialist staff, and the technology has matured quickly. Deep learning already matches specialist performance in image-based diagnosis in neighbouring fields, as in dermatology where a convolutional network classified skin lesions at dermatologist level.(8) Public image datasets for the diabetic foot, above all the diabetic foot ulcer challenge collections, have allowed dozens of models to be trained and compared on a common benchmark.(9) Several systematic reviews now report that deep learning achieves high accuracy for ulcer detection and classification, with summarized estimates that frequently exceed 90%.(10-14) A recent meta-analysis of deep learning for ulcer screening reported high pooled accuracy but also marked between-study inconsistency, and reviews of computer vision for wound care and of home-based monitoring describe a field moving from laboratory benchmarks toward mobile applications and remote follow-up while noting that most models were never tested prospectively in clinical populations.(11,15,16) Those reviews nevertheless combine tasks that differ in kind, including detection, segmentation and clinical risk prediction, and most stop before the most recent mobile deployments or do not separate smartphone-based tools from laboratory models. The accuracy that a clinician can expect from a smartphone system at the point of care therefore remains unclear, and this is the gap that the present review addresses. It does so by asking the question separately for smartphone tools and for laboratory models, because the two carry different deployment promises and different risks, and by reporting the task and the reference that each accuracy value describes.
The term diagnostic accuracy deserves precision in this field. A model that detects an ulcer in a curated image archive answers a different question from a tool that screens consecutive patients for the first sign of ulceration, and the two are frequently conflated in the primary studies. Sensitivity and specificity are the measures that a clinician needs to estimate the consequences of using a tool, yet most published models report accuracy or the F1 score instead, which depend on the prevalence of ulcers in the training collection.(17) The distinction matters because the same accuracy can hide a very different balance of missed ulcers and false alarms, and this is why the review recorded the measure that each study actually reported rather than converting one measure into another.
The objective was to synthesize the diagnostic accuracy of smartphone-based and artificial intelligence tools for diabetic foot screening relative to clinical assessment. Three questions guided the review. P1: how accurately do smartphone-based tools detect diabetic foot ulcers or high-risk feet compared with clinical judgement? P2: how accurately do artificial intelligence models applied to foot images classify ulcers and related tissue states? P3: which sources of heterogeneity explain the differences in accuracy reported across studies?
METHODS
The review followed PRISMA 2020(18) and, for the reporting of searches, PRISMA-S.(19)
Eligibility was defined with a PICOS framework and mapped to the questions. For P1 the index test was a smartphone-based tool, including mobile photography and mobile applications, and for P2 it was an artificial intelligence model such as a deep learning, machine learning or computer vision system applied to foot images. The population comprised people with diabetes mellitus at risk of, or already presenting, diabetic foot ulcers. The reference standard was clinical assessment by a specialist or an expert-labeled image dataset, and the outcome was sensitivity, specificity, accuracy, the area under the receiver operating characteristic curve, or an equivalent per-class measure. Original studies published between 2018 and 2026 in English were eligible, so that the window matched the bibliographic rules of the target journal. Reviews, editorials, protocols and conference abstracts without accuracy data were excluded. Tools whose index test relied on thermal or hyperspectral imaging were also excluded, because infrared thermography of the diabetic foot is covered by a separate review, and models that predicted ulcer risk from clinical variables alone, without image analysis, were excluded as a different class of test. The thermography exclusion was applied even when the thermal signal was fused with visible-light images, because the contribution of the thermal component could not be separated from the contribution of the photographic component in those reports. This last exclusion kept P2 focused on image-based tools rather than on tabular risk scores, and both exclusions were applied at the stage of title and abstract screening.
The bibliographic databases consulted were: Scopus, Pubmed, Google Scholar, Open Alex and Crossref.
For each included study the design, country, sample, index test, reference standard and accuracy estimates were extracted together with their location in the abstract or full text. Missing fields were not completed by assumption, and where a study did not report a given measure it was recorded as not reported. When several accuracy values were available, the value reported by the authors as the primary result was preferred, and the task and the class definition were recorded alongside it. Sensitivity and specificity were extracted when reported, and otherwise the reported accuracy, F1 score, area under the curve or mean average precision was recorded as the available measure. Where a study reported per-class values, the class-specific values were preserved rather than averaged, because the clinical questions behind ischemia, infection and depth are distinct. The same reviewer performed the extraction, and no second extractor was available to cross-check the values.
Risk of bias and applicability were assessed with QUADAS-2(20) across four domains: patient selection, index test, reference standard, and flow and timing. Each domain was rated as low, high or unclear using the signaling questions of the tool, and studies for which only the abstract was available were rated unclear in the domains that could not be inspected. Patient selection was judged against the presence of consecutive or random enrolment and the avoidance of inappropriate exclusions, and most image collections failed this test because they were assembled for model training rather than for diagnostic evaluation. The index test was judged against the prespecification of thresholds, and the reference standard against its independence from the index test and its ability to classify the target condition. Flow and timing captured whether the same reference was applied to all images and whether cross-validation respected patient-level independence, which matters in this literature because several authors reported image-level rather than patient-level splitting. The same assessment supported the interpretation of P1 and P2, because the pattern of risk did not differ systematically between the two groups of tools.
Accuracy estimates were tabulated separately for P1 and P2, and the reported values were compared within each question in ascending order of the magnitude of the primary estimate. Pooling was not attempted because the studies used different datasets, tasks, class definitions and metrics, and this heterogeneity was described narratively for P3 rather than quantified. A meta-analysis was judged inappropriate because the same accuracy value denoted different tasks in different studies, and a pooled estimate would have combined binary ulcer detection with four-class classification and severity grading, which would have produced a summary without a clinical meaning. The narrative synthesis therefore presents each study with its own task and reference, and the comparisons between studies are qualitative rather than statistical.
RESULTS
Study selection
The searches identified 963 records, and 316 duplicates were removed, leaving 647 records for screening (Figure 1). After title and abstract screening, 582 records were excluded and 65 reports were sought for retrieval. Full text was not retrievable for 43 reports. Of the 22 reports assessed for eligibility, 3 were excluded and 19 studies were included in the review. Five of the included studies were assessed from their abstract because the full text was not openly accessible. The exclusions at title and abstract were dominated by reviews and by tools that were not image-based, and the three exclusions at full text corresponded to two reviews, one non-imaging prediction model and one infrared thermography study. The search was deliberately broad, which explains why the majority of records were discarded at screening and why the final set of 19 studies is small relative to the number of records identified. Nineteen studies were ultimately included.
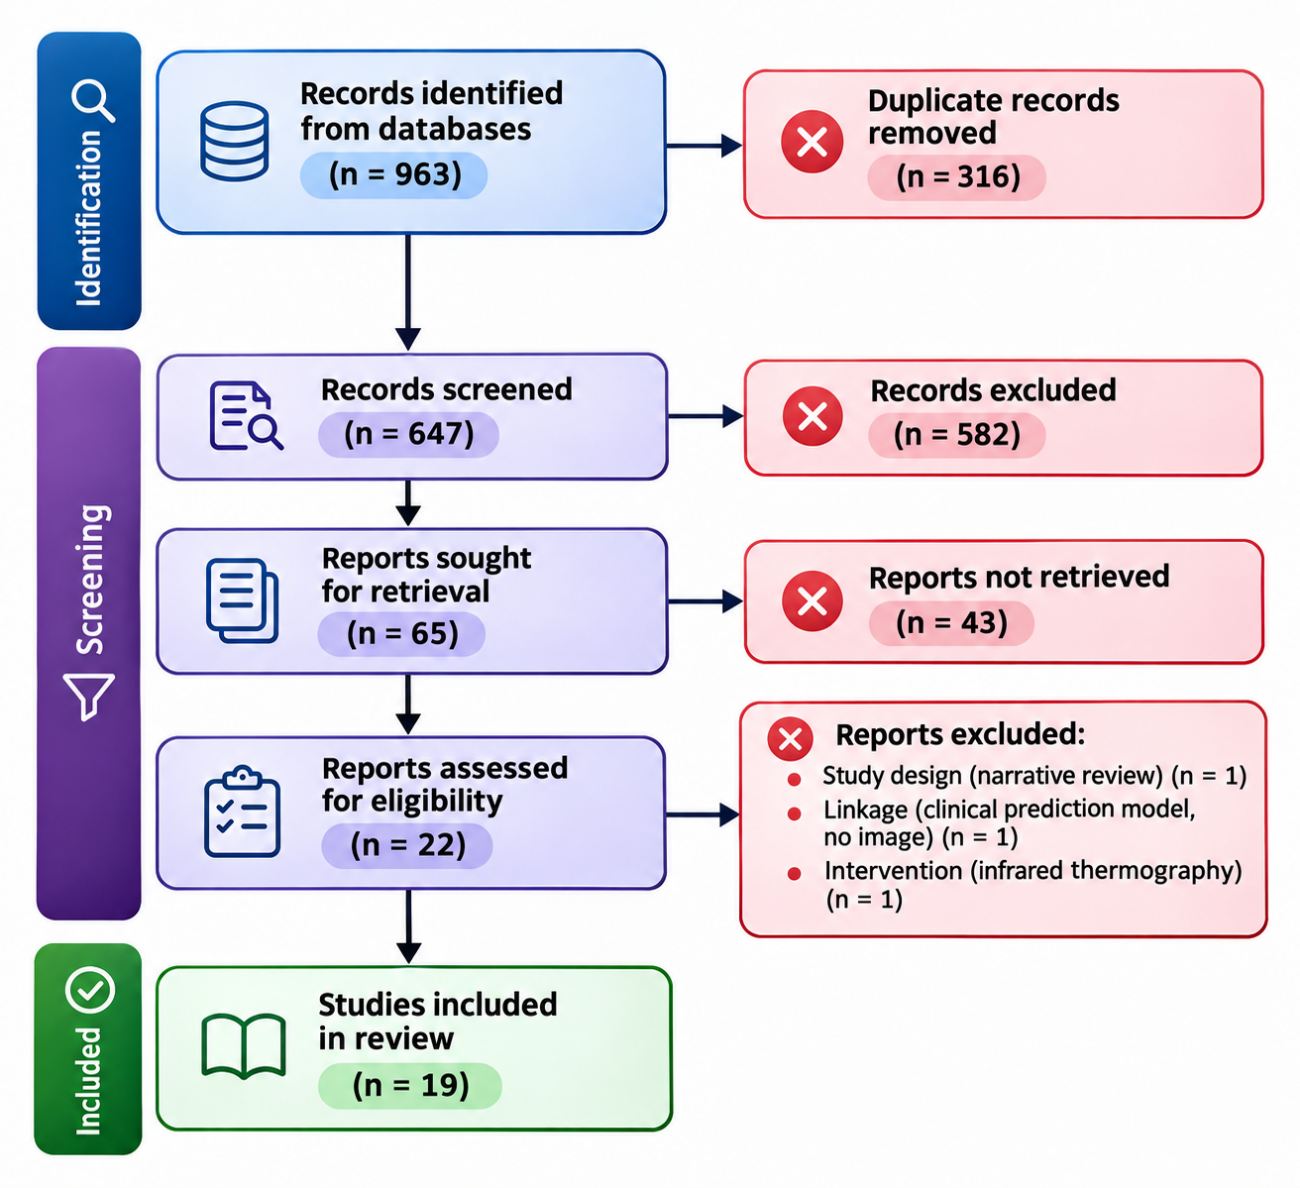
Figure 1. PRISMA 2020 flow diagram for the study selection.
Characteristics of the included studies
The characteristics of the 19 included studies are summarized in (Table 1). The studies were published between 2019 and 2026, and none predated 2019. Eight studies evaluated smartphone-based or mobile tools and eleven evaluated artificial intelligence models on research image datasets. Sample sizes ranged from 1,055 images in a comparative study of transfer-learning architectures to 6,500 images in a hybrid segmentation and classification pipeline, and one prospective clinical evaluation enrolled 81 patients who contributed 203 photographs. The diabetic foot ulcer challenge datasets of 2020 and 2021 were the most common image sources, and expert image labels served as the reference standard in most studies. The tasks varied from binary ulcer detection and infection classification to four-class and seven-class grading, and the reported primary measures varied accordingly between accuracy, sensitivity, the area under the curve, the F1 score and mean average precision. The studies were set in the United Kingdom, China, India, Bangladesh, Saudi Arabia, Indonesia, Iran, Iraq, Singapore, Mexico and Pakistan, with two studies not reporting the country, and the dominant design was retrospective model development on existing image collections. Reporting was heterogeneous, and only a minority of studies described their reference labels in enough detail to reproduce them, which is reflected in the risk of bias ratings described next. No included study predated 2019.
Study | Country | Sample | Index test | Reference standard |
|---|---|---|---|---|
Goyal et al. 2019(21) | United Kingdom | 1,775 DFU images | Faster R-CNN (InceptionV2), smartphone and embedded device | Two medical experts |
Cassidy et al. 2022(22) | United Kingdom | DFUC 2020 images | Cloud deep learning classifier, mobile application | Expert-labeled images |
Sendilraj et al. 2024(23) | Not reported | DFUC 2020 and 2021 images | DFUCare platform for detection, infection and ischemia | Expert-labeled images |
Nagaraju et al. 2023(24) | India | DFU image dataset | Optimal deep learning model | Expert-labeled images |
Wang et al. 2024(25) | China | 3,000 DFU images | Few-shot deep ResNet with transfer learning | Expert-labeled images |
Sarmun et al. 2024(26) | Bangladesh | DFUC 2020 images | YOLOv8m and Faster R-CNN ResNet101 ensemble | Expert-labeled images |
Karthik et al. 2025(27) | India | DFUC 2021 images | Swin transformer with multi-scale attention | Expert-labeled images |
Debnath et al. 2025(28) | India | DFUC 2020 images | DFU MobileNet stacked convolution network | Expert-labeled images |
Almufadi et al. 2024(29) | Saudi Arabia | DFU-Part(B) images | E-DFu-Net convolutional network | Expert-labeled images |
Abdullah et al. 2026(30) | Mexico and Pakistan | 3,739 foot images | Multi-task CNN-transformer, mobile deployment | Expert-labeled seven classes |
Hendry et al. 2026(31) | Indonesia | 6,500 DFU images | U-Net with EfficientNet-B3 classifier | Wagner-graded expert labels |
Bhuiyan et al. 2026(32) | Bangladesh | DFU image dataset | DFU-GCNet inception network | Expert-labeled images |
Vina et al. 2026(33) | India | DFU image dataset | GAN-LSTM synthesis with CNN-LSTM classifier | Expert-labeled images |
Abdullah et al. 2026(34) | Not reported | DFUC 2021 and 1,600 real-world images | Hybrid self-supervised classifier, mobile deployment | Expert labels and clinician audit |
Cassidy et al. 2023(35) | United Kingdom | 81 patients, 203 photographs | Smartphone artificial intelligence system | Expert clinician judgement |
Mostafavi et al. 2026(36) | Iran | 996 DFU images | MobileNetV3 mobile application | Clinician-labeled SINBAD components |
Kadhim et al. 2026(37) | Iraq | 1,055 foot images | ResNet50 among five transfer-learning models | Expert-labeled images |
Teoh et al. 2026(38) | Singapore | 1,215 images, 27 participants | YOLOv5, autoencoder and DenseNet201 mobile app | Expert labels and clinical participants |
Yogapriya et al. 2022(39) | India | DFU images | DFINET 22-layer network | Expert-labeled infection status |
Note: DFU = diabetic foot ulcer; DFUC = diabetic foot ulcer challenge dataset; mAP = mean average precision.
Risk of bias
Risk of bias was assessed with QUADAS-2 and is presented by domain in (Table 2). Patient selection was at high risk in 15 studies and unclear in 4, because most cohorts were retrospective convenience image sets without consecutive enrolment and without a described sampling frame. The index test was at low risk in all 19 studies, since the automated tools applied a prespecified threshold or an internal decision rule and did not depend on reader interpretation. The reference standard was at low risk in 3 studies, which used expert clinician judgement or an independent clinician audit, and unclear in 16, where the expert labels were not described in enough detail to judge their independence from the index test. Flow and timing was at high risk in 14 studies, largely because cross-validation with image-level splitting could leak information from the same patient across folds, and unclear in 4. The index test was at low risk in all 19 studies. The overall pattern is the one expected of a young field: the measurement itself is reproducible, but the people, the reference labels and the evaluation flow are the weak points, and these are the domains that a reader should discount when interpreting the headline accuracy values. No study was rated at low risk of bias in every domain, which means that no individual accuracy estimate in this review can be accepted at face value.
Study | PS | IT | RS | FT |
|---|---|---|---|---|
Goyal et al. 2019(21) | H | L | U | H |
Cassidy et al. 2022(22) | H | L | U | H |
Sendilraj et al. 2024(23) | H | L | U | U |
Nagaraju et al. 2023(24) | H | L | U | H |
Wang et al. 2024(25) | H | L | U | H |
Sarmun et al. 2024(26) | H | L | U | H |
Karthik et al. 2025(27) | H | L | U | H |
Debnath et al. 2025(28) | H | L | U | H |
Almufadi et al. 2024(29) | H | L | U | H |
Abdullah et al. 2026(30) | H | L | U | H |
Hendry et al. 2026(31) | H | L | U | H |
Bhuiyan et al. 2026(32) | H | L | U | H |
Vina et al. 2026(33) | H | L | U | H |
Abdullah et al. 2026(34) | U | L | L | U |
Cassidy et al. 2023(35) | U | L | L | L |
Mostafavi et al. 2026(36) | U | L | L | U |
Kadhim et al. 2026(37) | H | L | U | H |
Teoh et al. 2026(38) | U | L | U | U |
Yogapriya et al. 2022(39) | H | L | U | H |
Note: L = low risk, H = high risk, U = unclear. Domains: PS = patient selection, IT = index test, RS = reference standard, FT = flow and timing.
Smartphone systems detected ulcers against expert judgement
With respect to P1, the accuracy of the eight smartphone-based tools is presented in (Table 3). The only prospective clinical evaluation examined a smartphone artificial intelligence system in 81 patients whose 203 photographs were compared with expert clinician judgement, and the system reached a sensitivity of 91.6% and a specificity of 88.6%, with specificity rising to 92.4% when intersecting predictions were merged.(35) Inter-rater and intra-rater agreement among clinicians on the adequacy of the system was also high in that study, which reported a K-alpha above 0.80 for all comparisons. A mobile application that classified the five SINBAD components achieved F1 scores of 93.1% for infection and 89.8% for ulcer area, falling to 61.6% for depth, with recalls of 96.2%, 98.2% and 94.5% for the same components.(36) A mobile application for deformity screening detected callus, hallux valgus and hammer toe with 91.1% internal accuracy, which decreased to 85.2% in 27 external participants, and its final evaluation reported 88.6% accuracy with 90.5% precision and an F1 of 86.1%.(38) Real-time detection on a smartphone reached a mean average precision of 91.8% in 1,775 images, and a cloud framework with a mobile application reached the same localization value on the 2020 challenge set.(21,22) A hybrid self-supervised model evaluated on 1,600 real-world images with an independent clinician audit reported sensitivity of 99.9% and specificity of 99.9%, and a multi-task model for seven-class triage reached 96.3% accuracy with a macro F1 of 0.953 on 3,739 images.(30,34) The DFUCare platform reported a detection F1 of 0.80 and an infection classification accuracy of 79.0%.(23) Taken together, the smartphone group contains two studies that reported sensitivity and specificity, one of them prospective, and six studies that reported localization or component-level measures, which is why the group cannot be summarized by a single sensitivity value. The smartphone group therefore provides one prospective sensitivity estimate, several localization benchmarks and a set of component-level results, but it does not yet provide the patient-level sensitivity and specificity estimates that would be needed to model a screening programme. The prospective sensitivity reached 91.6%.
Study | Tool | Sample | Sensitivity (%) | Specificity (%) | Other reported measures |
|---|---|---|---|---|---|
Cassidy et al. 2023(35) | Smartphone artificial intelligence system | 203 photographs | 91.6 | 88.6 (92.4 merged) | Prospective clinical evaluation |
Abdullah et al. 2026(34) | Hybrid self-supervised classifier, mobile | 1,600 real-world images | 99.9 | 99.9 | Accuracy 99.9%, clinician audit |
Mostafavi et al. 2026(36) | MobileNetV3 mobile application | 996 images | Not reported | Not reported | F1 93.1% infection, 61.6% depth |
Teoh et al. 2026(38) | Foot at Risk mobile application | 1,215 images | Not reported | Not reported | Accuracy 91.1% internal, 85.2% external |
Goyal et al. 2019(21) | Faster R-CNN on smartphone | 1,775 images | Not reported | Not reported | mAP 91.8% |
Cassidy et al. 2022(22) | Cloud classifier, mobile application | DFUC 2020 | Not reported | Not reported | mAP 91.8% |
Abdullah et al. 2026(30) | Multi-task CNN-transformer, mobile | 3,739 images | Not reported | Not reported | Accuracy 96.3%, macro F1 0.953 |
Sendilraj et al. 2024(23) | DFUCare platform | DFUC 2020 and 2021 | Not reported | Not reported | F1 0.80, infection accuracy 79.0% |
Note: DFU = diabetic foot ulcer; mAP = mean average precision; F1 = F1 score. Sensitivity and specificity are percentages.
Deep learning models classified ulcer states with high but variable accuracy
As for P2, the eleven artificial intelligence models are summarized in (Table 4). A stacked convolution network that classified infected skin against normal skin reported accuracy of 97.8% with sensitivity of 95.2% and specificity of 94.0%.(28) A transformer model for the four-class task of the 2021 challenge reached 78.3% accuracy and a macro F1 of 78.0%, with per-class accuracy of 74% for combined states, 71% for infection, 52% for ischemia and 66% for no finding.(27) A generative framework with a CNN-LSTM classifier reached 87.0% accuracy with an area under the curve of 0.885 on a held-out test set, and the same classifier trained only on synthetic images reached the same 87.0% accuracy.(33) Networks specialized for ischemia and infection reached 97.0% and 92.0% accuracy respectively.(29) Several pipelines reported values above 97.0%, including a global context inception network with 97.2% accuracy and an area under the curve of 0.99, and an optimal deep learning model with 99.3% accuracy.(24,32) A few-shot ResNet reached 98.7% average accuracy across three severity classes in 3,000 images, and a hybrid U-Net and EfficientNet pipeline reached 92.3% accuracy with an intersection over union of 0.861 for Wagner grading.(25,31) An ensemble for ulcer localization reported a mean average precision of 86.7% with an area under the curve of 0.97.(26) A comparative study of five architectures reported a mean F1 of 0.997 and an area under the curve of 1.000 for its best model, and an infection network reached 92.0% accuracy with a Matthews correlation coefficient of 0.84.(37,39) The spread within the group is large enough that a single summary would mislead, and the values are therefore better understood in relation to the task each model was asked to perform. The group spans the full range from the modest four-class result to near-perfect binary scores, and that span, rather than any single value, is the honest summary of what these models currently achieve. The highest reported accuracy was 99.9%.
Study | Task | Sample | Accuracy (%) | Other reported measures |
|---|---|---|---|---|
Nagaraju et al. 2023(24) | Detection and classification | DFU dataset | 99.3 | AUC 0.99 |
Wang et al. 2024(25) | Severity classification | 3,000 images | 98.7 | Three severity classes |
Sarmun et al. 2024(26) | Localization | DFUC 2020 | Not reported | mAP 86.7, AUC 0.97 |
Karthik et al. 2025(27) | Four-class classification | DFUC 2021 | 78.3 | Macro F1 78.0% |
Debnath et al. 2025(28) | Ulcer versus normal skin | DFUC 2020 | 97.8 | Sensitivity 95.2%, specificity 94.0% |
Almufadi et al. 2024(29) | Ischemia and infection | DFU-Part(B) | 97.0 ischemia, 92.0 infection | Binary classification |
Hendry et al. 2026(31) | Wagner severity grades | 6,500 images | 92.3 | IoU 0.861, AUC 0.9 |
Bhuiyan et al. 2026(32) | Classification | DFU dataset | 97.2 | AUC 0.99 |
Vina et al. 2026(33) | Synthetic augmentation and classification | DFU dataset | 87.0 | AUROC 0.885 |
Kadhim et al. 2026(37) | Classification | 1,055 images | Not reported | F1 0.997, AUC 1.000 |
Yogapriya et al. 2022(39) | Infection versus no infection | DFU images | 92.0 | MCC 0.84 |
Note: DFU = diabetic foot ulcer; AUC = area under the receiver operating characteristic curve; F1 = F1 score; MCC = Matthews correlation coefficient; mAP = mean average precision.
Accuracy varied with dataset, task and reference standard rather than with architecture
Regarding P3, three sources of heterogeneity explained most of the spread in the reported values. The first was the dataset, because models evaluated on the multi-class 2021 challenge task underperformed those evaluated on cleaner binary tasks drawn from the 2020 set, as the 78.3% accuracy of the transformer model on four classes illustrates.(27) The second was the clinical task itself, since infection and ischemia classification, ulcer detection and severity grading are different problems that do not share a common reference definition, and the same network family returned 97.0% for ischemia but 92.0% for infection.(29) The third was the reference standard, which ranged from prospective expert clinician judgement in one study to retrospectively labeled challenge images in most others, and only three studies used an independent clinical or clinician-audited standard.(34,35) Study design interacted with all three sources, because the prospective study and the clinician-audited models reported values closer to the middle of the range than the internally validated benchmarks. No study compared two tools head-to-head against the same clinical reference, so no pooled estimate was computed and no meta-analysis was justified. Reporting itself contributed to the heterogeneity, because a study that reported the area under the curve could not be placed on the same scale as a study that reported the F1 score, and the choice of measure was not consistent across the field. A reader who wants to compare the tools must therefore compare them within task and measure, which is what the two tables of this review allow. The spread between the lowest and the highest accuracy was 21.6 percentage points.
DISCUSSION
The question that opened this review was whether smartphone and artificial intelligence tools can screen the diabetic foot accurately enough to substitute or extend clinical judgement. The answer is qualified: the tools reach high accuracy, but the evidence rests on retrospective image datasets rather than on prospective clinical verification. This distinction is the central finding, and it reappears under each of the three research questions.
With respect to P1, smartphone-based tools detected ulcers and high-risk feet with sensitivity and specificity that approached expert judgement in the single prospective evaluation, where a smartphone system reached 91.6% sensitivity and 88.6% specificity in 81 patients.(35) This aligns with the telemedicine literature, in which smartphone photography for wound assessment reproduces specialist decisions in most cases, and with the high sensitivity reported for smartphone-based retinal screening in diabetes.(40) Conversely, the remaining smartphone studies reported localization or component-level measures rather than patient-level sensitivity, which limits the confidence that can be placed in the headline values beyond the single clinical cohort.(21,22) The gap between 85.2% external accuracy for a deformity application and 99.9% accuracy in a clinician-audited model illustrates how much the deployment setting changes the estimate.(34,38) The component-level pattern is also informative, because the SINBAD application classified infection and area well but depth poorly, which indicates that the tools reproduce the visible parts of the assessment and struggle with the parts that require tissue-level judgement.(36) The high agreement among clinicians on the adequacy of the smartphone system is itself notable, because it indicates that the automated judgement was intelligible to the specialists who would have to act on it, an aspect of diagnostic tools that accuracy alone does not capture.(35) The clinical value of P1 therefore rests on one well-conducted study, and the remaining mobile tools are better described as promising than as validated.
As for P2, artificial intelligence models reached accuracy values from 78.3% to 99.9%, with the higher values concentrated in binary or curated tasks and the lower value in the four-class challenge task.(27,28) This range is consistent with previous systematic reviews, which summarized deep learning accuracy for ulcer detection and classification as high but heterogeneous, and with the broader diagnostic accuracy of deep learning in medical imaging.(11,12,41) The near-perfect estimates reported in several of the included models, such as an area under the curve of 1.000 in one comparative architecture, are unlikely to generalize because image-level cross-validation can leak information from the same patient across folds.(37) The same concern was raised explicitly by the authors of that study, and it is reinforced by the QUADAS-2 finding that flow and timing was at high risk in 14 studies. Conversely, the models that incorporated an external clinician audit or a real-world image set reported more modest but more credible values, which suggests that architecture choice matters less than the evaluation design.(34) Reviews of deep learning for segmentation and for computer vision in ulcer care draw the same conclusion, namely that reported accuracy exceeds what would be expected once models face uncurated images.(15,42) The four-class result of 78.3% is arguably the most realistic benchmark, because it reflects the diagnostic categories that a clinician actually distinguishes rather than a simplified ulcer versus normal contrast. Its per-class pattern is also clinically instructive: ischemia was the class most often misclassified, which is exactly the distinction that carries the greatest prognostic weight in the diabetic foot and the one that monofilament and Doppler assessment are designed to capture.(27)
A comparison with the wider machine learning literature places these numbers in perspective. In a systematic review of deep learning against health-care professionals across medical imaging, the diagnostic performance of algorithms was on average similar to that of clinicians, but the underlying studies rarely met the reporting standards of diagnostic accuracy research, and few were prospective.(41) The same pattern is visible here: the included models rival the accuracy of specialist readers on their own test sets, yet the evaluations would not satisfy a strict diagnostic accuracy framework, and the estimates are therefore best read as upper bounds on what a deployed system would achieve.(17) This does not diminish the engineering progress, but it changes what the numbers are evidence for.
Regarding P3, heterogeneity was driven by dataset, task and reference standard rather than by the model family. Models evaluated on the 2020 challenge performed differently from those on the 2021 multi-class set, and tasks as different as ulcer detection, infection classification and severity grading cannot be pooled into a single estimate without obscuring these differences.(9,13) This explains why the earlier reviews reached different summary figures, and why the present review chose narrative synthesis over meta-analysis.(10,14) A further source of variability is the absence of a common clinical reference, since expert image labels are not the same standard as an in-person specialist examination, and the two were rarely compared directly.(20) Home-based monitoring reviews reach a parallel conclusion, in that feasibility is often demonstrated while diagnostic agreement with a clinician is not.(16) Until a shared reference and a shared task definition are adopted, each new model will continue to report against a different yardstick, and between-study comparisons will remain descriptive.
The reliance on a small number of public benchmark datasets is itself a structural weakness. When most of the included models are trained and tested on the 2020 and 2021 diabetic foot ulcer challenge collections, the reported accuracy describes performance on those collections more than performance in the clinic, and successive models may overfit the idiosyncrasies of the benchmark rather than the disease.(9) The systematic reviews of deep learning in medical imaging warn that few of these studies are prospective, which means the published scores overstate what a deployed system would achieve.(41) A healthier evaluation culture would combine the benchmark with a small prospective clinical cohort, as the single clinical study and the clinician-audited models already do, so that every new architecture is measured against patients rather than only against pixels.(34,35)
The implications for low-resource settings, where structured screening is least available, cut in both directions. On one hand, a smartphone tool that reaches 91.6% sensitivity against expert judgement is precisely the kind of support that a non-specialist health worker or a patient at home could use between clinic visits, and the cloud and mobile deployments reviewed here show that the computation is no longer the bottleneck.(22,35) On the other hand, the same settings are where a false-negative result carries the greatest cost, because there is no specialist to catch the error, and the prevalence-dependent accuracy measures that dominate this literature do not answer the question of how many ulcers would be missed in a real screening cascade.(1) The external validation of the deformity application, which fell from 91.1% to 85.2% when moved to new participants, is a concrete warning that performance decays exactly when a tool leaves the environment in which it was trained.(38) Any deployment in routine screening should therefore include a mechanism for clinician review of negative results and a plan for measuring downstream outcomes, not only image-level accuracy.
The strengths of this review are the separation of smartphone tools from laboratory models, the question-driven structure, and the restriction to studies that reported an accuracy measure against a reference standard. The question-driven organization also tied each finding to the question it answers, which reduces the temptation to generalize from a curated benchmark to the clinic. The limitations are substantial and each carries a recommendation. Most included studies were retrospective image classification exercises, so estimates should be re-examined in prospective cohorts that enrol consecutive patients. Five studies were assessed from abstracts because the full text was not openly accessible, and their domains were rated unclear; future updates should retrieve those full texts. The absence of reported sensitivity and specificity in most studies forced the synthesis to rely on accuracy and related measures, which are prevalence-dependent and cannot be compared directly across samples. Publication and selective reporting are plausible, because the models that reached the highest internal accuracy may be precisely those most likely to be written up, and the review could not test for this.
For practice, the evidence supports using smartphone and artificial intelligence tools as an adjunct to, rather than a replacement for, structured clinical examination. The single prospective study and the clinician-audited models indicate that the technology is close to deployable, but the absence of standardized reporting and external validation means that local verification should precede routine use, and that verification should be reported in a way that lets others judge whether the local population resembles the one in which the tool was trained.(43) A cautious deployment would begin with ulcer detection as a triage aid in services that already perform structured screening, where the tool can shorten the queue rather than replace the examiner, and would expand only after its sensitivity and specificity are measured in that local population.(5) For research, the priority is a prospective comparison of the same tools against the same clinical reference, reported with sensitivity, specificity and confidence intervals in line with diagnostic accuracy standards.(17) The reporting of the included studies rarely followed such standards, and the field would benefit from adopting them before further benchmark proliferation. A shared checklist for reporting the reference labels, the splitting strategy and the target condition would cost little, would make the next generation of studies directly comparable with one another, and would spare clinicians the task of guessing how a reported accuracy value was produced. What remains open is whether the accuracy observed on images translates into earlier detection, fewer amputations and cost-effective screening when the tools are placed in the hands of patients and non-specialist staff, and no included study answered that question. Answering it will require a study design that follows patients over time rather than measuring a single image-level judgement, and that longitudinal design, with patient outcomes rather than image pixels as the endpoint, is the natural next step for this field of research.
CONCLUSIONS
Smartphone-based tools detected diabetic foot ulcers with high sensitivity in a prospective clinical evaluation, although most supporting evidence remained retrospective. Artificial intelligence models classified ulcer and tissue states with accuracy that ranged from 78.3% to 99.9% depending on dataset, task and reference standard. The observed heterogeneity indicates that prospective external validation against a common clinical reference is required before these tools enter routine screening.
References
- 1 Armstrong DG, Tan TW, Boulton AJM, Bus SA. Diabetic Foot Ulcers. JAMA. 2023;330(1):62. doi: 10.1001/jama.2023.10578
- 2 Armstrong DG, Boulton AJM, Bus SA. Diabetic Foot Ulcers and Their Recurrence. N Engl J Med. 2017;376(24):2367-2375. doi: 10.1056/nejmra1615439
- 3 Zhang P, Lu J, Jing Y, Tang S, Zhu D, Bi Y. Global epidemiology of diabetic foot ulceration: a systematic review and meta-analysis. Annals of Medicine. 2017;49(2):106-116. doi: 10.1080/07853890.2016.1231932
- 4 Mishra SC, Chhatbar KC, Kashikar A, Mehndiratta A. Diabetic foot. BMJ. 2017;359:j5064. doi: 10.1136/bmj.j5064
- 5 Schaper NC, van Netten JJ, Apelqvist J, Bus SA, Hinchliffe RJ, Lipsky BA, et al. Practical Guidelines on the prevention and management of diabetic foot disease (IWGDF 2019 update). Diabetes Metabolism Res. 2020;36(S1):e3266. doi: 10.1002/dmrr.3266
- 6 van Netten JJ, Bus SA, Apelqvist J, Lipsky BA, Hinchliffe RJ, Game F, et al. Definitions and criteria for diabetic foot disease. Diabetes Metabolism Res. 2020;36(S1):e3268. doi: 10.1002/dmrr.3268
- 7 Maldonado-Valer T, Pareja-Mujica LF, Corcuera-Ciudad R, Terry-Escalante FA, Chevarría-Arriaga MJ, Vasquez-Hassinger T, et al. Prevalence of diabetic foot at risk of ulcer development and its components stratification according to the international working group on the diabetic foot (IWGDF): A systematic review with metanalysis. PLoS ONE. 2023;18(11):e0284054. doi: 10.1371/journal.pone.0284054
- 8 Esteva A, Kuprel B, Novoa RA, Ko J, Swetter SM, Blau HM, et al. Dermatologist-level classification of skin cancer with deep neural networks. Nature. 2017;542(7639):115-118. doi: 10.1038/nature21056
- 9 Yap MH, Hachiuma R, Alavi A, Brüngel R, Cassidy B, Goyal M, et al. Deep learning in diabetic foot ulcers detection: A comprehensive evaluation. Computers in Biology and Medicine. 2021;135:104596. doi: 10.1016/j.compbiomed.2021.104596
- 10 Anggreni NKIS, Kristianto H, Handayani D, Yueniwati Y, Irawan PLT, Rosandi R, et al. Artificial Intelligence for Diabetic Foot Screening Based on Digital Image Analysis: A Systematic Review. J Diabetes Sci Technol. 2026;20(4):1381-1388. doi: 10.1177/19322968251317521
- 11 Zhao T, Yu J, Deng R, Ding L, Li X, Mi J. Accuracy of deep learning for risk prediction and screening of diabetic foot Ulcers: A systematic review and meta-analysis. Diabetes Research and Clinical Practice. 2026;236:113262. doi: 10.1016/j.diabres.2026.113262
- 12 Alhasson HF, Alharbi SS. Advances in Image-Based Diagnosis of Diabetic Foot Ulcers Using Deep Learning and Machine Learning: A Systematic Review. Biomedicines. 2025;13(12):2928. doi: 10.3390/biomedicines13122928
- 13 Weatherall T, Avsar P, Nugent L, Moore Z, McDermott JH, Sreenan S, et al. The impact of machine learning on the prediction of diabetic foot ulcers – A systematic review. Journal of Tissue Viability. 2024;33(4):853-863. doi: 10.1016/j.jtv.2024.07.004
- 14 Dhanawade V, Jain SA, Pathak S, Sajja P, Bhandari S. Deep learning innovations for diabetic foot ulcers analysis: a systematic review of segmentation and classification techniques. Int J Diabetes Dev Ctries. 2026. doi: 10.1007/s13410-026-01742-8
- 15 Baseman C, Fayfman M, Schechter MC, Ostadabbas S, Santamarina G, Ploetz T, et al. Intelligent Care Management for Diabetic Foot Ulcers: A Scoping Review of Computer Vision and Machine Learning Techniques and Applications. J Diabetes Sci Technol. 2025;19(3):820-829. doi: 10.1177/19322968231213378
- 16 Kairys A, Pauliukiene R, Raudonis V, Ceponis J. Towards Home-Based Diabetic Foot Ulcer Monitoring: A Systematic Review. Sensors. 2023;23(7):3618. doi: 10.3390/s23073618
- 17 Aggarwal R, Sounderajah V, Martin G, Ting DSW, Karthikesalingam A, King D, et al. Diagnostic accuracy of deep learning in medical imaging: a systematic review and meta-analysis. npj Digit Med. 2021;4(1):65. doi: 10.1038/s41746-021-00438-z
- 18 Page MJ, McKenzie JE, Bossuyt PM, Boutron I, Hoffmann TC, Mulrow CD, et al. The PRISMA 2020 statement: an updated guideline for reporting systematic reviews. BMJ. 2021:n71. doi: 10.1136/bmj.n71
- 19 McInnes MDF, Moher D, Thombs BD, McGrath TA, Bossuyt PM, and the PRISMA-DTA Group, et al. Preferred Reporting Items for a Systematic Review and Meta-analysis of Diagnostic Test Accuracy Studies. JAMA. 2018;319(4):388. doi: 10.1001/jama.2017.19163
- 20 Whiting PF, Rutjes AWS, Westwood ME, Mallett S, Deeks JJ, Reitsma JB, et al. QUADAS-2: A Revised Tool for the Quality Assessment of Diagnostic Accuracy Studies. Ann Intern Med. 2011;155(8):529-536. doi: 10.7326/0003-4819-155-8-201110180-00009
- 21 Goyal M, Reeves ND, Rajbhandari S, Yap MH. Robust Methods for Real-Time Diabetic Foot Ulcer Detection and Localization on Mobile Devices. IEEE J Biomed Health Inform. 2019;23(4):1730-1741. doi: 10.1109/jbhi.2018.2868656
- 22 Cassidy B, Reeves ND, Pappachan JM, Ahmad N, Haycocks S, Gillespie D, et al. A Cloud-Based Deep Learning Framework for Remote Detection of Diabetic Foot Ulcers. IEEE Pervasive Comput. 2022;21(2):78-86. doi: 10.1109/mprv.2021.3135686
- 23 Sendilraj V, Pilcher W, Choi D, Bhasin A, Bhadada A, Bhadadaa SK, et al. DFUCare: deep learning platform for diabetic foot ulcer detection, analysis, and monitoring. Front Endocrinol. 2024;15:1386613. doi: 10.3389/fendo.2024.1386613
- 24 Nagaraju S, Kumar KV, Rani BP, Lydia EL, Ishak MK, Filali I, et al. Automated Diabetic Foot Ulcer Detection and Classification Using Deep Learning. IEEE Access. 2023;11:127578-127588. doi: 10.1109/access.2023.3332292
- 25 Wang C, Yu Z, Long Z, Zhao H, Wang Z. A few-shot diabetes foot ulcer image classification method based on deep ResNet and transfer learning. Sci Rep. 2024;14(1):29877. doi: 10.1038/s41598-024-80691-w
- 26 Sarmun R, Chowdhury MEH, Murugappan M, Aqel A, Ezzuddin M, Rahman SM, et al. Diabetic Foot Ulcer Detection: Combining Deep Learning Models for Improved Localization. Cogn Comput. 2024;16(3):1413-1431. doi: 10.1007/s12559-024-10267-3
- 27 Karthik R, Ajay A, Jhalani A, Ballari K, K S. An explainable deep learning model for diabetic foot ulcer classification using swin transformer and efficient multi-scale attention-driven network. Sci Rep. 2025;15(1):4057. doi: 10.1038/s41598-025-87519-1
- 28 Debnath S, Khurana A, Senbagavalli M, Naik S, Chandra Patni J, Mishra PK, et al. Sustainable AI for diabetic foot ulcer detection: a deep learning approach for early diagnosis. Discov Appl Sci. 2025;7(9):1012. doi: 10.1007/s42452-025-07601-1
- 29 F. Almufadi N, F. Alhasson H, S. Alharbi S. E-DFu-Net: An efficient deep convolutional neural network models for Diabetic Foot Ulcer classification. Biomol Biomed. 2024;25(2):445-460. doi: 10.17305/bb.2024.11117
- 30 Abdullah, Ather MA, Fatima Z, Oropeza Rodríguez JL. A severity-aware multi-task CNN-transformer framework for explainable diabetic foot ulcer triage and mobile deployment. Front Artif Intell. 2026;9:1795751. doi: 10.3389/frai.2026.1795751
- 31 Hendry, Irwan Sembiring, Soleh O, Indrajani Sutedja. Hybrid Deep Learning Framework for Diabetic Wound Assessment: Integrating Segmentation, Classification, and Explainable AI in Cloud-Based Telemedicine Systems. JAIT. 2026;6:356-368. doi: 10.37965/jait.2026.0964
- 32 Bhuiyan MTA, Rahman MA, Noori FM, Uddin MZ, Masum AKM. DFU-GCNet: a global context-enhanced inception network for robust and interpretable diabetic foot ulcer classification. Front Digit Health. 2026;8:1811311. doi: 10.3389/fdgth.2026.1811311
- 33 Vina A, Prajasree G, Venkatesh S, Sankaranarayanan S, Meenakshi K, Khan AR, et al. Hybrid GAN-LSTM framework for diabetic foot ulcer image synthesis and automated diagnosis. Front Med. 2026;13:1742345. doi: 10.3389/fmed.2026.1742345
- 34 Abdullah, Ather MA, Fatima Z, Rodríguez JLO, Sosa OE. Explainable and clinically audited hybrid self-supervised framework for multi-class DFU classification and mobile deployment. Sci Rep. 2026;16(1):34107. doi: 10.1038/s41598-026-55510-z
- 35 Cassidy B, Hoon Yap M, Pappachan JM, Ahmad N, Haycocks S, O'Shea C, et al. Artificial intelligence for automated detection of diabetic foot ulcers: A real-world proof-of-concept clinical evaluation. Diabetes Research and Clinical Practice. 2023;205:110951. doi: 10.1016/j.diabres.2023.110951
- 36 Mostafavi F, Das SK, Amini MR, Mehrabi Y, Toutounchi M, Nazari SSH. Automating wound assessment: convolutional neural network-based mobile application for SINBAD classification system. J Diabetes Metab Disord. 2025;25(1):15. doi: 10.1007/s40200-025-01816-0
- 37 Rania Kadhim, Ahmad Lateef, Mohammed Kamil. Explainable Deep Learning for Diabetic Foot Ulcer Diagnosis: A Comparative CNN Framework. Adv technol innov. 2026;11(4):426-438. doi: 10.46604/aiti.2026.16496
- 38 Teoh KL, Hari KS, Ng LL, Lo ZJ. Validation of a Trained AI Imaging Model for Detecting Diabetic Foot Deformities. International Wound Journal. 2026;23(2):e70821. doi: 10.1111/iwj.70821
- 39 Yogapriya J, Chandran V, Sumithra MG, Elakkiya B, Shamila Ebenezer A, Suresh Gnana Dhas C. Automated Detection of Infection in Diabetic Foot Ulcer Images Using Convolutional Neural Network. Journal of Healthcare Engineering. 2022;2022:1-12. doi: 10.1155/2022/2349849
- 40 Malerbi FK, Mendes G, Barboza N, Morales PH, Montargil R, Andrade RE. Diabetic Macular Edema Screened by Handheld Smartphone-based Retinal Camera and Artificial Intelligence. J Med Syst. 2022;46(1):8. doi: 10.1007/s10916-021-01795-8
- 41 Liu X, Faes L, Kale AU, Wagner SK, Fu DJ, Bruynseels A, et al. A comparison of deep learning performance against health-care professionals in detecting diseases from medical imaging: a systematic review and meta-analysis. The Lancet Digital Health. 2019;1(6):e271-e297. doi: 10.1016/s2589-7500(19)30123-2
- 42 Aldhubiea H, Fetais N, Newaz M, Islam MSB, Chowdhury MEH, Suganthan PN, et al. Deep learning for diabetic foot ulcer: a systematic review of segmentation, classification and multimodal integration. Cluster Comput. 2026;29(14):826. doi: 10.1007/s10586-026-06619-3
- 43 Bossuyt PM, Reitsma JB, Bruns DE, Gatsonis CA, Glasziou PP, Irwig L, et al. STARD 2015: an updated list of essential items for reporting diagnostic accuracy studies. BMJ. 2015:h5527. doi: 10.1136/bmj.h5527
Declarations
Funding
No financing
Conflict of interest
None
Authorship contributions
Drafting – original draft: Oscar Alfredo Cabrera, Francis Feldick, Sheila Ailin Cabrera, Erica Cecilia Delbon.
Writing–review and editing: Oscar Alfredo Cabrera, Francis Feldick, Sheila Ailin Cabrera, Erica Cecilia Delbon.