
Abstract
Introduction: Onychomycosis is common in older adults and in diabetes, and podiatrists are frequent first-line providers of nail care, yet little is known about their topical antifungal prescribing in Medicare Part D. Methods: We used the Centers for Medicare and Medicaid Services Part D Prescribers by Provider and Drug public use files for 2014 through 2024, selecting records with podiatry as the prescriber specialty and efinaconazole, tavaborole or ciclopirox as the generic drug. Annual claims, 30-day fills and spending were estimated, log-linear time trends were fitted, and state-level per-beneficiary costs were described for 2024. Results: Annual claims increased from 134,117 to 348,043 and drug costs from 7.7 to 58.1 million USD. Thirty-day fills grew by 9.3% per year (95% CI 7.1-11.5). The share of branded agents rose from 0.1% to 14.3% (<0.001), while ciclopirox remained dominant (85.7%). Per-beneficiary costs varied widely across states (coefficient of variation 103.8%) and correlated with branded share (r = 0.94). Conclusions: Topical antifungal prescribing by podiatrists in Medicare Part D grew steadily and shifted modestly toward branded agents, with large between-state cost variation driven by drug mix.
Keywords
onychomycosis, antifungal agents, podiatry, Medicare Part D, drug costs, practice patterns, physicians'
INTRODUCTION
Onychomycosis is a chronic fungal infection of the nail plate and nail bed caused mainly by dermatophytes, with yeasts and non-dermatophyte molds contributing in specific populations.(1) It affects roughly one in ten adults in community-based estimates, and its prevalence rises with age, diabetes, immunosuppression and peripheral vascular disease. Tinea pedis frequently coexists with and precedes nail involvement, so the two conditions are often managed together.(2) The infection is more than a cosmetic problem: it causes nail discoloration and thickening, can produce pain on ambulation, and, in people with diabetes, predisposes to secondary bacterial infection, ulceration and potentially serious limb complications.(3) The burden also extends to children and adolescents, in whom dermatophyte onychomycosis is increasingly recognized.(4) Because the condition is common, chronic and recurrent, and because many patients remain untreated or receive repeated courses of therapy, the volume and cost of its pharmacological treatment are relevant to payers and to the clinicians who manage the nail on a routine basis.
Topical antifungals occupy a defined place in that treatment armamentarium. They avoid the systemic drug interactions and hepatic monitoring associated with oral terbinafine and the azoles, which is particularly valuable in older adults and in patients with diabetes who receive multiple medications.(5) Ciclopirox 8% nail lacquer was for years the only widely available topical option, although its mycological cure rates are modest and its effectiveness depends on regular debridement.(6) The approval of efinaconazole 10% solution and tavaborole 5% solution in 2014 expanded the topical armamentarium. Efinaconazole in particular penetrates the nail plate more effectively than ciclopirox and achieves higher mycological cure rates.(7,8) Post hoc analyses of the phase 3 trials and a pooled analysis in white, Black and Asian participants have confirmed the efficacy and safety of efinaconazole in older adults and across racial groups.(9,10) In vitro and ex vivo studies likewise document antifungal activity and nail penetration for the topical agents used in clinical practice.(11)
Despite this evidence, topical antifungal prescribing in the United States has been described as simultaneously insufficient and excessive, depending on the measure examined. An analysis of the National Ambulatory Medical Care Survey found that treatment was prescribed at only about one fifth of onychomycosis visits.(12) In contrast, studies of commercial insurance claims reported opportunities to improve guideline adherence in diagnosis and treatment and identified high rates of potentially unnecessary topical antifungal prescriptions.(13,14) A registry-based cohort described patient characteristics, diagnostic testing utilization and antifungal prescribing patterns for onychomycosis in the United States between 2016 and 2022, and found that diagnostic confirmation is obtained in only a minority of treated patients.(15) In Medicare Part D, specialty medications account for a large and rising share of dermatologic drug spending, but the specific contribution of podiatrist prescribing of topical antifungals has not been quantified.(16) The public release of prescriber-level Part D records makes such quantification feasible, because the files combine prescriber specialty, drug identity, annual volume and cost in a single national source that is updated each year.
Podiatrists are frequent first-contact providers for nail disorders and are therefore central to how topical antifungals are actually used in everyday practice. They perform nail debridement, obtain mycological samples and initiate or renew topical prescriptions, yet national data describing their prescribing behavior are scarce. It is not known how the adoption of efinaconazole and tavaborole has progressed among podiatrists since 2014, whether the older generic ciclopirox has been displaced, or how drug costs for these three products vary across states. Answering these questions requires a data source that identifies the specialty of the prescriber together with the specific drug, which is precisely the structure of the Medicare Part D Prescribers by Provider and Drug files. Such information is directly relevant to prescribing stewardship, to formulary decisions and to the training and continuing professional education of podiatric clinicians who treat nail disease in ambulatory practice.
This study aimed to describe the evolution of topical antifungal prescribing by podiatrists in Medicare Part D between 2014 and 2024 and to quantify between-state variation in drug costs. We tested three hypotheses. H1: the annual volume of topical antifungal prescribing by podiatrists increased over the study period. H2: the combined share of claims for efinaconazole and tavaborole rose over the period, although ciclopirox remained the most prescribed agent. H3: per-beneficiary drug costs varied substantially across states and were positively associated with the state-level share of branded agents.
METHODS
Design and reporting
This was a retrospective ecological analysis of routinely collected administrative data, structured as eleven annual cross-sections from 2014 through 2024 and as a cross-state comparison for 2024. The report follows the RECORD statement, an extension of STROBE for studies conducted using observational routinely collected health data.(17)
Data source
We used the Medicare Part D Prescribers by Provider and Drug public use files, published by the Centers for Medicare and Medicaid Services and distributed through the data.cms.gov Data API version 1.(18,19) Each record describes one prescriber, identified by National Provider Identifier, together with the prescriber specialty and the state of practice, and reports annual totals for a specific drug: total claims, total 30-day fills, total day supply, total drug cost and total beneficiaries. The specialty is recorded from the claim and, for podiatrists, identifies clinicians who bill under a podiatric specialty code. Annual files were available for the reporting years 2014 through 2024, the most recent released at the time of analysis. The same dataset has been used previously to examine prescribing by specialty and specialty-level trends in Medicare Part D.(20,21)
Data were acquired programmatically without any login requirement. For each reporting year and for each of the three generic drug names, the application programming interface was queried with two simultaneous filters, one restricting the prescriber specialty to podiatry and the other restricting the generic drug name, and results were paginated with a page size of 5000 records. The 2024 ciclopirox subset exceeded one page and required a second request at an offset of 5000 records. The downloaded files were concatenated and checked for duplicate prescriber-drug records within each year; no duplicates were found. Numeric fields were parsed from the text representation provided by the portal, with blank values treated as missing, and specialty and state fields were checked against the expected value sets. The age-restricted fields for beneficiaries aged 65 years or older were available but were not used, because the analysis was not stratified by age.
Population and drug selection
The study population comprised all records whose prescriber specialty was recorded as podiatry. Within those records we retained the three topical antifungals used for onychomycosis, identified by generic name: efinaconazole, tavaborole and ciclopirox. Efinaconazole and tavaborole are the branded agents, whereas ciclopirox is the long-available generic comparator. Restricting the analysis to podiatrists also reduces the ambiguity of the ciclopirox label, because podiatrists prescribe ciclopirox almost exclusively as the 8% nail lacquer rather than the cream, gel or shampoo formulations used for other dermatoses. The study period began in 2014, the year in which efinaconazole and tavaborole were first marketed, and ended in 2024, the most recent reporting year available at the time of analysis. The period therefore captures the full adoption window of the two branded agents against the pre-existing generic background.
Variables and outcome measures
Annual volume was measured as the sum of total claims, the sum of 30-day fills and the sum of drug cost in United States dollars, together with the number of beneficiaries and the number of distinct prescribers. A claim is a single prescription fill event, the 30-day fill is a standardized quantity that permits comparison of prescriptions of differing day supply, and the drug cost is the gross ingredient cost before any manufacturer rebates or beneficiary cost sharing. Drug composition was measured as the share of annual claims attributable to each agent and as the combined branded share, defined as the claims for efinaconazole and tavaborole divided by the claims for all three agents. For the 2024 cross-state comparison we computed, for each state and the District of Columbia, total claims, total beneficiaries, drug cost per beneficiary and the branded share of claims.
Two features of the public use files condition the interpretation of these quantities. First, the Centers for Medicare and Medicaid Services omits prescriber-drug cells with ten or fewer claims, so the annual totals are lower bounds of the true values and cannot be reconstructed exactly. Second, beneficiary counts of ten or fewer are suppressed even when claims are reported, so the number of beneficiaries is more incomplete than the number of claims and the cost-per-beneficiary ratio is correspondingly inflated. Beneficiaries are also counted once per drug, so a beneficiary who filled more than one of the three agents contributes more than once to the summed beneficiary totals.
Statistical analysis
The time-trend hypothesis was operationalized with a log-linear model, regressing the base-10 logarithm of the annual number of 30-day fills on calendar year by ordinary least squares. A logarithmic transformation was chosen because the annual series spans more than a doubling of volume and because the parameters of a log-linear model are directly interpretable as a constant percent change per year. The result is expressed as the average annual percent change with a 95% confidence interval derived from the t distribution and an exact p value; the hypothesis was considered supported when the average annual percent change was positive and its confidence interval excluded zero. The same model was fitted to total claims and to total drug cost as sensitivity analyses, and the coefficient of determination summarized goodness of fit. The trend test was applied to the eleven annual observations rather than to prescriber-level records because the hypothesis concerns the national trajectory over time, and the annual series has no missing values.
The composition hypothesis was operationalized with the annual branded share of claims. A Cochran-Armitage test assessed the trend of the branded share across the eleven years, and an exact binomial 95% confidence interval was computed for the 2024 share. Because 2014 was the launch year of the two branded agents, the 2014 share reflects only the final months of the year.
The cost-variation hypothesis was operationalized in the 2024 cross-state comparison with the coefficient of variation, the interquartile range and the ratio of the 90th to the 10th percentile of per-beneficiary drug cost. The association between state per-beneficiary cost and the state branded share was estimated with the Pearson correlation coefficient; the Spearman rank correlation and the exclusion of the District of Columbia were computed as sensitivity analyses. The District of Columbia was excluded in sensitivity because its small beneficiary denominator makes its per-beneficiary estimate unstable, and the rank correlation guards against undue influence of high-cost outliers. States without any reported beneficiary count were excluded from this comparison. Correlations were interpreted as descriptive measures of association rather than as evidence of a causal effect, consistent with the ecological design.
RESULTS
Between 2014 and 2024 the analysis included 46,239 prescriber-drug records contributed by 9,834 distinct podiatrists across the fifty states, the District of Columbia and United States territories. Cumulatively the records represented 2,294,272 claims, 2,467,254 30-day fills and 265.2 million United States dollars in drug costs. The annual number of contributing prescribers grew in every year of the series.
H1. Annual prescribing volume increased over the study period
Annual claims increased from 134,117 in 2014 to 348,043 in 2024, and 30-day fills rose from 139,407 to 378,910 over the same interval (Table 1). Drug costs increased from 7.7 million to 58.1 million United States dollars, a growth that outpaced the growth in volume. The number of distinct podiatrist prescribers rose from 2,614 to 5,601, and the number of beneficiary entries from 63,150 to 152,004. In 2024 the mean cost was 166.9 United States dollars per claim and 153.3 per 30-day fill, and the aggregate cost per beneficiary entry was 382.2 United States dollars.
The log-linear model estimated an average annual increase in 30-day fills of 9.3% (95% CI 7.1-11.5; p <0.001), and the model accounted for 0.92 of the annual variance in volume. The sensitivity models yielded consistent estimates for claims (8.7% per year; 95% CI 6.4-11.0) and for drug costs (18.5% per year; 95% CI 13.1-24.2). The upward trajectory was interrupted only in 2020, when claims fell from 206,700 to 177,961, and it resumed in every subsequent year. Drug costs followed the same temporal pattern, with the single year-over-year decline also occurring in 2020, before spending rose again in each of the following years. H1 was confirmed.
Year | Claims (n) | 30-day fills (n) | Drug cost (USD) | Beneficiaries (n) | Prescribers (n) |
|---|---|---|---|---|---|
2014 | 134117 | 139407 | 7709498 | 63150 | 2614 |
2015 | 154757 | 161801 | 12226727 | 68922 | 3086 |
2016 | 161946 | 170934 | 14277181 | 72959 | 3363 |
2017 | 165520 | 175402 | 16582387 | 73602 | 3398 |
2018 | 184676 | 196553 | 17059166 | 81355 | 3518 |
2019 | 206700 | 221558 | 18949744 | 92335 | 3857 |
2020 | 177961 | 192879 | 15747950 | 77399 | 3720 |
2021 | 210950 | 229196 | 21899433 | 91900 | 4193 |
2022 | 252647 | 276199 | 34073942 | 109991 | 4551 |
2023 | 296955 | 324414 | 48537048 | 129653 | 5104 |
2024 | 348043 | 378910 | 58094058 | 152004 | 5601 |
Note: USD = United States dollars. Source: Elaborated from the CMS Medicare Part D Prescribers - by Provider and Drug public use files (data.cms.gov).
H2. Prescribing shifted toward branded agents while ciclopirox remained dominant
Efinaconazole and tavaborole entered the market in 2014, and their combined share of claims rose from 0.1% that year to 14.3% in 2024 (Table 2; Figure 1). In 2024 efinaconazole accounted for 35,417 claims and 41,573,180 United States dollars in drug costs, tavaborole for 14,261 claims and 7,510,001 United States dollars, and ciclopirox for 298,365 claims and 9,010,878 United States dollars. The branded share of claims was 14.3%, composed of 10.2% for efinaconazole and 4.1% for tavaborole, whereas ciclopirox retained 85.7% of claims. The distribution of spending differed from the distribution of claims: efinaconazole represented 10.2% of claims and 71.6% of drug costs, whereas ciclopirox represented 85.7% of claims and 15.5% of costs. In terms of 30-day fills, the corresponding volumes were 38,748 for efinaconazole, 17,225 for tavaborole and 322,937 for ciclopirox. The Cochran-Armitage test confirmed a monotonic increase in the branded share over the period (z = 237.2; p <0.001), and the exact binomial confidence interval for the 2024 share was 14.2-14.4%. Ciclopirox nevertheless remained the dominant agent in every year of the period. H2 was confirmed.
Year | Efinaconazole (claims) | Tavaborole (claims) | Ciclopirox (claims) | Branded share (%) |
|---|---|---|---|---|
2014 | 134 | 0 | 133983 | 0.1 |
2015 | 4849 | 1343 | 148565 | 4.0 |
2016 | 4767 | 2362 | 154817 | 4.4 |
2017 | 4639 | 1927 | 158954 | 4.0 |
2018 | 6592 | 1027 | 177057 | 4.1 |
2019 | 8796 | 1234 | 196670 | 4.9 |
2020 | 8230 | 1188 | 168543 | 5.3 |
2021 | 10783 | 5491 | 194676 | 7.7 |
2022 | 15170 | 12516 | 224961 | 11.0 |
2023 | 23881 | 15574 | 257500 | 13.3 |
2024 | 35417 | 14261 | 298365 | 14.3 |
Note: Branded agents comprise efinaconazole and tavaborole; ciclopirox is the generic comparator. Source: Elaborated from the CMS Medicare Part D Prescribers - by Provider and Drug public use files (data.cms.gov).
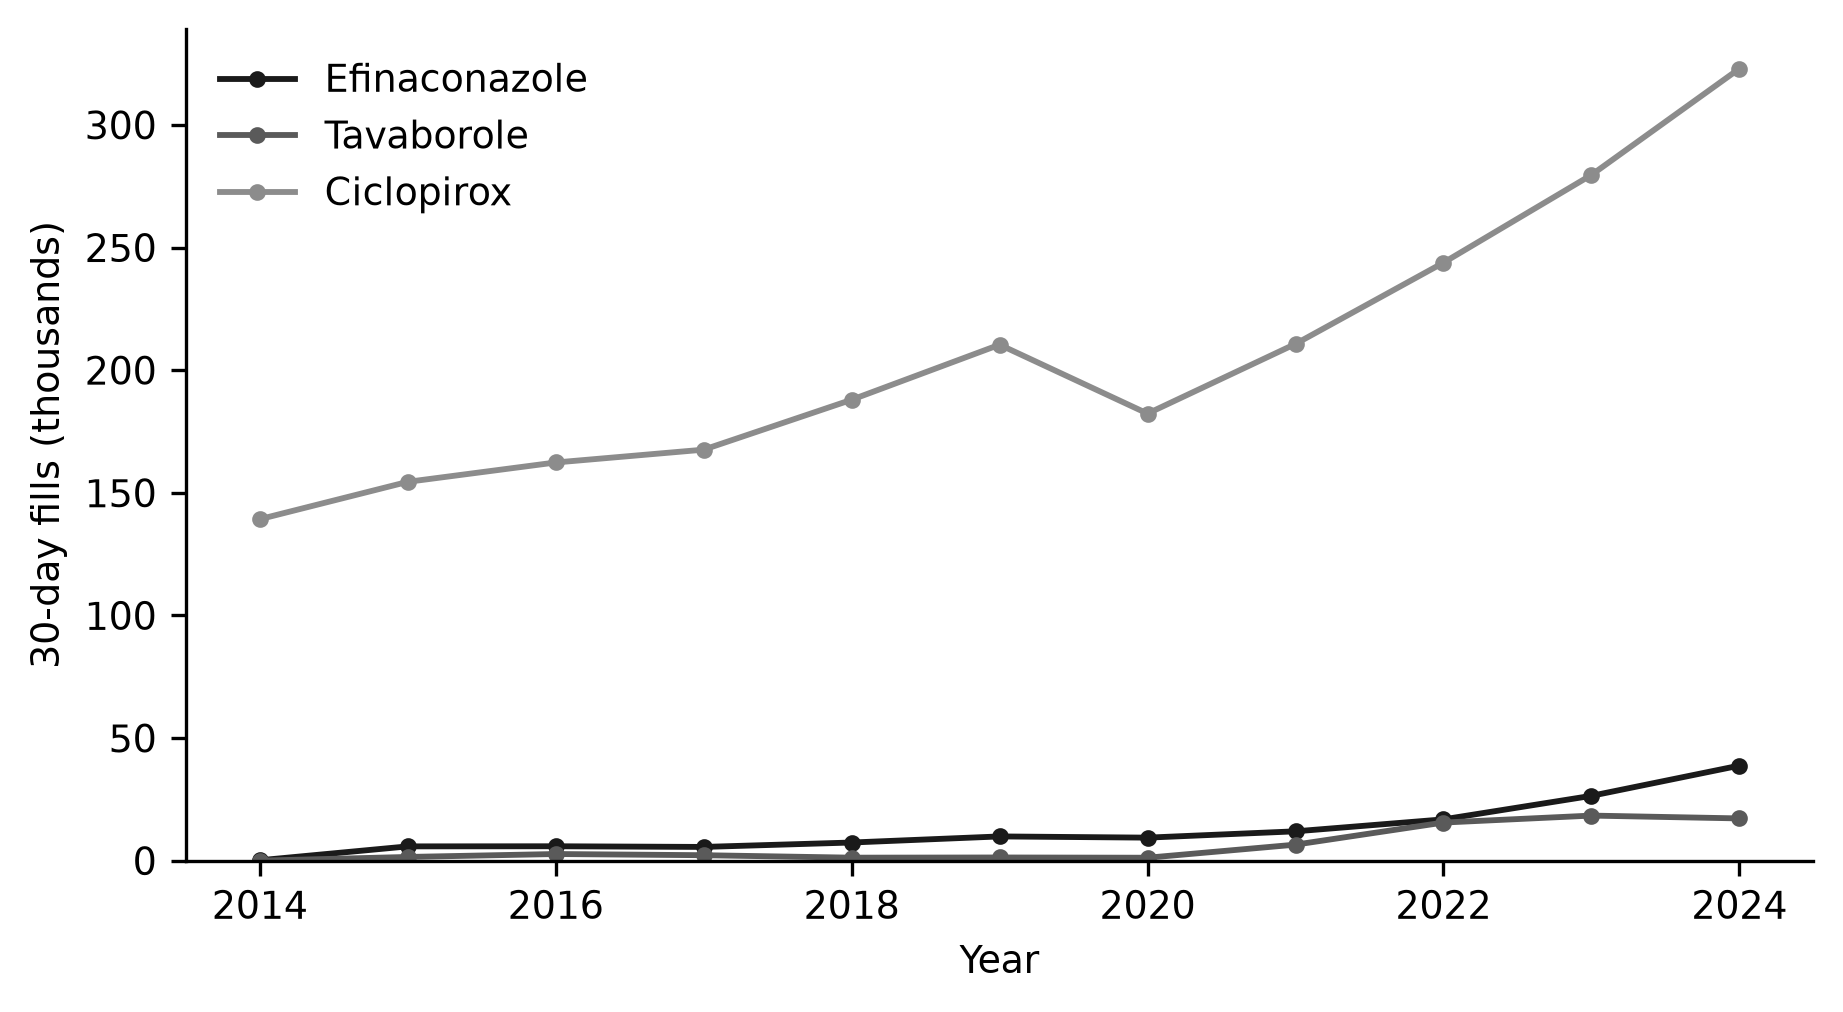
Figure 1. Annual 30-day fills for topical antifungals for onychomycosis by podiatrists, Medicare Part D 2014-2024.
Note: Values are sums across podiatrist prescribers. Source: Elaborated from the CMS Medicare Part D Prescribers - by Provider and Drug public use files (data.cms.gov).H3. Per-beneficiary costs varied widely across states
In 2024 the cross-state analysis included 50 jurisdictions after the exclusion of South Dakota, which reported no beneficiary counts (Table 3; Figure 2). Per-beneficiary drug cost ranged from 42.1 United States dollars in ID to 1,307.0 in NY, with a median of 164.8. The coefficient of variation was 103.8%, the interquartile range 225.4 United States dollars and the ratio between the 90th and 10th percentiles 9.7. The branded share of claims also varied across jurisdictions, from 0.0% to a maximum of 55.8% in OR. Per-beneficiary cost was strongly associated with the state branded share of claims (Pearson r = 0.94; p <0.001), and the Spearman correlation was similar (rho = 0.95; p <0.001). H3 was confirmed.
State | Claims (n) | Beneficiaries (n) | Cost per beneficiary (USD) | Branded share (%) |
|---|---|---|---|---|
NY | 62399 | 21636 | 1307.0 | 40.9 |
DC | 854 | 326 | 1076.0 | 33.1 |
OR | 3025 | 1372 | 1045.4 | 55.8 |
MA | 4768 | 1858 | 675.6 | 24.1 |
CT | 4915 | 1989 | 597.2 | 20.1 |
NJ | 22726 | 8119 | 596.1 | 16.2 |
CO | 1448 | 540 | 490.1 | 14.6 |
NE | 156 | 37 | 466.9 | 7.1 |
MD | 5086 | 2243 | 463.9 | 19.0 |
AK | 148 | 54 | 442.2 | 10.1 |
RI | 811 | 301 | 423.9 | 17.1 |
KS | 511 | 198 | 362.6 | 12.1 |
VT | 186 | 79 | 321.9 | 8.1 |
CA | 45628 | 19822 | 315.1 | 14.9 |
UT | 616 | 292 | 252.0 | 11.4 |
HI | 316 | 143 | 243.1 | 8.2 |
VA | 6028 | 2813 | 242.3 | 10.6 |
AL | 2993 | 1481 | 219.4 | 8.5 |
WI | 3563 | 1644 | 207.4 | 5.9 |
MO | 3381 | 1508 | 200.1 | 9.1 |
TX | 27234 | 13343 | 192.9 | 7.3 |
AZ | 5041 | 2390 | 191.6 | 6.6 |
OK | 1550 | 742 | 186.0 | 5.5 |
DE | 1348 | 583 | 177.7 | 5.6 |
IN | 2719 | 1291 | 170.3 | 6.1 |
TN | 3018 | 1535 | 159.2 | 5.3 |
ME | 153 | 26 | 154.2 | 0.0 |
SC | 4365 | 2203 | 153.7 | 4.9 |
PA | 13540 | 5504 | 151.1 | 4.4 |
NC | 7946 | 3860 | 141.0 | 3.9 |
FL | 47640 | 22115 | 132.8 | 3.3 |
MS | 1818 | 884 | 127.8 | 5.2 |
IL | 8414 | 4037 | 116.5 | 3.2 |
NV | 1821 | 872 | 109.5 | 2.8 |
LA | 5479 | 2747 | 107.6 | 2.6 |
OH | 10180 | 4764 | 105.1 | 2.2 |
WA | 2057 | 825 | 103.7 | 2.2 |
IA | 756 | 269 | 91.8 | 0.0 |
NH | 322 | 129 | 81.8 | 0.0 |
GA | 9618 | 4881 | 78.5 | 1.4 |
WY | 61 | 22 | 78.2 | 0.0 |
MI | 5866 | 2847 | 73.9 | 1.9 |
AR | 818 | 439 | 63.8 | 0.0 |
NM | 1282 | 589 | 62.5 | 0.0 |
KY | 2042 | 1014 | 61.8 | 1.2 |
MT | 246 | 93 | 60.3 | 0.0 |
WV | 964 | 457 | 56.4 | 0.0 |
MN | 1825 | 908 | 55.8 | 0.7 |
ND | 38 | 19 | 52.6 | 0.0 |
ID | 227 | 130 | 42.1 | 0.0 |
Note: States ordered by cost per beneficiary; South Dakota was excluded because no beneficiary counts were reported. USD = United States dollars. Source: Elaborated from the CMS Medicare Part D Prescribers - by Provider and Drug public use files (data.cms.gov).
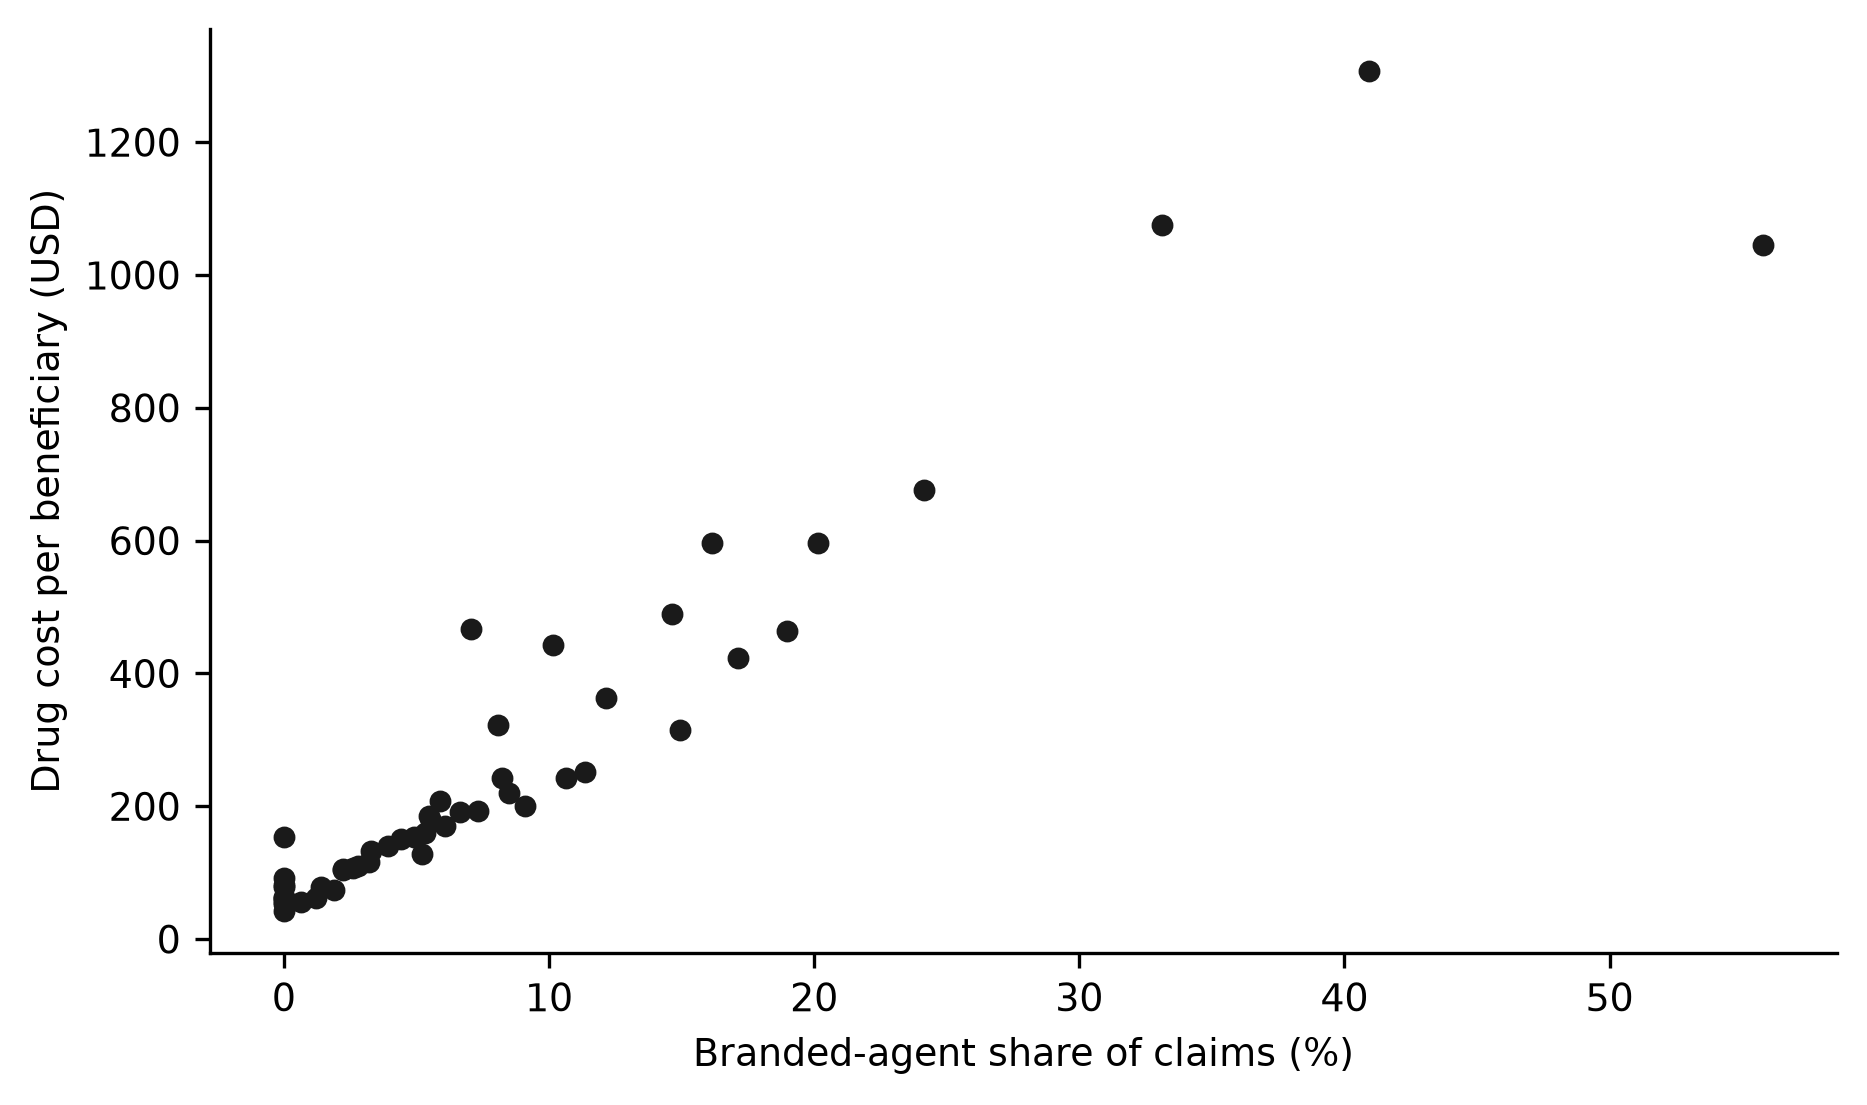
Figure 2. Per-beneficiary drug cost versus branded-agent share of claims by state, Medicare Part D 2024.
Note: Each point represents one state or the District of Columbia. South Dakota was excluded. Source: Elaborated from the CMS Medicare Part D Prescribers - by Provider and Drug public use files (data.cms.gov).DISCUSSION
The principal finding of this study is that podiatrist prescribing of topical antifungals for onychomycosis in Medicare Part D expanded steadily over eleven years, that spending grew faster than prescribing volume because of a modest shift toward branded agents, and that per-beneficiary costs differed more than ninefold across states in line with the local share of those branded agents.
These estimates describe a Medicare population that is older, more heavily treated and more comorbid than the commercially insured population examined in most prior studies of onychomycosis prescribing.(3,5) The findings are therefore best interpreted as the behavior of clinicians who manage the disease in exactly the group in which topical therapy is most attractive, namely older adults with polypharmacy and, frequently, diabetes. Generalization to younger, commercially insured patients should be made with caution, although the underlying drivers of prescribing, such as price, familiarity and efficacy expectations, are unlikely to be unique to Medicare. The analysis also captures prescriptions only for beneficiaries enrolled in Part D, so uninsured patients and those covered by other plans are not represented, and the state-level differences cannot be attributed to any single formulary or benefit design.
The growth in prescribing volume is consistent with the broader expansion of prescription drug spending in fee-for-service Medicare and with the rising concentration of that spending in specialty products.(22,23) Within dermatology, specialty medications now account for a substantial and increasing share of Medicare Part D expenditures, which places a drug class such as the topical onychomycosis agents within a larger spending trend.(16) The interruption observed in 2020 coincides with the sharp reduction in ambulatory care during the COVID-19 pandemic, and the subsequent recovery indicates that the pre-pandemic trajectory resumed rather than changed. Consistent with that interpretation, the annual volume of prescribing and the number of active prescribers both rose in every year after 2020. The increase in the number of distinct podiatrist prescribers, from roughly 2,600 to 5,600, further suggests that adoption, rather than intensification by a fixed group of prescribers, accounted for much of the growth.
The composition of prescribing, with ciclopirox retaining a dominant share despite the documented efficacy advantage of efinaconazole, deserves interpretation. Efinaconazole has superior nail penetration and higher mycological cure rates than ciclopirox, as shown in phase 3 trials and in pooled and post hoc analyses.(7,9,10) The relatively low share of the branded agents therefore does not reflect a lack of efficacy. In line with this, the persistence of ciclopirox is better explained by its long market presence, generic availability and low unit cost, and by its continued use in combination with oral therapy.(6) The modest uptake of the branded agents parallels the under-treatment reported in ambulatory surveys and the high frequency of potentially unnecessary topical prescriptions in commercial claims, findings that together indicate prescribing decisions are influenced by factors other than efficacy alone.(12,14) Guideline-adherence analyses reach a similar conclusion for diagnosis and treatment selection.(13) The acceleration of efinaconazole claims in the final years of the period is consistent with growing familiarity, long-term and maintenance regimens, and individualized use in diverse patient groups.(24,25) Tavaborole remained a smaller share than efinaconazole throughout, a pattern that parallels its narrower evidence base and less consistent adoption in clinical practice. The concentration of spending is nonetheless striking: efinaconazole alone accounted for most of the drug cost despite representing a small minority of claims, which explains why spending rose much faster than the number of prescriptions.
The clinical meaning of this composition is twofold. On one hand, the continued dominance of a generic with modest cure rates suggests that many treated patients receive a product with limited mycological efficacy, which may contribute to recurrence and repeated courses of care. On the other hand, the growth of efinaconazole use, particularly in its later years, indicates that a subset of prescribers adopted the more effective agent and that the barrier to broader use is more likely economic than scientific. The heterogeneity of topical response itself, which depends on nail thickness, the number of affected nails and the duration of disease, means that no single agent is appropriate for every patient and that treatment selection should be individualized rather than driven by default.(26-28)
These findings also bear on the interpretation of prescribing quality. The observation that treatment is prescribed at a minority of onychomycosis visits, together with the frequency of potentially unnecessary topical prescriptions identified in claims data, has been used to argue that both under-treatment and over-treatment coexist.(12,14) The present national series adds a third dimension: among podiatrists who do prescribe, the default choice is often the least effective topical, while the most effective and most costly agent is concentrated in a minority of states. Prescribing quality improvement therefore has to address not only whether a topical antifungal is given, but which one, and for whom.
The marked between-state variation in per-beneficiary cost and its strong correlation with the branded share indicate that drug mix, rather than volume alone, drives geographic differences in spending. This pattern is consistent with evidence that physician migration propagates prescribing styles across regions and with the substantial heterogeneity documented within Medicare Part D more generally.(29,30) It also mirrors specialty-level analyses of Medicare Part D that described national trends and geographic concentration in dentist prescribing of opioids and antibiotics.(31,32) In the present data, the states with the highest per-beneficiary costs were those in which branded agents represented the largest share of claims, whereas the lowest-cost states relied almost exclusively on ciclopirox. Because branded topical antifungals carry higher out-of-pocket costs for beneficiaries, this geographic pattern also implies unequal financial burden for otherwise similar patients depending on where they receive care, a consideration that is relevant to benefit design and to the transparency of prescribing choices.
The methodological approach adopted here mirrors a growing body of specialty-level analyses built on the same Medicare Part D public use files. Studies of dentist prescribing of opioids and of antibiotics used identical records to describe national trends and geographic concentration and found, as in the present analysis, that a specific drug mix and a limited set of states accounted for a disproportionate share of prescribing and spending.(31,32) The consistency across specialties suggests that the framework is generalizable and that the present findings reflect structural features of Part D prescribing rather than an idiosyncrasy of podiatry.
Several mechanisms plausibly account for these results. Spending grew faster than volume because the per-claim price of efinaconazole and tavaborole is substantially higher than that of ciclopirox, and that price gradient concentrates spending where branded adoption is greatest, in keeping with the role of specialty drugs in rising Part D drug prices.(33) The preference for topical therapy in older adults and in people with diabetes, driven by the avoidance of drug-drug interactions, sustains demand for these agents in the population most likely to use Medicare Part D.(5) Concerns about antifungal resistance and emerging dermatophyte issues may also favor topical options in selected patients.(34-37) The detection of squalene epoxidase mutations in United States patients with onychomycosis indicates that resistance to oral terbinafine is no longer a theoretical concern, which reinforces the clinical role of effective topical agents in patients who cannot take or fail oral therapy.(36) Finally, the clinical response to topical therapy is heterogeneous and depends on nail thickness, the number of affected nails and individual patient factors, which may contribute to the variability of use across prescribers and regions.(26-28)
The study has several strengths. It used a complete national census of Medicare Part D prescriber records over eleven years, restricted the analysis to a single specialty to isolate podiatrist behavior, and relied on open data with a documented and reproducible query, so the results can be independently recalculated. The use of three drugs within a single therapeutic class also limits the influence of indications unrelated to onychomycosis. The analytical plan was specified before the data were inspected, with three hypotheses defined in advance, each with a stated measure and decision criterion, which reduces the risk of selective reporting. Finally, the temporal coverage from the launch year of the branded agents to the most recent release provides the longest possible national view of adoption among podiatrists.
From a practical standpoint, the wide and drug-mix-driven variation in per-beneficiary costs points to opportunities for formulary management and for stewardship of topical antifungal prescribing, especially in view of the documented frequency of unnecessary topical prescriptions. For podiatrists, the sustained dominance of ciclopirox despite its lower efficacy, and the modest uptake of more effective branded agents, suggest that treatment selection in nail care pathways merits review. The results also provide a baseline against which the effect of generic efinaconazole entry and of Medicare drug price negotiation can be monitored in subsequent reporting years.
For payers and policymakers, the concentration of spending in a single branded product that accounts for a minority of prescriptions illustrates, on a small scale, the broader dynamics of specialty drug costs within Medicare Part D.(16,33) Because the three agents are close therapeutic substitutes within a single class, the observed interstate variation cannot be explained by differences in disease burden alone and is more plausibly driven by local prescribing culture, detailing, formularies and out-of-pocket design. Benchmarking state-level prescribing against the mix of the lowest-cost jurisdictions could therefore identify savings without reducing access, and the public availability of the underlying data makes such monitoring inexpensive and reproducible.(18)
For podiatric education and professional practice, the results suggest concrete content for continuing education and for clinical pathways in nail care. Clinicians should be familiar with the comparative efficacy of the three agents, with the predictors of poor topical response such as nail thickness and the number of affected nails, and with the circumstances under which a more expensive branded agent is justified by a higher likelihood of cure rather than by habit.(26,27) Because podiatrists are often the clinicians who establish the initial diagnosis and treatment plan, their choices shape both the clinical course and the cost borne by the Medicare program and by beneficiaries.
Limitations
This study has limitations that qualify its interpretation. First, the Centers for Medicare and Medicaid Services omits prescriber-drug cells with ten or fewer claims and suppresses beneficiary counts of ten or fewer, which makes the reported totals lower bounds and inflates the per-beneficiary denominator, particularly in small states; future work should link these records to Medicare enrollment files to obtain an external denominator. Second, the data are aggregated at the prescriber-drug level and carry no clinical indication or mycological confirmation, so the appropriateness of prescribing cannot be judged; linkage to diagnosis and laboratory data would be required to address that question. Third, the ciclopirox label may include non-nail formulations, although restricting the population to podiatrists mitigates this concern. Fourth, beneficiary counts are drug-specific and therefore overcount beneficiaries who filled more than one of the three agents. Fifth, the ecological design prevents causal inference and does not adjust for state-level podiatrist density, beneficiary enrollment or formulary design; multilevel models incorporating those covariates would extend the analysis. Finally, 2014 was a partial launch year for efinaconazole and tavaborole, so the branded share for that year is conservative.
CONCLUSIONS
Topical antifungal prescribing by podiatrists in Medicare Part D increased substantially between 2014 and 2024 in claims, 30-day fills and drug spending, with spending growing faster than volume. The composition of prescribing shifted from ciclopirox toward efinaconazole and tavaborole, although ciclopirox remained the most prescribed agent throughout the period. Per-beneficiary drug costs varied widely across states and were strongly associated with the state share of branded agents, indicating that drug mix, rather than disease burden alone, is the main driver of geographic differences in spending and a target for stewardship and formulary policy.
References
- 1 Singh SK. Understanding the dynamics of onychomycosis: a common nail infection. Reviews and Research in Medical Microbiology. 2026. doi: 10.1097/mrm.0000000000000467
- 2 Leung AK, Barankin B, Lam JM, Leong KF, Hon KL. Tinea pedis: an updated review. DIC. 2023;12:1-16. doi: 10.7573/dic.2023-5-1
- 3 Gupta AK, Liddy A, Magal L, Shemer A, Cooper EA, Saunte DML, et al. Onychomycosis in Diabetics: A Common Infection with Potentially Serious Complications. Life. 2025;15(8):1285. doi: 10.3390/life15081285
- 4 Gupta AK, Taylor D. Pediatric dermatophyte onychomycosis: a review. Int J Dermatology. 2025;64(3):465-472. doi: 10.1111/ijd.17495
- 5 Navarro-Pérez D, Tardáguila-García A, García-Oreja S, Álvaro-Afonso FJ, López-Moral M, Lázaro-Martínez JL. Treatment of Onychomycosis and the Drug–Drug Interactions in Patients with Diabetes Mellitus and Diabetic Foot Syndrome: A Systematic Review. Infectious Disease Reports. 2025;17(1):4. doi: 10.3390/idr17010004
- 6 Roustan G, López Estébaranz JL, De La Cueva P, Savana Research Group, Cabal-Hierro L, Casadevall D, et al. Retrospective study of onychomycosis patients treated with ciclopirox 8% HPCH and oral antifungals applying artificial intelligence to electronic health records. Sci Rep. 2025;15(1):27978. doi: 10.1038/s41598-025-10875-5
- 7 Gupta AK, Talukder M. Efinaconazole in Onychomycosis. Am J Clin Dermatol. 2022;23(2):207-218. doi: 10.1007/s40257-021-00660-1
- 8 Vlahovic TC, Gupta AK. Efinaconazole topical solution (10%) for the treatment of onychomycosis in adult and pediatric patients. Expert Review of Anti-infective Therapy. 2022;20(1):3-15. doi: 10.1080/14787210.2021.1939011
- 9 Lipner SR, Gupta AK, Joseph WS, Elewski B, Guenin E, Vlahovic TC. Efficacy and Safety of Efinaconazole 10% Topical Solution for Treatment of Onychomycosis in Older Adults: A Post Hoc Analysis of Two Phase 3 Randomised Trials. Mycoses. 2025;68(5):e70069. doi: 10.1111/myc.70069
- 10 Lipner SR, Gupta AK, Vlahovic TC, Rosen T, Elewski B, Choi SY, et al. Topical Efinaconazole 10% for Onychomycosis: Pooled Phase 3 Analysis in White, Black, and Asian Participants. JDD. 2026;25(1):67-74. doi: 10.36849/jdd.9384
- 11 Elabbasi A, Kadry A, Joseph W, Elewski B, Lipner S, Guenin E, et al. Topical Antifungals for Onychomycosis: In Vitro Antifungal Activity, Ex Vivo Nail Penetration, and Clinical Efficacy. J of Skin. 2025;9(2):s566. doi: 10.25251/skin.10.supp.566
- 12 Peck GM, Fleischer Jr. AB, Lipner SR. Onychomycosis Treatment Prescribed at Only Twenty Percent of Visits: A Cross-Sectional Analysis of the National Ambulatory Medical Care Survey 2007 to 2016. JDD. 2023;22(10):1040-1045. doi: 10.36849/jdd.6770
- 13 Gold JAW, Wu K, Jackson BR, Benedict K. Opportunities to improve guideline adherence for the diagnosis and treatment of onychomycosis: Analysis of commercial insurance claims data, United States. Journal of the American Academy of Dermatology. 2023;88(3):683-686. doi: 10.1016/j.jaad.2022.06.1201
- 14 Gold JAW, Benedict K, Caplan AS, Lipner SR, Smith DJ. High rates of potentially unnecessary topical antifungal prescribing in a large commercial health insurance claims database, United States. Journal of the American Academy of Dermatology. 2025;92(5):1119-1121. doi: 10.1016/j.jaad.2025.01.022
- 15 Gupta AK, Wang T, Tran AN. Patient Characteristics, Diagnostic Testing Utilization, and Antifungal Prescribing Pattern for Onychomycosis in the USA: A Cohort Study Using DataDerm, 2016–2022. Skin Appendage Disord. 2024;11(1):1-9. doi: 10.1159/000540704
- 16 Kong EL, Mostaghimi A. Quantifying the Role of Specialty Medications in Medicare Part D Expenditures in Dermatology. JAMA Dermatol. 2025;161(10):1007. doi: 10.1001/jamadermatol.2025.2142
- 17 Benchimol EI, Smeeth L, Guttmann A, Harron K, Moher D, Petersen I, et al. The REporting of studies Conducted using Observational Routinely-collected health Data (RECORD) Statement. PLoS Med. 2015;12(10):e1001885. doi: 10.1371/journal.pmed.1001885
- 18 Centers for Medicare & Medicaid Services. Medicare Part D Prescribers - by Provider and Drug [Internet]. 2026. Available from: https://data.cms.gov/provider-summary-by-type-of-service/medicare-part-d-prescribers/medicare-part-d-prescribers-by-provider-and-drug
- 19 Centers for Medicare & Medicaid Services. Medicare Part D Prescribers Methodology [Internet]. 2024. Available from: https://data.cms.gov/resources/medicare-part-d-prescribers-methodology
- 20 Schedler NC, Saqib M, Huang CA, Feldman SR. Adalimumab biosimilar uptake among dermatologists in Medicare Part D through 2023: A retrospective analysis using the Prescribers – by Provider and Drug dataset. JAAD International. 2026;28:95-96. doi: 10.1016/j.jdin.2026.07.006
- 21 Bartoletta J, Kubsad S, Fernando N, Chansky H, Manner P, Hernandez N. Prescription Trends by Orthopedic Surgery Provider: Review of the Medicare Part D Prescribers - by Provider and Drug, 2013–2021. Orthopedics. 2025;48(5):297-304. doi: 10.3928/01477447-20250702-03
- 22 Dusetzina SB, Huskamp HA, Qin X, Keating NL. Prescription Drug Spending in Fee-for-Service Medicare, 2008-2019. JAMA. 2022;328(15):1515. doi: 10.1001/jama.2022.17825
- 23 Niu S, Happe LE, Abuloha S, Svensson M. Concentration of spending and share of specialty drug spending in Medicare Part D over a 10-year period. JMCP. 2024;30(12):1355-1363. doi: 10.18553/jmcp.2024.30.12.1355
- 24 Gupta AK, Cooper EA. Safety and Efficacy of a 48-Month Efinaconazole 10% Solution Treatment/Maintenance Regimen: 24-Month Daily Use Followed by 24-Month Intermittent Use. Infectious Disease Reports. 2025;17(1):7. doi: 10.3390/idr17010007
- 25 Gupta AK, Taylor D, Dennis D, Wang T, Cooper EA. Treating Onychomycosis with Efinaconazole: Considerations for Diverse Patient Groups. JoF. 2025;11(12):843. doi: 10.3390/jof11120843
- 26 Inoue T, Watabe D, Sato T, Yasuhira S, Tsunemi Y, Amano H. Baseline Nail Thickness and Great Toenail Involvement Are Associated With Poor Response to Topical Antifungal Therapy for Onychomycosis: A Lesion‐Level Generalized Estimating Equations Analysis. The Journal of Dermatology. 2026;53(7):1013-1019. doi: 10.1111/1346-8138.70311
- 27 Feldman SR, Vlahovic TC, Joseph WS, Daniel CR, Elewski B, Rich P, et al. Number of Affected Nails Is the Primary Determinant of Efinaconazole 10% Solution Usage for Onychomycosis. JDD. 2024;23(2):110-112. doi: 10.36849/jdd.7676
- 28 Gupta AK, Venkataraman M, Anbalagan N, Guenin EP. One size does not fit all: the need for individualized treatment based on factors that may affect the therapeutic outcome of efinaconazole 10% solution for the treatment of toenail onychomycosis. Int J Dermatology. 2021;60(10):1296-1302. doi: 10.1111/ijd.15739
- 29 Beheshti D, Neller S. What Causes Geographic Variation in Drug Prescribing? Evidence from Physician Migration. The RAND J of Economics. 2026;57(3):601-626. doi: 10.1111/1756-2171.70069
- 30 Lederman DM, Olssen AL, Pauly MV. Substantial variation among Medicare beneficiaries in the impact from 2025 Part D out of pocket spending caps. Health Affairs Scholar. 2025;3(4):qxaf059. doi: 10.1093/haschl/qxaf059
- 31 Fritze RR, Diaz AC. Opioid prescribing by dentists in Medicare Part D: national trends and geographic variation. SAP Dentistry. 2023;1:59. doi: 10.62486/dent202359
- 32 Fritze RR. Antibiotic Prescribing by Dentists for Medicare Beneficiaries: Temporal Trends and Geographic Concentration in the United States. SAP Dentistry. 2026;4:257. doi: 10.62486/dent2026257
- 33 Hayford TB. Role of Specialty Drugs in Rising Drug Prices for Medicare Part D. JAMA Health Forum. 2024;5(5):e241188. doi: 10.1001/jamahealthforum.2024.1188
- 34 Dellière S, Jabet A, Abdolrasouli A. Current and emerging issues in dermatophyte infections. PLoS Pathog. 2024;20(6):e1012258. doi: 10.1371/journal.ppat.1012258
- 35 Gupta AK, Talukder M, Carviel JL, Cooper EA, Piguet V. Combatting antifungal resistance: Paradigm shift in the diagnosis and management of onychomycosis and dermatomycosis. Acad Dermatol Venereol. 2023;37(9):1706-1717. doi: 10.1111/jdv.19217
- 36 Gupta AK, Cooper EA, Wang T, Polla Ravi S, Lincoln SA, Piguet V, et al. Detection of Squalene Epoxidase Mutations in United States Patients with Onychomycosis: Implications for Management. Journal of Investigative Dermatology. 2023;143(12):2476-2483.e7. doi: 10.1016/j.jid.2023.04.032
- 37 Lee YB. Terbinafine Resistance in Onychomycosis: Epidemiology, Mechanisms, and Treatment Strategies. J Mycol Infect. 2026;31(2):51. doi: 10.17966/jmi.2026.31.2.51
Declarations
Funding
No financing
Conflict of interest
None
Authorship contributions
Drafting – original draft: Haidee Oren, Karin D Richmond.
Writing–review and editing: Haidee Oren, Karin D Richmond.