

Abstract
Introduction: Diabetes-related lower-extremity amputation is a disabling and costly complication of diabetes, and reported rates differ markedly between countries. Methods: Ecological longitudinal analysis of the OECD Health Care Quality Indicators, using age-sex standardised rates of major and minor lower-extremity amputations per 100 000 population aged 15 years and over reported by 28 OECD countries between 2004 and 2023. Temporal trends were estimated with linear mixed models, and country-level change was measured from the earliest available year to 2023. Results: In 2023 the OECD mean rate of any lower-extremity amputation was 23.5 per 100 000, ranging from 2.8 in Iceland to 69.1 in Malta. Major amputations declined by −0.08 per 100 000 per year (95% CI −0.10 to −0.05), whereas minor amputations rose by 0.21 per 100 000 per year (95% CI 0.16-0.26). Chile increased from 14.6 in 2004 to 40.8 per 100 000 in 2023, a 179.5% increase. Conclusions: Diabetes-related amputation rates vary widely across OECD countries and show divergent trends, with major amputations declining and minor amputations rising. Chile exhibited the largest increase among countries with long time series.
Keywords
amputation, diabetic foot, diabetes mellitus, health care quality indicators, developed countries, time factors
INTRODUCTION
Lower-extremity amputation is one of the most disabling and costly outcomes of diabetes. Foot ulceration precedes the large majority of diabetes-related amputations, and the global burden of diabetic foot disease remains substantial.(1,2) The consequences extend well beyond the surgical event: a Danish nationwide study estimated that major lower-limb amputations in type 2 diabetes carry high societal costs, driven by hospitalisation, rehabilitation, and long-term care,(3) and analyses from middle-income settings show that limb loss still carries high early mortality.(4) Between 1990 and 2021, disability attributable to diabetes continued to expand across most world regions, even in countries that recorded falling mortality.(5) Because most amputations follow preventable ulceration, infection, or delayed revascularisation, their frequency has long been read as a marker of how well a health system manages diabetes and its foot complications.(6) In the Latin American members of the OECD the rise in diabetes prevalence has been steeper than in Europe, which enlarges the population at risk of foot complications.(5,7) The clinical pathway from hyperglycaemia to amputation passes through neuropathy, peripheral artery disease, and foot ulceration. Ulcers that fail to heal become infected, and infection combined with ischemia is the constellation that most often ends in a major amputation.(2) Preventive foot care, structured offloading, and early revascularisation interrupt this sequence, which is why the amputation rate is treated as a sentinel indicator of secondary prevention rather than a direct measure of diabetes severity.(6) Health systems that underinvest in these preventive steps absorb the cost downstream, a pattern documented for diabetes care in the United States.(8)
International comparison of amputation rates became feasible when the OECD incorporated lower-extremity amputation in adults with diabetes into its Health Care Quality Indicators framework.(9-11) Carinci et al.(6) appraised that data collection and showed that harmonised rates were sufficiently robust to support cross-national benchmarking, although they also cautioned that reporting completeness varied. Rotar et al.(12) reached a similar conclusion in 15 countries, noting that the indicators were technically sound but that their use in national monitoring lagged behind their methodological maturity. Subsequent syntheses have confirmed that major amputation rates fell in many high-income countries between the early 2000s and the 2020s, but that the decline was uneven and coexisted with persistent local inequities.(13,14) Two properties make the OECD indicator well suited to this question. Its age-sex standardisation removes the demographic differences that would otherwise dominate a crude comparison, and its split into major and minor amputations preserves the clinical information that a single count would lose.(6) National applications have already used the broader framework to track healthcare quality over time, as shown for Korea,(15) and regional applications in Spain have extended the same logic to subnational monitoring.(16)
Most of the available trend evidence comes from single countries or from national registries rather than from a harmonised multi-country series.(17-19) Less attention has been paid to the divergence between major and minor amputations within the OECD indicator, and to the Latin American members of the OECD, where foot care programmes are still being consolidated.(7,20) Brazil and other middle-income settings outside the OECD report rising or persistently high burdens of diabetes-related limb loss, which suggests that the regional gradient is real rather than a reporting artefact.(21,22) Chile offers the only complete Latin American series within the indicator, and its hospital data point to a substantial burden of diabetic foot infection and limb loss.(23,24)
From a podiatric perspective, the distinction between major and minor amputations matters clinically. A minor amputation removes part of the foot while preserving weight-bearing function, whereas a major amputation removes the limb above the ankle and commits the patient to a prosthesis or a wheelchair. Countries can therefore report similar total amputation counts while facing very different functional outcomes, and a total that conceals a rising minor component may signal that limb salvage is working rather than failing.(14) Tracking the two levels separately is what allows an OECD-wide view to inform local foot care.
The objective of this study was to describe and compare age-sex standardised rates of diabetes-related major and minor lower-extremity amputations across OECD countries and to characterize their temporal evolution between 2004 and 2023. The hypothesis was that major amputation rates declined while minor amputation rates rose, and that Chile diverged from the OECD average over the period.
METHODS
Design and period
Ecological longitudinal analysis of routinely collected, country-aggregated administrative hospital data. The study followed the RECORD checklist for research conducted with routinely collected health data(25) and was reported in accordance with the STROBE statement for observational studies.(26) The analysis window was delimited between 2004 and 2023. The year 2004 was the earliest with any country reporting the combined indicator, and 2023 was the most recent year with data for all 28 reporting countries; individual countries contributed shorter series within that window. The choice of 2023 as the cross-sectional year was fixed before analysis, because it was the last year in which every included country reported.
Data source
Data were obtained from the OECD Health Care Quality Indicators database, dataflow DSD_HCQO (healthcare quality and outcomes).(27) The query returned annual observations for the two measures of interest, expressed as rates per 100 000 population aged 15 years and over. The analysis used two indicators: major lower-extremity amputation and minor lower-extremity amputation in adults with diabetes, both derived from unlinked hospital discharge data. Major amputations comprise procedures above the ankle and minor amputations comprise procedures below the ankle, following the OECD indicator definition.(6) For the total population the rates are standardised by age and sex, and for men and women separately they are standardised by age. The numerator counts hospital discharges that carry both a diabetes diagnosis and an amputation procedure, and the denominator is the resident population aged 15 years and over, which follows the convention of the indicator as validated by Carinci et al..(6) Only the observed values were used in the analysis; the confidence bounds published alongside them were not modelled. Two countries carry time-series break flags within the window, Denmark from 2019 and Slovenia from 2023, and these flags are reported in the source data. Each download was registered with its uniform resource locator, byte count, and access timestamp, and the analysis subset was stored as a tidy table of country, year, measure, sex, and rate, so that every number reported in the results can be traced back to that table.
Data structure and quality
The source data are organised as a multidimensional cube with the dimensions reference area, frequency, measure, unit of measure, age, sex, and statistical operation, together with the time period. The two measures were identified by the codes ADMRDMAI for major amputations and ADMRDMAO for minor amputations, the unit by the code for rates per 100 000 inhabitants, and the age dimension was restricted to 15 years and over. Values were downloaded as comma-separated tables through the format parameter of the application programming interface and checked against the structure metadata before analysis. Annual completeness is uneven: Germany and the United Kingdom reported only the year 2023, whereas Switzerland, Iceland, and Israel reported from 2000 onward. This heterogeneity is handled explicitly in the analysis rather than assumed away.
Countries
Twenty-eight OECD countries reported at least one year of data for both indicators and were included. The OECD mean was computed as the unweighted mean of the countries reporting in each year because the official OECD aggregate has no observations for these indicators. Mexico, Colombia, and Costa Rica did not report either indicator and were therefore not included; Chile was the only Latin American country with a complete series. This coverage limits the Latin American interpretation of the results, and the manuscript states the resulting caveat in the discussion. The included countries span all OECD regions, from Northern and Southern Europe to the Americas and the Asia-Pacific, which supports the use of the series for regional comparison.
Variables and outcomes
The primary outcome was the rate of any diabetes-related lower-extremity amputation, defined as the sum of the major and minor rates for each country and year. The sum is meaningful because both components share the same denominator and are mutually exclusive with respect to the level of the amputation. Secondary outcomes were the major and minor rates separately and the age-standardised major amputation rates for men and women. Country and year were the only exposures of interest in this descriptive design, and no individual-level covariates were available. Throughout, the term rate refers to the age-sex standardised rate per 100 000 population aged 15 years and over unless stated otherwise, and the term any amputation refers to the sum of major and minor amputations.
Statistical analysis
The 2023 cross-section was summarised with the OECD mean, the median, the interquartile range, and the range across countries. Temporal trends between 2004 and 2023 were estimated with linear mixed models of the form rate equals intercept plus slope times year, with year centred on 2004 and a random intercept for country, fitted by maximum likelihood; the slope expresses the average annual change in the rate with its 95% confidence interval. This specification accommodates the unbalanced panel, in which countries entered and left the series at different years, without forcing a common baseline, and it gives more weight to countries with longer series when estimating the population slope. The random-intercept specification was preferred over country fixed effects because it estimates the population-average slope while borrowing information across countries with short series, and because the interest is in the OECD-wide trajectory rather than in country-specific intercepts. Separate models were fitted for the any, major, and minor rates and for the male and female major rates. Country-level change was quantified for the 16 countries with at least eight annual observations as the difference and the percentage change between the earliest available year and 2023. A sensitivity analysis restricted the mixed models to those long-series countries to check that the estimates were not driven by short series. The any-amputation rate was derived as the arithmetic sum of the major and minor rates for each country-year, and the long-series OECD mean was computed as the mean of the countries' first and 2023 values. The OECD mean reported in the results was computed directly from the observed values each year and therefore describes the countries reporting in that year; it is not adjusted for the changing composition of the reporting set. The slope coefficient is interpreted as the mean change in the rate per additional calendar year, holding country composition constant through the random intercepts, and its confidence interval was computed from the standard error of the fixed-effect coefficient. The same model structure was applied to the male and female major-amputation rates, and no adjustment for multiplicity was applied because the four trend tests were prespecified as complementary rather than exploratory. Analyses were performed in Python 3.14 with pandas, statsmodels, and matplotlib. The significance level was set at 0.05.
Sensitivity and robustness
Two robustness checks accompanied the main analysis. The first restricted the mixed models to the 16 countries with at least eight annual observations, to confirm that short and recent series did not drive the slopes. The second recomputed the OECD mean as the median rather than the mean of the countries reporting in each year, to confirm that the trajectory was not produced by a few extreme countries. The median-based any-amputation mean rose from 15.8 per 100 000 in 2004 to 19.6 per 100 000 in 2023, the same direction as the mean-based trajectory.
RESULTS
Cross-national rates in 2023
In 2023 the OECD mean rate of any diabetes-related lower-extremity amputation was 23.5 per 100 000 population aged 15 years and over, with a median of 19.6 and an interquartile range from 15.0 to 25.2 per 100 000. The full range extended from 2.8 in Iceland to 69.1 in Malta, a 24.7-fold difference, with a long right tail produced by Malta and a small group of Central European countries. The mean major amputation rate was 7.0 per 100 000 and the mean minor amputation rate was 16.5 per 100 000, so minor procedures accounted for the larger share of the combined rate in most countries. Major rates ranged from 1.5 in Iceland to 16.6 in Israel, a 11.1-fold difference, whereas minor rates ranged from 1.3 in Iceland to 60.5 in Malta, a 46.5-fold difference. The five highest any-amputation rates were recorded in Malta, Czechia, Slovenia, Germany, and Chile; the five lowest were recorded in Iceland, Portugal, Italy, Korea, and Sweden. Ten countries stood above the OECD mean and eighteen stood below it. In every country except Portugal and Sweden the minor rate exceeded the major rate in 2023, and the between-country spread of the any rate was driven mainly by the minor component, whose 46.5-fold range was wider than the 11.1-fold range of the major component. Chile occupied the fifth highest position with 40.8 per 100 000, above the OECD mean (Table 1).
Country | Major | Minor | Any |
|---|---|---|---|
Malta | 8.6 | 60.5 | 69.1 |
Czechia | 16.4 | 29.4 | 45.8 |
Slovenia | 13.2 | 30.2 | 43.4 |
Germany | 8.6 | 34.6 | 43.2 |
Chile | 11.8 | 29.0 | 40.8 |
Israel | 16.6 | 16.9 | 33.5 |
Belgium | 4.8 | 20.4 | 25.2 |
Estonia | 11.0 | 14.2 | 25.2 |
Lithuania | 8.6 | 15.5 | 24.1 |
Australia | 2.3 | 21.3 | 23.6 |
Spain | 6.7 | 16.4 | 23.1 |
Austria | 6.9 | 15.0 | 21.9 |
Switzerland | 3.1 | 18.3 | 21.4 |
Netherlands | 5.9 | 14.0 | 19.9 |
Finland | 6.5 | 12.9 | 19.4 |
Latvia | 9.4 | 9.9 | 19.3 |
Romania | 4.3 | 14.6 | 18.9 |
Canada | 7.3 | 10.3 | 17.6 |
Ireland | 3.8 | 12.9 | 16.7 |
United Kingdom | 5.4 | 10.9 | 16.3 |
Luxembourg | 2.2 | 13.1 | 15.3 |
Norway | 6.5 | 7.6 | 14.1 |
Denmark | 3.3 | 9.4 | 12.7 |
Sweden | 7.5 | 4.3 | 11.8 |
Korea | 2.6 | 9.2 | 11.8 |
Italy | 2.7 | 8.2 | 10.9 |
Portugal | 7.9 | 2.9 | 10.8 |
Iceland | 1.5 | 1.3 | 2.8 |
OECD mean | 7.0 | 16.5 | 23.5 |
Note: Any amputation is the sum of major and minor amputations. Rates are age-sex standardised. OECD mean is the unweighted mean of the reporting countries.
Temporal change between 2004 and 2023
Reporting coverage expanded over the window, from 4 countries in 2004 to 9 in 2010, 14 in 2015, 19 in 2020, and 28 in 2023. The OECD mean of the any-amputation rate, computed across the countries reporting in each year, rose from 18.2 per 100 000 in 2004 to 23.5 per 100 000 in 2023. The two components moved in opposite directions. The major amputation rate declined by −0.08 per 100 000 per year on average (95% CI −0.10 to −0.05), a cumulative reduction of −1.4 per 100 000 over the window, while the minor amputation rate increased by 0.21 per 100 000 per year (95% CI 0.16-0.26), a cumulative rise of 4.0 per 100 000. The combined any-amputation rate therefore increased by 0.16 per 100 000 per year (95% CI 0.09-0.23). The annual changes in the any, major, and minor rates were all statistically significant (p = <0.001, p = <0.001, and p = <0.001, respectively). Restricting the models to the 16 long-series countries changed the estimates only marginally, with an any-amputation slope of 0.15 per 100 000 per year (95% CI 0.08-0.22), a major-amputation slope of −0.08, and a minor-amputation slope of 0.20 (Figure 1; Figure 2).
In level terms, the OECD mean major rate fell from 8.0 per 100 000 in 2004 to 7.0 per 100 000 in 2023, while the OECD mean minor rate rose from 10.3 to 16.5 per 100 000, so the gap between the two widened across the window. The any-amputation mean dipped to 20.4 per 100 000 in 2020 before reaching 23.5 per 100 000 in 2023.

Figure 1. OECD mean rate of any diabetes-related lower-extremity amputation, 2004 to 2023.
Note: Any amputation is the sum of major and minor amputations. The mean is unweighted across countries reporting each year.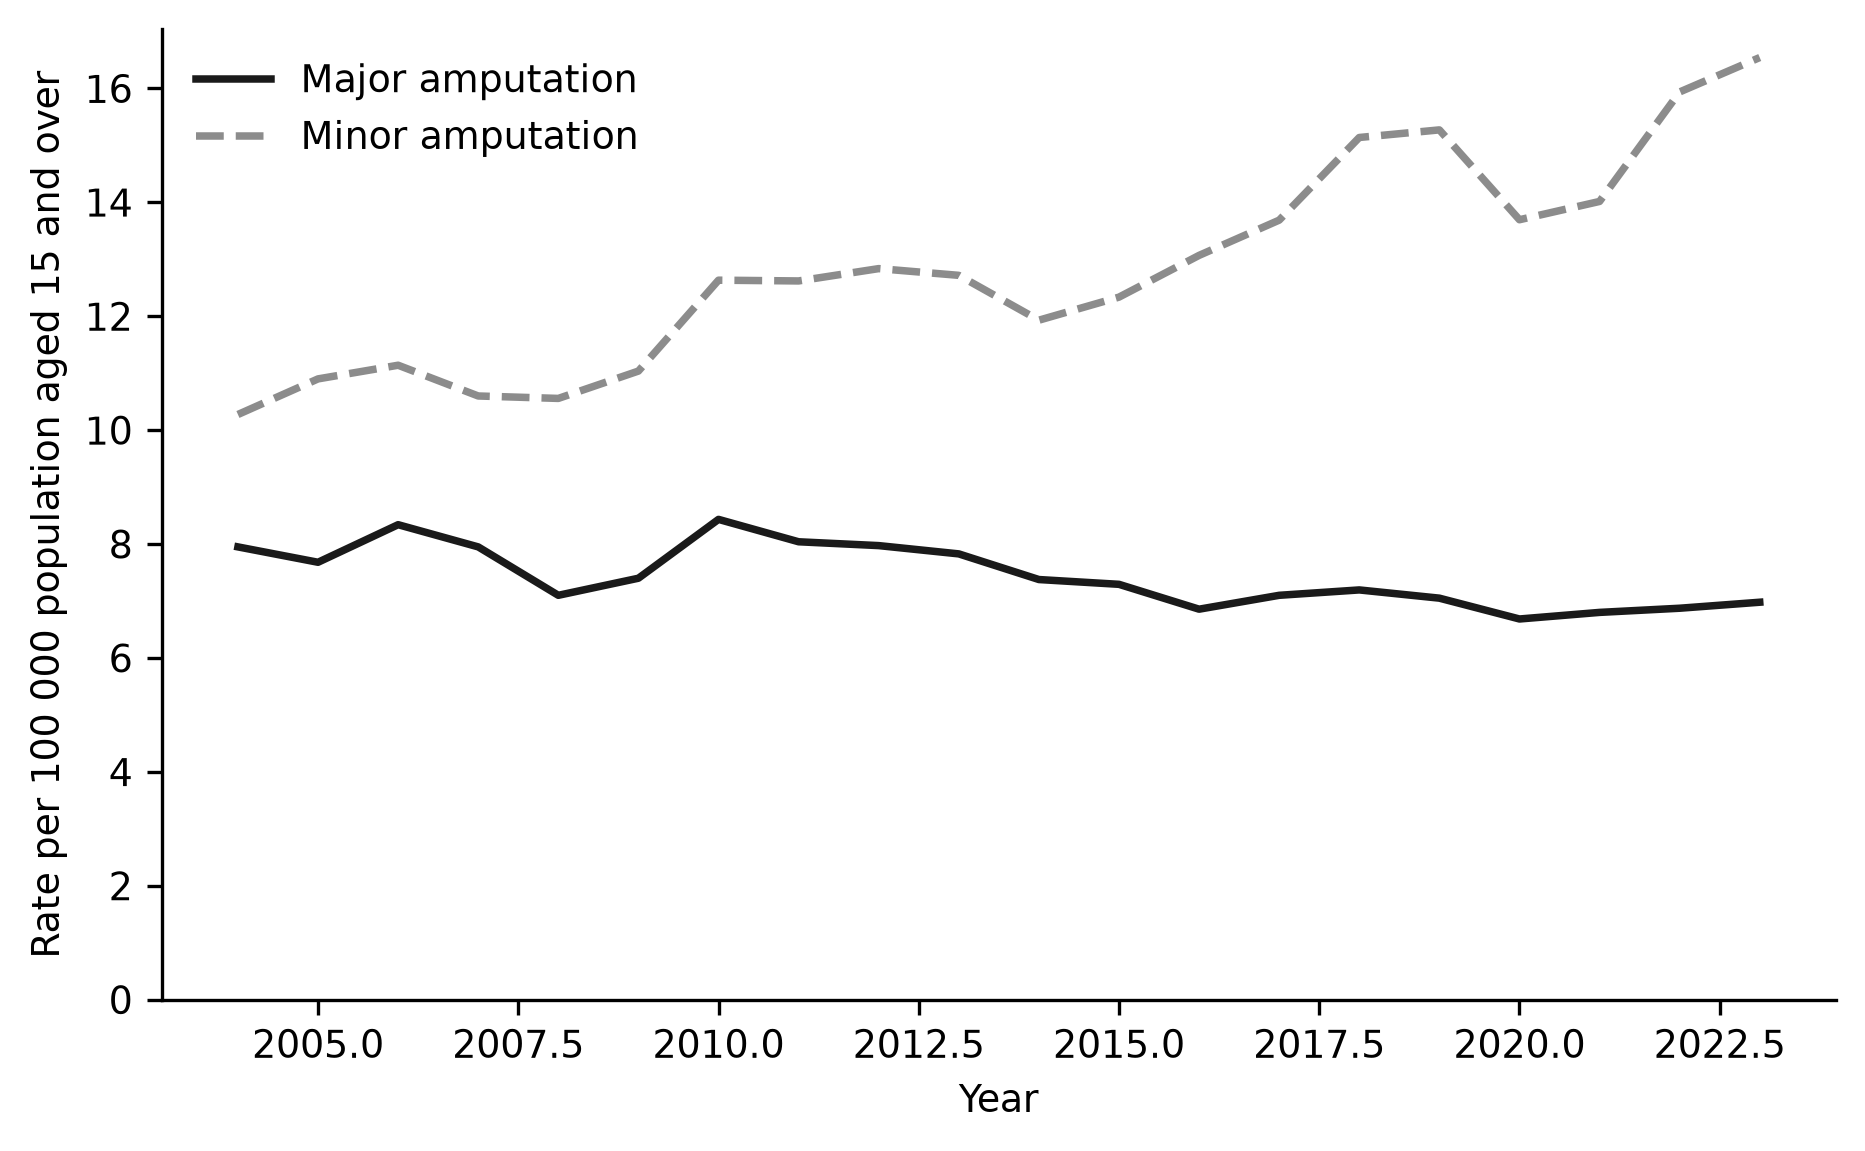
Figure 2. OECD mean rates of major and minor diabetes-related lower-extremity amputation, 2004 to 2023.
Note: Rates are age-sex standardised per 100 000 population aged 15 years and over.Change in countries with long series
Among the 16 countries with at least eight annual observations, the any-amputation rate fell in 5 countries and rose in 11 between the earliest available year and 2023. Declines were recorded in Denmark, Iceland, Sweden, Israel, and Austria, and increases were recorded in the remaining eleven countries. Relative change ranged from −31.0% in Denmark to 179.5% in Chile. The OECD mean of those 16 countries rose by 3.5 per 100 000, an increase of 19.4%, measured from each country's first available value to its 2023 value (Table 2).
Country | First year | First rate | 2023 rate | Absolute change | Relative change (%) |
|---|---|---|---|---|---|
Denmark | 2005 | 18.4 | 12.7 | -5.7 | -31.0 |
Iceland | 2000 | 3.3 | 2.8 | -0.5 | -15.2 |
Sweden | 2007 | 13.3 | 11.8 | -1.5 | -11.3 |
Israel | 2000 | 37.3 | 33.5 | -3.8 | -10.2 |
Austria | 2009 | 23.9 | 21.9 | -2.0 | -8.4 |
Czechia | 2010 | 42.7 | 45.8 | 3.1 | 7.3 |
Australia | 2016 | 21.2 | 23.6 | 2.4 | 11.3 |
Spain | 2016 | 19.2 | 23.1 | 3.9 | 20.3 |
Finland | 2011 | 16.0 | 19.4 | 3.4 | 21.2 |
Netherlands | 2014 | 16.4 | 19.9 | 3.5 | 21.3 |
Korea | 2008 | 9.7 | 11.8 | 2.1 | 21.6 |
Ireland | 2015 | 12.5 | 16.7 | 4.2 | 33.6 |
Lithuania | 2012 | 17.4 | 24.1 | 6.7 | 38.5 |
Switzerland | 2000 | 14.8 | 21.4 | 6.6 | 44.6 |
Latvia | 2014 | 11.3 | 19.3 | 8.0 | 70.8 |
Chile | 2004 | 14.6 | 40.8 | 26.2 | 179.5 |
OECD mean | 18.2 | 21.8 | 3.5 | 19.4 |
Note: Any amputation is the sum of major and minor amputations. First rate is the earliest available annual observation. OECD mean is the unweighted mean of the 16 countries shown.
Sex differences and the case of Chile
The age-standardised major amputation rate in 2023 averaged 11.3 per 100 000 in men and 3.5 per 100 000 in women, a male to female ratio of 3.2. The male excess was present in nearly every country, and in Iceland the female major amputation rate rounded to zero in 2023. Over the window, the male major amputation rate did not change clearly (slope −0.02 per 100 000 per year, 95% CI −0.06 to 0.02), whereas the female rate declined by −0.11 per 100 000 per year (95% CI −0.14 to −0.09). Chile moved against the OECD pattern. Its any-amputation rate rose from 14.6 per 100 000 in 2004 to 40.8 per 100 000 in 2023, an increase of 179.5%, driven by a major rate that rose from 4.6 to 11.8 and a minor rate that rose from 10.0 to 29.0. In 2004 Chile stood below the OECD mean; by 2023 it had moved to the fifth highest position. Its major rate of 11.8 per 100 000 approached the maximum of 16.6 per 100 000 recorded by Israel, and its minor rate of 29.0 per 100 000 was the second highest after Malta (Figure 3).

Figure 3. Rate of any diabetes-related lower-extremity amputation in Chile compared with the OECD mean, 2004 to 2023.
Note: Any amputation is the sum of major and minor amputations. OECD mean is unweighted across countries reporting each year.DISCUSSION
This study set out to describe diabetes-related lower-extremity amputation rates across OECD countries and to characterise their evolution between 2004 and 2023. Three findings emerged. First, the 2023 cross-section showed a 24.7-fold spread between Iceland and Malta. Second, major and minor amputations moved in opposite directions, with the major rate falling and the minor rate rising. Third, Chile diverged sharply upward, recording the largest relative increase of any long-series country.
The wide cross-national dispersion echoes the critical appraisal of the OECD indicator by Carinci et al.,(6) who found that even harmonised amputation rates varied several-fold between reporting countries. A recent meta-analysis of the global epidemiology of diabetic foot placed the burden of ulceration and limb loss on a similar gradient between high-income and lower-income settings,(1) and hospital studies in low-income and middle-income countries report amputations that occur earlier and carry high mortality.(4,22) Geographic variation within a single country reaches comparable magnitude, as Popescu et al.(28) documented for Medicare beneficiaries, which suggests that the OECD gradient reflects differences in care organisation rather than underlying biology alone. The low-rate countries include Denmark and Sweden, whereas the high-rate group spans Malta and several Central European systems, a pattern that does not align with national income and therefore points toward the organisation of foot care rather than wealth as the decisive factor. For the clinician, a 24.7-fold range means that two patients with otherwise similar diabetes face very different odds of limb loss depending on where they live, which is precisely the inequity that the indicator was designed to expose.
The declining major amputation rate is consistent with the systematic review of global temporal trends by Moody et al.(13) and with the country-level series from Switzerland,(17) Sweden,(18) Canada,(19) and Serbia.(29) The mechanisms proposed in those studies converge on earlier ulcer detection, structured multidisciplinary foot care, and improved revascularisation.(30-32) The stability of the major rate near its floor of 1.5 per 100 000 in Iceland suggests that some systems have approached the limit of what routine coding can capture, while others retain considerable room for improvement. The simultaneous rise in minor amputations supports a shift from above-ankle to below-ankle procedures rather than a genuine expansion of limb loss, a pattern also noted in global syntheses.(14) From a clinical standpoint, that shift is the expected signature of successful limb salvage: a patient who would previously have lost the leg now loses only the forefoot or a toe, and the functional consequence is far smaller. Part of the increase may nevertheless reflect improved coding and capture of minor procedures, a limitation that the unlinked design of the indicator cannot resolve, and the time-series break flags carried by Denmark and Slovenia show that such discontinuities are real.
The OECD mean dipped in 2020, the first pandemic year, and returned to its rising path by 2023. Aggregate discharge data cannot distinguish deferred procedures from genuine changes in care, so this dip is better read as a data discontinuity than as evidence about the effect of the pandemic on limb loss. The same caution applies to any single-year comparison based on hospital coding.
The completeness of the OECD indicator has been a concern since its early appraisal.(12) In this dataset, twelve of the 28 countries contributed fewer than eight annual observations, and several contributed only the most recent year, so the cross-section is complete while the longitudinal evidence rests on a narrower set. This does not invalidate the series, but it means that the trend estimates describe long-standing reporters more than recent entrants.
The rise in the combined rate should be read alongside the composition of the reporting set. Part of the increase between 2004 and 2023 reflects the arrival of countries with higher underlying rates, and the four countries that reported in 2004 were mostly low-rate countries. The mixed-model slope, which holds country composition constant, isolates the within-country change and still indicates a modest rise, driven entirely by the minor component. That slope is the finding that should anchor any interpretation of the OECD trajectory, and it is robust to the sensitivity analysis.
The male predominance in major amputations and the steeper decline in women parallel the sex differences reported in peripheral arterial disease cohorts.(33,34) The persistence of the male excess in 2023 indicates that prevention efforts have not yet closed the gap, and the treatment disparities documented across racial and geographic groups by Vogel et al.(35) suggest that equity gaps are not confined to sex. Because men enter the pathway with more advanced peripheral disease, the male excess may also reflect delayed presentation rather than a biological difference alone. For practice, this means that foot screening campaigns cannot assume that attendance translates into equal protection across sexes, and that risk communication may need to be tailored to men who present later.
The contrast between Denmark, which recorded the largest decline, and Chile, which recorded the largest rise, illustrates the range of what is achievable with the same indicator. Swedish series have attributed their declines to systematised multidisciplinary foot care within a universal health system,(18) whereas the Chilean rise coincides with a period in which its hospital data show a growing load of infected ulcers reaching surgery.(23) The distance between these two trajectories is not a matter of diabetes prevalence alone but of how foot care is organised and resourced.
For a podiatric readership, the Chilean trajectory deserves particular attention. Between 2004 and 2023 Chile moved from below the OECD mean to the fifth highest any-amputation rate, driven by both components. Regional analyses describe the same pressure: Latin American initiatives have identified barriers in screening, offloading, and revascularisation, and have argued that amputation reduction requires coordinated primary and hospital care.(7,20) A Brazilian time-series study reported a comparable upward burden in a middle-income setting.(21) Chilean hospital series describe a heavy burden of diabetic foot infection with frequent limb loss,(23) and Latin American microbiology data show that infection patterns differ from those of other continents, complicating empirical treatment.(24) Podiatric strategies that prevent ulcer recurrence and progression have been proposed as the main lever to reverse such trajectories.(36) The upward trajectory also matters for capacity planning, because a stable rate applied to a growing and ageing diabetic population still produces a rising number of amputations each year. The quality-measurement initiatives reported in Spain(16) and the multidimensional HCQI assessments applied in Korea(15) illustrate the kind of routine monitoring that would allow Chile and its neighbours to track progress.
The design of the study carries several strengths. It used a single harmonised indicator collected under the OECD framework, covered 28 countries over a 20-year window, and applied mixed models that accommodate the unbalanced national series instead of forcing a common baseline. The analyses are fully reproducible from the public application programming interface, and the primary outcome was defined before inspection of the results. Reporting both the observed level and the model-based slope separates the descriptive cross-section from the longitudinal inference, and the sensitivity analyses show that the conclusions do not depend on the treatment of short series or on the choice of the mean over the median.
From a policy and practice standpoint, the results argue for routine monitoring of both major and minor amputations rather than a single summary measure, because the summary can conceal a favourable decline in major procedures behind a rise in minor ones. The persistence of high rates in several countries, together with the evidence that prevention remains underfunded relative to treatment,(8) supports strengthening foot screening, offloading, and revascularisation capacity in primary and secondary care. For podiatry, the findings reinforce the value of prevention-oriented foot care as the intervention most likely to bend the minor and major trajectories downward, and they give clinics in high-burden countries a benchmark against which to judge local performance. Future work should link the OECD series to individual denominator data, should encourage the Latin American members to report so that the regional picture no longer depends on a single country, and should track the major and minor components separately so that a successful shift toward limb salvage is not mistaken for deterioration.
CONCLUSIONS
Between 2004 and 2023, diabetes-related lower-extremity amputation rates varied widely across OECD countries and followed divergent trajectories, with major amputations declining and minor amputations rising, so that the combined rate increased modestly at the OECD level. A single-number summary would have hidden both the progress and the remaining problem.
Chile was the only Latin American country with a complete series and recorded the largest increase of any long-series country, moving from below the OECD mean in 2004 to the fifth highest rate in 2023. Expanding comparable reporting and strengthening podiatric prevention in that country should be priorities.
References
- 1 Carollo M, Ingrasciotta Y, Crisafulli S, Maccarrone F, Pellegrino D, Francescon A, et al. Global Epidemiology of Diabetic Foot: A Systematic Review and Meta‐Analysis. Diabetes Metabolism Res. 2026;42(6):e70223. doi: 10.1002/dmrr.70223
- 2 Jeffcoate W, Boyko EJ, Game F, Cowled P, Senneville E, Fitridge R. Causes, prevention, and management of diabetes-related foot ulcers. The Lancet Diabetes & Endocrinology. 2024;12(7):472-482. doi: 10.1016/s2213-8587(24)00110-4
- 3 Fredslund EK, Londero LS, Buhl CS. Exploring the societal cost of major lower limb amputations in patients with type 2 diabetes – A nation-wide and matched register study using difference in difference analysis. Journal of Diabetes and its Complications. 2026;40(5):109310. doi: 10.1016/j.jdiacomp.2026.109310
- 4 Gupta R, Rastogi A. Reevaluating the mortality impact of lower extremity amputations in diabetes-related foot disease. Int J Diabetes Dev Ctries. 2026;46(2):383-385. doi: 10.1007/s13410-025-01492-z
- 5 Li Z, Hou Y, Wang D, Ma Y, Guo Y, Xu Y. Trends and Disparities in the Impact of Diabetes Mellitus Mortality and Disability, 1990–2021: A Systematic Analysis of the 2021 Global Burden of Disease Study. The American Journal of Tropical Medicine and Hygiene. 2025;113(6):1430-1441. doi: 10.4269/ajtmh.25-0335
- 6 Carinci F, Massi Benedetti M, Klazinga NS, Uccioli L. Lower extremity amputation rates in people with diabetes as an indicator of health systems performance. A critical appraisal of the data collection 2000–2011 by the Organization for Economic Cooperation and Development (OECD). Acta Diabetol. 2016;53(5):825-832. doi: 10.1007/s00592-016-0879-4
- 7 Campillo-Vilorio N, Aragón-Sánchez J. Latin American initiatives to improve foot care in people with diabetes: the effort to reduce diabetes-related lower extremity amputations. Diabetes Research and Clinical Practice. 2025;226:112385. doi: 10.1016/j.diabres.2025.112385
- 8 Han PY. Underinvesting in prevention: the costly blind spot in US diabetes care. Health Affairs Scholar. 2026;4(7):qxag190. doi: 10.1093/haschl/qxag190
- 9 F. C. Towards actionable international comparisons of health system performance: expert revision of the OECD framework and quality indicators. International Journal for Quality in Health Care. 2015;27(2):137-146. doi: 10.1093/intqhc/mzv004
- 10 Arah OA, Westert GP, Hurst J, Klazinga NS. A conceptual framework for the OECD Health Care Quality Indicators Project. International Journal for Quality in Health Care. 2006;18(suppl_1):5-13. doi: 10.1093/intqhc/mzl024
- 11 Mattke S, Epstein AM, Leatherman S. The OECD Health Care Quality Indicators Project: history and background. International Journal for Quality in Health Care. 2006;18(suppl_1):1-4. doi: 10.1093/intqhc/mzl019
- 12 Rotar AM, van den Berg MJ, Kringos DS, Klazinga NS. Reporting and use of the OECD Health Care Quality Indicators at national and regional level in 15 countries. Int J Qual Health Care. 2016;28(3):398-404. doi: 10.1093/intqhc/mzw027
- 13 Moody N, Murphy L, Sandford B, Nielsen R, Lyons M, Walter A, et al. Editor's Choice – Global Temporal Trends in the Incidence of Major Lower Limb Amputations: A Systematic Review and Meta-analysis. European Journal of Vascular and Endovascular Surgery. 2026;72(2):331-349. doi: 10.1016/j.ejvs.2026.04.028
- 14 Chuter V, Fitridge RA. Global Declines and Local Inequities: Understanding Amputation Outcomes Within and Between Countries. European Journal of Vascular and Endovascular Surgery. 2026;72(2):350-351. doi: 10.1016/j.ejvs.2026.05.010
- 15 Lee H, Hwang SH, Cho SA, Jung H, Chang Y, Yun J, et al. National Trends in Healthcare Quality in Korea: A Multidimensional Assessment Using OECD Health Care Quality Indicators (2008–2023). JPMPH. 2026;59(3):225-238. doi: 10.3961/jpmph.26.233
- 16 Arzuaga A, García-Casanovas A, Mas-Morán A, Megia-Colet A, Adam-Ruiz D, Barbazán-García E, et al. A cross-regional initiative for improving type 2 diabetes mellitus care quality measurement in Spain – The Diabetes Lighthouse project. Primary Care Diabetes. 2026;20(5):620-628. doi: 10.1016/j.pcd.2026.07.013
- 17 Schuster A, Wolf S, Neuenschwander J, Schöni M, Waibel FWA, Sydler C, et al. Lower extremity amputations in Switzerland: Trends in patients with and without diabetes, 2013–2023. International Journal of Cardiology Cardiovascular Risk and Prevention. 2026;30:200696. doi: 10.1016/j.ijcrp.2026.200696
- 18 Hellstrand Tang U, Hellgren M, Sundberg L. Incidence and Hospitalization Costs of Lower Extremity Amputations in Patients with Diabetes During 2015–2020: A Regional Retrospective Observational Study from Sweden. J Am Podiatr Med Assoc. 2026;116(5):66. doi: 10.3390/japma116050066
- 19 Kim AY, Hanley J, Fuhrer R, de Mestral C. Temporal Trends in the Rates of Foot Complications and Lower Extremity Amputation Related to Type 1 and Type 2 Diabetes in Adults in Selected Canadian Provinces. Canadian Journal of Diabetes. 2025;49(4):249-255.e3. doi: 10.1016/j.jcjd.2025.03.003
- 20 Carrillo-Larco RM, Guzman-Vilca WC, Varghese JS, Pasquel FJ, Caixeta R, Antini C, et al. Compliance with eye and foot preventive care in people with self-reported diabetes in Latin America and the Caribbean: Pooled, cross-sectional analysis of nine national surveys. Primary Care Diabetes. 2024;18(3):374-379. doi: 10.1016/j.pcd.2024.03.001
- 21 Ribeiro Junior CA, Santos SDS, Amaral TLM. Trend and burden of lower-limb amputations due to diabetes: time series analysis, Amazonas, 2012–2021. Epidemiol Serv Saúde. 2026;35:e20250534. doi: 10.1590/s2237-96222026v35e20250534.en
- 22 Alberts KN, Companie MN, Kerrod MP, Davies J, Bock RDE, Swart C, et al. Lower Limb Amputations Among Individuals Living With Diabetes Mellitus in Low‐ and Middle‐Income Countries: A Systematic Review and Meta‐Analysis. World j surg. 2026;50(9):2750-2759. doi: 10.1002/wjs.70493
- 23 Fica A, Carrasco Escobar G. Diabetic Foot Infection: Exploratory Analysis of Its Clinical Profile, Microbiology, and Outcomes. Rev méd Chile. 2026;154(1):13-24. doi: 10.4067/s0034-98872026000100013
- 24 Carro GV, Saurral R, Salvador Sagüez F, Witman EL. Diabetic Foot Infections: Bacterial Isolates From the Centers and Hospitals of Latin American Countries. The International Journal of Lower Extremity Wounds. 2022;21(4):562-573. doi: 10.1177/1534734620976305
- 25 Benchimol EI, Smeeth L, Guttmann A, Harron K, Moher D, Petersen I, et al. The REporting of studies Conducted using Observational Routinely-collected health Data (RECORD) Statement. PLoS Med. 2015;12(10):e1001885. doi: 10.1371/journal.pmed.1001885
- 26 von Elm E, Altman DG, Egger M, Pocock SJ, Gøtzsche PC, Vandenbroucke JP. The Strengthening the Reporting of Observational Studies in Epidemiology (STROBE) statement: guidelines for reporting observational studies. The Lancet. 2007;370(9596):1453-1457. doi: 10.1016/s0140-6736(07)61602-x
- 27 Organisation for Economic Co-operation and Development (OECD). Health Care Quality Indicators (HCQI): lower extremity amputation in adults with diabetes [Internet]. 2026. Available from: https://sdmx.oecd.org/public/rest/data/OECD.ELS.HD,DSD_HCQO@DF_HCQO,2.1
- 28 Popescu I, Hernandez H, Plasencia G, Schutz S, Birnbaum D, Gurvey J, et al. Geographic Variation in Amputations for Medicare Patients With Diabetic Lower-Extremity Wounds. JAMA Netw Open. 2026;9(5):e2613616. doi: 10.1001/jamanetworkopen.2026.13616
- 29 Tanaskovic S, Ilijevski N, Koncar I, Matejevic D, Popovic M, Stefanovic Z, et al. Analysis of Lower Extremity Amputations from the SerbVasc Registry. J Endovasc Ther. 2025;32(4):1018-1026. doi: 10.1177/15266028231199919
- 30 Chiu CW, Yao WT, Yu CM, Chen YF, Chan YS, Huang HY, et al. Multidisciplinary Management Improves Re-Admission, Major Amputation, and Mortality Rates in Patients with Diabetic Foot Ulcers. Advances in Wound Care. 2026;15(10):711-721. doi: 10.1089/wound.2024.0182
- 31 Manji A, Basiri R, Harton F, Rommens K, Manji K. Effectiveness of a Multidisciplinary Limb Preservation Program in Reducing Regional Hospitalization Rates for Patients With Diabetes-Related Foot Complications. The International Journal of Lower Extremity Wounds. 2025;24(1):117-123. doi: 10.1177/15347346241238458
- 32 Campbell DR, Nguyen TTT. International Efforts to Improve Limb Salvage. Clinics in Podiatric Medicine and Surgery. 2025;42(4):781-790. doi: 10.1016/j.cpm.2025.06.002
- 33 Shammas NW. Sex Differences in Peripheral Arterial Disease: Presentation, Treatment, and Outcomes. Int J Angiol. 2026;35(03):170-173. doi: 10.1055/a-2886-6566
- 34 Satam K, Terrazos-Moreno R, Alameddine D, Zhou H, DeWane A, Mena-Hurtado C, et al. Female Patients Have More Reinterventions after Lower Extremity Revascularization for Peripheral Arterial Disease. Annals of Vascular Surgery. 2026;133:432-439. doi: 10.1016/j.avsg.2026.08.002
- 35 Vogel B, Dangas K, Di Muro FM, Sartori S, Oliva A, Dangas G, et al. Temporal and Geographic Trends in the Treatment of Peripheral Arterial Disease Stratified by Race Among Medicare Beneficiaries. JAMA Cardiol. 2025;10(8):820. doi: 10.1001/jamacardio.2025.1714
- 36 Chávez Moya MO, Cabrera LH, Ramírez LM, González González MA, Pazos AA, Fernández Feitó LB, et al. From ulcer to remission: podiatric and technological strategies to prevent ulceration and amputation in the diabetic foot. SAP Podiatry. 2026;3:160. doi: 10.62486/pod2026160
Declarations
Funding
No financing
Conflict of interest
None
Authorship contributions
Drafting – original draft: Freddy Ednildon Bautista-Vanegas, Jhossmar Cristians Auza-Santivañez, Arian Jesús Cuba Naranjo, Yudiel Pérez Yero, Jorge Márquez-Molina.
Writing–review and editing: Freddy Ednildon Bautista-Vanegas, Jhossmar Cristians Auza-Santivañez, Arian Jesús Cuba Naranjo, Yudiel Pérez Yero, Jorge Márquez-Molina.