
Abstract
Introduction: Foot and toe injuries are a frequent reason for emergency department visits among children, yet the consumer products and activities involved are rarely described at the national level. Methods: Serial cross-sectional analysis of the National Electronic Injury Surveillance System from 2005 to 2024. We selected visits by children aged 0 to 17 years with a foot or toe injury, applied survey weights to obtain national estimates, and quantified annual trends with linear and Poisson regression. Results: The sample contained 178,147 visits, corresponding to an estimated 5,633,890 national visits (95% CI: 5,383,331-5,884,449). Team sports (16.1%), furniture and home furnishings (12.8%), stairs and floors (10.0%) and hardware and tools (9.1%) were the leading categories. The annual national estimate fell from 324,907 in 2005-2007 to 208,290 in 2022-2024, a decrease of −35.9%, with a mean annual change of −8,133 visits (95% CI: −10,502 to −5,765). Conclusions: Foot and toe injuries in children are common and are attributable mainly to team sports, home furniture and structural surfaces, and hardware; national estimates declined steadily over two decades.
Keywords
foot injuries, toe injuries, child, emergency department, consumer product safety, public health surveillance
INTRODUCTION
Injuries are among the most common reasons for emergency department visits among children in the United States, and a large share of these visits are associated with consumer products, sports and recreational activities.(1,2) The National Electronic Injury Surveillance System (NEISS), operated by the U.S. Consumer Product Safety Commission, was designed to capture this burden directly: it records, in a stratified probability sample of roughly 100 hospital emergency departments, the body part injured, the diagnosis, the disposition, the location and the consumer product or activity associated with each case, together with a sample weight that converts raw counts into national estimates of the number of visits for a given product, body part or diagnosis.(3) Because the sample is drawn from hospitals of different sizes and strata, the weighting is essential: raw case counts in the file do not represent the number of injured children in the country, and only the weighted sums support statements about the national burden. This design offers a decisive advantage over administrative discharge datasets, which contain diagnoses and demographic information but lack the product codes that link an injury to the object or activity that caused it. For prevention, that link is the information that matters, because a fracture is actionable only when the clinician and the public health agency know whether it involved a basketball game, a staircase or a piece of furniture. The analytic approach of this study therefore follows the surveillance logic of NEISS rather than a clinical registry: the unit of interest is not the patient trajectory but the product-attributable visit, aggregated through survey weighting over a twenty-year period.
Foot and toe injuries occupy a specific and only partially described place within pediatric trauma. The foot is the first point of contact with the ground during most falls, impacts and collisions, and the toes are exposed to crush, puncture and stubbing injuries that other body regions escape. Foot and ankle injuries generate considerable health care use and cost in the general population,(4) and acute fractures of the pediatric foot and ankle are described as a distinct clinical and epidemiologic entity with age-specific patterns that reflect the maturation of the physis and the changing exposure to sport.(5,6) Analyses of NEISS have shown that pediatric fractures account for a substantial share of emergency department resource use,(7) and dedicated recent studies have characterized toe fractures related to sports and recreation,(8) foot and ankle injuries in female athletes,(9) and hand and foot fractures with growth plate involvement.(10) Most product-specific pediatric NEISS studies, however, have examined a single sport or product, including basketball,(11) soccer,(12) dance,(13) gymnastics(14) and bicycles.(15) What the literature still lacks is a consolidated, product-level description of the causes of foot and toe injuries across the whole of childhood, together with a measurement of how the national burden has changed over time. That gap matters for podiatric practice and for injury prevention, because guidance directed at one sport or one product cannot rank the competing priorities that parents and clinicians actually face, and because the relative importance of sports, home furniture and everyday objects shifts as children grow.
The aim of this study was to characterize foot and toe injuries in children treated in United States emergency departments, to identify the consumer products and activities involved overall and by age group, and to quantify changes in national estimates over time. The age-specific analysis was included because the product exposures of a preschool child and an adolescent are different in kind, and the trend analysis was included because prevention planning requires knowing whether the problem is growing, stable or receding.
METHODS
Study design and data source
We conducted a serial cross-sectional analysis of a national injury surveillance system, reported in accordance with the STROBE recommendations for observational studies and the RECORD extension for routinely collected data. Data were obtained from the NEISS Injury Data 2005-2024 dataset, a consolidated reproduction of the annual public NEISS files published by the U.S. Consumer Product Safety Commission.(3) NEISS is a stratified probability sample of approximately 100 hospital emergency departments in the United States, selected from the universe of hospitals with at least six beds and a 24-hour emergency department, and refreshed over time; each record represents one emergency department visit and carries a sample weight that converts raw counts into national estimates of the number of visits associated with a given product, body part or diagnosis.(3) The consolidated dataset joins the 20 annual files into a single tabular archive of 7,326,429 records covering the years 2005 through 2024, with a year column added during consolidation. Because the source files are public and de-identified, the study did not require institutional review board approval or informed consent.
Study population and variables
We selected records with a primary body part code of foot (code 83) or toe (code 93) and an age between 0 and 17 years, for treatment dates from 2005 through 2024. Records with a missing or nonpositive sample weight were excluded from weighted estimates. Body part, diagnosis, disposition and location codes were interpreted with the standard NEISS coding scheme. Age was categorized as 0-4, 5-9, 10-14 and 15-17 years. Sex was recorded as male or female. Diagnosis was grouped into fracture, strain or sprain, contusion or abrasion, laceration, puncture, crushing and other; the other category included dislocations, avulsions, amputations, foreign bodies, burns, hematomas and diagnoses not otherwise specified. Disposition was grouped into treated and released, admitted or transferred (including observation), and other. Injury location was grouped into home, sports or recreation place, school, street or highway, other public property, and unknown or other.
The primary product or activity associated with the injury (NEISS product 1 code) was mapped to 12 mutually exclusive categories derived from the CPSC product code list: team sports, individual sports and exercise, wheeled sports and vehicles, playground equipment, pools and amusement, stairs and floors, doors, furniture and home furnishings, hardware and tools, glass and sharp objects, footwear, and toys. Team sports grouped basketball, soccer, football, baseball, softball, volleyball, track and field and other ball sports; wheeled sports and vehicles grouped bicycles, skateboards, scooters, all-terrain vehicles and powered off-road vehicles; hardware and tools grouped nails and screws, pins and needles, metal containers, knives, garden tools and manicuring devices. Products not belonging to any of these categories, or records without a specified product code, were assigned to an other or not specified category. The category definitions were fixed before the analysis and were not modified after examining the results.
Data cleaning
The analysis was restricted to records with a complete treatment date, a valid body part code and a positive sample weight. Records with a missing or zero weight were excluded before the weighted estimates were computed, because they cannot contribute to a national total; their number was negligible relative to the sample. No record-level imputation was performed for any variable. The narrative text field was not used to reclassify products or body parts, so that the analysis remained reproducible from the coded fields alone and did not depend on manual text interpretation. Duplicate case identifiers were not an issue because the consolidated archive retains one record per emergency department visit.
Statistical analysis
National estimates were computed as the sum of the NEISS sample weights within each subgroup, and subgroup percentages were computed as the ratio of each subgroup total to the overall national estimate. The standard error of the total national estimate was obtained with a Taylor-series approximation for a stratified cluster design, in which the design stratum was the combination of the NEISS stratum and the calendar year and the primary sampling unit was the hospital. This choice reflects the fact that NEISS redraws its hospital sample over time and that the sample weight is year-specific, so treating stratum by year as the design stratum reproduces the structure of the annual samples within one pooled analysis. For each design stratum the between-hospital variance of the hospital-level weighted totals was summed and multiplied by the finite-sample factor n/(n-1), where n is the number of hospitals in the stratum, and the 95% confidence interval (CI) was calculated as the estimate plus or minus 1.96 standard errors. Strata containing a single hospital contributed no variance in this approximation. Descriptive results are presented as weighted national estimates with column percentages.
The unit of analysis was the emergency department visit, not the injured child, so a child treated on two occasions contributed two records to the surveillance file. Annual estimates were assigned to the calendar year of the treatment date, and the series therefore reflects 20 consecutive calendar years without interpolation. No seasonal adjustment was applied, because the interest of the study was the year-to-year trajectory rather than within-year variation, and no standardization for age or sex was performed on the annual series because the population denominator needed for direct standardization was not part of the surveillance design.
Annual trends were quantified in two complementary ways. First, the mean change in the annual national estimate per calendar year was estimated with ordinary least squares regression of the annual estimate on year, and is reported with its 95% CI, p value and coefficient of determination; the CI of the slope was computed with the t distribution and 18 degrees of freedom for 20 annual observations. Second, as an alternative specification, a Poisson regression of the annual count on year, with year centered at 2005, was fitted with Huber-White (HC0) sandwich standard errors, and the per-year rate ratio with its 95% CI was reported. The Poisson specification treats the annual estimates as count data, and the sandwich standard errors accommodate the overdispersion that arises from year-to-year variation in the surveillance sample. Changes between periods were expressed as the relative difference between three-year averages, comparing 2005-2007 with 2022-2024, so that single-year fluctuations did not dominate the comparison. All statistical tests were two-sided.
Sensitivity analyses
Three sensitivity analyses assessed the stability of the principal results. The national total was recomputed after restricting the sample to children aged 0 to 14 years. The trend was recomputed separately for foot and for toe injuries, and after excluding 2020 and 2021 to remove the period of emergency department disruption associated with the COVID-19 pandemic. The pre-pandemic change was quantified separately by comparing the 2005-2007 average with the 2018-2019 average. Statistical significance was set at a two-sided alpha of 0.05, and 95% confidence intervals were used throughout.
RESULTS
Principal finding
Between 2005 and 2024 the sample contained 178,147 emergency department visits for a foot or toe injury among children aged 0 to 17 years, corresponding to an estimated 5,633,890 national visits (95% CI: 5,383,331-5,884,449), or a mean of 281,694 visits per year. Foot injuries accounted for an estimated 3,987,970 visits (70.8%) and toe injuries for 1,645,920 visits (29.2%). The total was materially unchanged when the sample was restricted to children aged 0 to 14 years, who contributed 4,532,802 visits (80.5% of the total). Males accounted for 55.1% of visits and females for 44.9%, corresponding to 3,102,303 and 2,531,143 visits, respectively.
The largest age group was 10-14 years (39.5%), followed by 5-9 years (27.0%), 15-17 years (19.5%) and 0-4 years (14.0%) (Table 1). The most frequent diagnoses were contusion or abrasion (21.6%), fracture (17.8%) and laceration (17.0%), with strain or sprain in 15.5% and puncture in 8.4%. Crushing injuries were uncommon (0.7%), and the remaining diagnoses, grouped as other, included dislocations, avulsions, amputations, foreign bodies and burns, and represented 19.0% of visits. Most children were treated and released (98.4%), and only 0.8% were admitted or transferred. Home was the most common location (43.3%), ahead of sports or recreation places (15.7%) and school (8.3%); the location was unknown or other in 28.3% of visits.
Variable | Category | National estimate | Percent |
|---|---|---|---|
Sex | Male | 3102303 | 55.1 |
Sex | Female | 2531143 | 44.9 |
Age group | 0-4 years | 790992 | 14.0 |
Age group | 5-9 years | 1519108 | 27.0 |
Age group | 10-14 years | 2222702 | 39.5 |
Age group | 15-17 years | 1101088 | 19.5 |
Body part | Foot | 3987970 | 70.8 |
Body part | Toe | 1645920 | 29.2 |
Diagnosis | fracture | 1004240 | 17.8 |
Diagnosis | strain or sprain | 875716 | 15.5 |
Diagnosis | contusion or abrasion | 1217282 | 21.6 |
Diagnosis | laceration | 959760 | 17.0 |
Diagnosis | puncture | 470528 | 8.4 |
Diagnosis | crushing | 37478 | 0.7 |
Diagnosis | other | 1068886 | 19.0 |
Disposition | treated and released | 5542808 | 98.4 |
Disposition | admitted or transferred | 44132 | 0.8 |
Disposition | other | 46950 | 0.8 |
Location | home | 2438380 | 43.3 |
Location | sports or recreation | 883806 | 15.7 |
Location | school | 465418 | 8.3 |
Location | street or highway | 95180 | 1.7 |
Location | other public property | 157823 | 2.8 |
Location | unknown or other | 1593282 | 28.3 |
Note: Weighted national estimates; percentages are column percentages of the overall national estimate. Source: CPSC NEISS, consolidated 2005-2024 (Layered-Labs/neiss-injury-data).
Products and activities
Team sports were the leading product and activity category, accounting for an estimated 909,210 visits or 16.1% of the national estimate, followed by furniture and home furnishings (722,553 visits; 12.8%), stairs and floors (565,309 visits; 10.0%) and hardware and tools (513,732 visits; 9.1%) (Table 2). Individual sports and exercise contributed 472,360 visits (8.4%), wheeled sports and vehicles 374,923 visits (6.7%), and playground equipment 267,939 visits (4.8%). Doors accounted for 233,375 visits (4.1%), footwear for 172,484 visits (3.1%), glass and sharp objects for 171,286 visits (3.0%), and pools and amusement for 100,880 visits (1.8%). Products outside the prespecified categories, or without a specified product, accounted for 1,087,986 visits (19.3%).
The product profile changed markedly with age. Team sports were negligible in the youngest children and concentrated in the 10-14 and 15-17 year age groups, whereas furniture and home furnishings, hardware and tools, and stairs and floors predominated in children younger than 10 years. Playground equipment was most prominent at 5-9 years, and doors contributed their largest share at 0-4 years. The two extreme age groups illustrated the shift: at 0-4 years furniture and home furnishings led, followed by hardware and tools and stairs and floors, while at 15-17 years team sports led, followed by individual sports and exercise and furniture and home furnishings.
Product category | Overall | Percent | 0-4 y | 5-9 y | 10-14 y | 15-17 y |
|---|---|---|---|---|---|---|
Team sports | 909210 | 16.1 | 5480 | 103510 | 501130 | 299090 |
Furniture and home furnishings | 722553 | 12.8 | 190882 | 209934 | 222826 | 98912 |
Stairs and floors | 565309 | 10.0 | 71731 | 137531 | 240012 | 116036 |
Hardware and tools | 513732 | 9.1 | 73965 | 175711 | 178779 | 85278 |
Individual sports and exercise | 472360 | 8.4 | 37882 | 110158 | 203005 | 121314 |
Wheeled sports and vehicles | 374923 | 6.7 | 35814 | 116594 | 154456 | 68059 |
Playground equipment | 267939 | 4.8 | 41647 | 123368 | 90079 | 12845 |
Doors | 233375 | 4.1 | 51204 | 70129 | 78682 | 33360 |
Footwear | 172484 | 3.1 | 16842 | 46865 | 70107 | 38670 |
Glass and sharp objects | 171286 | 3.0 | 38529 | 59239 | 50791 | 22728 |
Pools and amusement | 100880 | 1.8 | 10715 | 36628 | 40652 | 12885 |
Toys | 41852 | 0.7 | 16939 | 15117 | 8023 | 1774 |
Other or not specified | 1087986 | 19.3 | 199361 | 314326 | 384162 | 190137 |
Note: Weighted national estimates for the 2005-2024 period; Percent is the share of the overall national estimate. Values for age groups are weighted national estimates within each age group. Source: CPSC NEISS, consolidated 2005-2024 (Layered-Labs/neiss-injury-data).
Trends over time
The annual national estimate declined from 313,584 visits in 2005 to 219,164 in 2024, with the highest annual estimate in 2010 (343,050 visits) (Table 3; Figure 1). Comparing three-year averages, the national estimate fell from 324,907 visits in 2005-2007 to 208,290 in 2022-2024, a decrease of −35.9%. Linear regression estimated a mean change of −8,133 visits per year (95% CI: −10,502 to −5,765; p <0.001), with year explaining 0.7% of the variance. The decline was already present before the COVID-19 pandemic: the three-year average fell −19.0% between 2005-2007 and 2018-2019. A pronounced trough occurred in 2020, followed by a partial recovery through 2024 (Table 3).
Year | Foot | Toe | Total |
|---|---|---|---|
2005 | 225778 | 87805 | 313584 |
2006 | 230897 | 97704 | 328601 |
2007 | 238490 | 94047 | 332536 |
2008 | 236797 | 92926 | 329723 |
2009 | 223469 | 91911 | 315380 |
2010 | 243236 | 99814 | 343050 |
2011 | 237257 | 92327 | 329584 |
2012 | 238543 | 95091 | 333633 |
2013 | 219148 | 86664 | 305812 |
2014 | 223229 | 90488 | 313717 |
2015 | 212967 | 86831 | 299798 |
2016 | 203786 | 81211 | 284998 |
2017 | 210734 | 86964 | 297697 |
2018 | 185802 | 84280 | 270082 |
2019 | 178379 | 78015 | 256395 |
2020 | 116455 | 55880 | 172334 |
2021 | 128998 | 53096 | 182094 |
2022 | 142786 | 57781 | 200567 |
2023 | 141962 | 63178 | 205140 |
2024 | 149257 | 69907 | 219164 |
Note: Weighted national estimates by calendar year. Source: CPSC NEISS, consolidated 2005-2024 (Layered-Labs/neiss-injury-data).
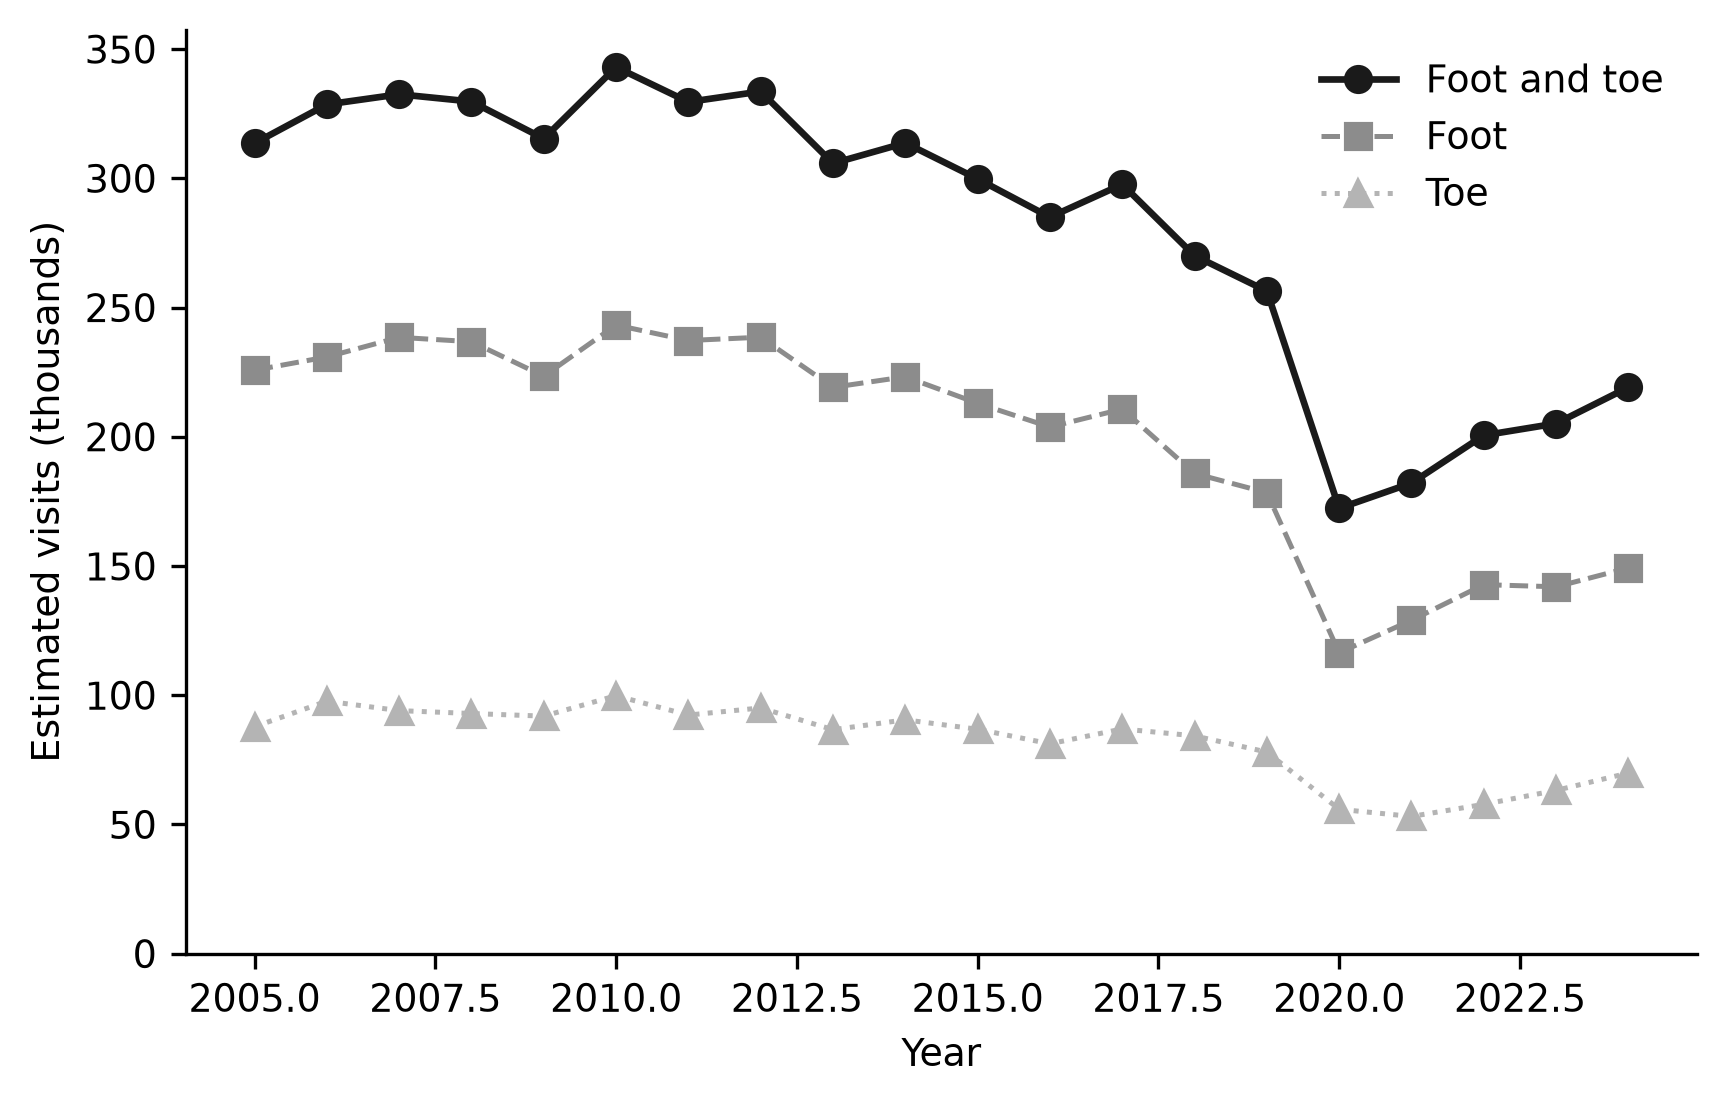
Figure 1. Annual national estimates of pediatric foot and toe injuries, 2005-2024.
Note: Total, foot and toe estimates by calendar year. Source: CPSC NEISS, consolidated 2005-2024 (Layered-Labs/neiss-injury-data).Sensitivity analyses
When 2020 and 2021 were excluded, the annual decline remained, with a mean change of −6,879 visits per year (95% CI: −8,745 to −5,013; p <0.001). The downward trend was observed separately for foot injuries (−6,105 visits per year; p <0.001) and for toe injuries (−2,029 visits per year; p <0.001). Because the annual foot estimate exceeded the toe estimate in every year of the series, the absolute decline in foot injuries was larger, whereas the relative trajectory of the two body parts remained broadly parallel (Table 3).
Alternative specifications
In a Poisson regression of the annual count on calendar year with sandwich standard errors, the per-year rate ratio was 0.97 (95% CI: 0.96-0.98; p <0.001), consistent with an average reduction of approximately 2.9% per year and with the magnitude estimated by linear regression.
DISCUSSION
The principal finding of this study is that foot and toe injuries in children are frequent, are attributable to a limited set of consumer products and activities, and declined steadily over two decades. Team sports, furniture and home furnishings, stairs and floors, and hardware and tools together accounted for nearly half of all estimated emergency department visits, and the estimated national burden fell by more than one third between the mid-2000s and the early 2020s. The absolute scale of the problem is substantial: even at the end of the study period, roughly one quarter of a million children were treated in emergency departments each year for these injuries, and the vast majority were discharged the same day, which means that the burden falls on families and on primary and urgent care rather than on hospital beds. Because the decline preceded the pandemic and persisted after excluding 2020 and 2021, it cannot be explained by the temporary reduction in emergency department use during those years.
The prominence of team sports is consistent with product-specific pediatric studies. Basketball, soccer, American football and baseball or softball are repeatedly identified as leading causes of lower-extremity injuries in children presenting to emergency departments,(11,12,16-18) and soccer-related fractures and lower-extremity sports injuries in high school athletes follow the same pattern.(19,20) Our finding that these injuries concentrate in the 10-14 year age group agrees with the age distribution reported for youth sports injuries(12) and for foot and ankle injuries in female athletes.(9) Individual sports and exercise, which contributed a further share of the estimate, reproduce the same mechanism: weightlifting injuries in the pediatric population are described as a growing and age-concentrated problem,(21) inversion injuries of the ankle and foot are associated with sports participation,(22) and racket sports including pickleball have emerged as additional sources of lower-extremity and pediatric fractures in recent NEISS analyses.(23,24) The contrast between the negligible contribution of team sports in children younger than 5 years and their dominance in school-aged children reflects the age at which organized sports participation begins.
The demographic profile of the series is what would be expected from the exposure gradient of childhood, and its stability across sensitivity analyses indicates that no single age band determined the results. The slight male predominance is consistent with the sex distribution reported in most pediatric injury surveillance studies,(1,11) and the concentration of visits in the 10-14 year age group matches the peak of organized sport and unstructured play in late childhood.(12) The small share of children younger than 5 years does not indicate that preschool children are protected from foot injury; it indicates that their injuries arise in different settings and from different objects, as the age-specific product profile shows. The persistence of the 0-14 year subgroup at more than four fifths of the national estimate also confirms that the findings are not an artifact of adolescents approaching adult patterns of injury.
The contribution of home structures, furniture and hardware points to a different injury mechanism, concentrated in younger children. Stairs, floors, doors, beds, chairs and tables generate crushing, contusion and laceration injuries when children fall, jump or close doors on their feet, and bed-related jumps are an established pediatric emergency presentation.(25) Hardware and tools, together with glass and sharp objects, produce puncture and laceration injuries, and foot foreign bodies from sharp objects are a recognized pediatric emergency presentation.(26) The category profile in the youngest children, in which furniture, hardware and stairs predominated over sports, is consistent with the home-centered activity of preschool children. Consumer product-related fractures in children are described with a similar predominance of the home environment,(2) and emerging indoor consumer products such as virtual reality equipment add a new domestic source of injury that did not exist at the start of the study period.(27)
Footwear warrants specific comment in a podiatric reading of these data. It was the product coded for about three percent of visits, a share that reflects both the protective and the injurious roles of shoes: footwear can cushion impact and prevent puncture, but it can also contribute to blisters, falls and friction injuries, and its association with a visit does not by itself distinguish these mechanisms. The age gradient of the footwear category, which rose from the preschool years toward adolescence, parallels the shift from soft infant shoes to athletic and fashion footwear in older children, and is consistent with the podiatric literature that links shoe type to lower-extremity complaints in school-aged children.(6)
Wheeled sports and vehicles, playground equipment and pools contributed smaller but preventable shares. Bicycle injuries, including spoke injuries of the lower extremity, are a longstanding pediatric problem,(15,28) and scooters, both powered and nonpowered, have generated a growing and partly severe burden of emergency department visits.(29-33) Trampolines have been recognized as a source of childhood injury for decades,(34) and our playground category, which includes trampolines, remained relevant at 5-9 years. Diving-related injuries in swimming pools complete the water-based component of the pool category.(35) Lawn mower injuries deserve separate mention because they produce the most severe pediatric foot trauma, including amputations and long-term disability.(36,37)
The diagnosis profile is consistent with a mixed mechanism of low-energy contusions and higher-energy fractures and sprains. Contusions and abrasions were the most frequent diagnosis, followed by fractures and lacerations, a distribution similar to that reported for pediatric fractures and foot injuries in emergency settings.(7,10) Toe fractures specifically have been described as predominantly sports-related,(8) which agrees with the sports predominance observed here, and the incidence of fractures in childhood is known to rise with age in parallel with exposure.(38) The very low proportion of admissions is expected for minor foot and toe trauma, although the severe end of the spectrum, particularly lawn mower injuries, carries substantial morbidity.(36) The management burden of these injuries in emergency departments is concentrated in the clinical distinction between sprains and fractures, for which decision rules such as the Ottawa Ankle Rules have been validated in pediatric settings,(39) and lower-extremity injuries from snow sports illustrate the seasonal and sport-specific variation that underlies the annual series.(40) The near-universal discharge from the emergency department also means that the true workload of these injuries extends beyond the emergency setting into follow-up visits, imaging and podiatric care, none of which is visible in the surveillance data. The relative importance of each product category, rather than the diagnosis alone, is therefore the more useful basis for the advice given at discharge.
The decline in national estimates is the finding that most directly supports prevention planning. It parallels the decrease recently described for youth soccer lower-extremity injuries(12) and is directionally consistent with the stable or falling rates reported for several pediatric sport-related presentations.(41) The magnitude of the decline, more than one third over two decades, is large enough to be visible to clinicians and to surveillance analysts alike, and it occurred against a background of population growth, which means that the per-capita reduction was at least as large as the reduction in the raw weighted count. Plausible explanations include safer product design, playground surface improvements, protective footwear and reductions in certain risky activities, although the surveillance design does not allow these mechanisms to be tested. The decline also coincides with a period in which the pediatric injury literature shifted toward product-specific rather than overall descriptions, which may explain why an integrated account of foot and toe injuries was missing.(1,7)
The overall decline should not be read as a uniform reduction across every product category. Studies of weightlifting(21) and pickleball(23,24) have reported increases in specific pediatric exposures over overlapping periods, and powered scooters have risen from near absence at the start of the series to a visible share of pediatric emergency visits.(29,30) These category-specific increases are compatible with a declining total: the products involved are less frequent than the large established categories, so their growth attenuates but does not reverse the overall downward trajectory. This coexistence of falling totals and rising niche exposures is a reminder that prevention targets should be tracked at the product level, where countervailing trends can otherwise cancel out in the aggregate.
Several mechanisms could underlie the observed decline, and the data allow them to be stated but not distinguished. Safer playground surfacing, improved bicycle and scooter design, and changes in the way sports are supervised and equipped could each reduce the energy transferred to the foot and toe in a fall or impact. Changes in emergency department triage and in the availability of urgent care could shift minor injuries away from the sampled emergency departments even when the underlying injury rate is unchanged, a secular bias that surveillance data cannot fully exclude. Finally, the composition of childhood activity has changed over two decades, with evidence that time spent in organized outdoor play has declined in some settings; a reduction in exposure to the activities that concentrate in the 10-14 year age group would produce exactly the downward slope observed here. Distinguishing these explanations would require linkage of the surveillance series to independent measures of activity and of care-seeking behavior, and it is the most important unanswered question raised by these data.
The strengths of this study are the national probability sample, the long observation period, the product-level coding that administrative data lack, and the explicit sensitivity analyses that confirm the stability of the principal results under alternative assumptions. The analysis was also fully reproducible from coded fields, without dependence on manual narrative interpretation. The limitations should be read alongside these strengths. NEISS captures only emergency department visits, so injuries treated in outpatient clinics or at home are not represented, and the estimates describe visits rather than incident injuries. Product coding relies on the narrative interpretation of each case by hospital coders, which introduces misclassification that could blur the boundaries between adjacent categories. The other or not specified category, which contained one fifth of the estimate, limits the precision of the product ranking and should motivate better coding or narrative-based classification in future studies. The variance estimator treats hospitals as sampled with replacement within strata, a standard but approximate approach for NEISS, and the annual regression models are based on 20 yearly observations. These limitations suggest three directions for future work: linkage of NEISS with narrative text classification to reduce the unspecified category, validation of product coding in a subsample of records, and prospective studies that test whether specific prevention measures explain the observed decline. For clinical practice, the results identify the products and activities to prioritize in anticipatory guidance, and they support continued attention to sports footwear and to the home environment of preschool children as the settings where most pediatric foot and toe injuries occur. For podiatric practice in particular, the concentration of team-sport injuries in school-aged children and of furniture and hardware injuries in preschool children points to two different counseling messages, one addressed to footwear and sport safety and the other to home hazard reduction. For policy, the persistence of lawn mower and powered vehicle injuries despite the overall decline indicates that the severe end of the pediatric foot injury spectrum still requires product-level regulation and enforcement.
CONCLUSIONS
This study characterized pediatric foot and toe injuries treated in United States emergency departments over two decades, identified team sports, home furniture and structural surfaces, and hardware as the leading associated products and activities, and showed that national estimates declined steadily over time. The findings provide a product-specific basis for prevention and suggest that home safety in early childhood and sports-related protection in school-aged children remain the priorities for reducing this burden.
References
- 1 Kamboj AK, Chounthirath T, Hodges NL, Smith GA. Nonfatal Pediatric Injuries Associated With Consumer Products and Sports and Recreational Activities in the United States. Pediatr Emer Care. 2020;36(9):e485-e493. doi: 10.1097/pec.0000000000001778
- 2 Yu J, Badeti J, Chounthirath T, Smith GA. Consumer product-related fractures among children younger than 18 years old treated in United States emergency departments, 1990–2023. Inj Epidemiol. 2025;12(1):89. doi: 10.1186/s40621-025-00641-6
- 3 Layered Labs. NEISS Injury Data 2005-2024 [Internet]. 2025. Available from: https://huggingface.co/datasets/Layered-Labs/neiss-injury-data
- 4 De Boer AS, Schepers T, Panneman MJ, Van Beeck EF, Van Lieshout EM. Health care consumption and costs due to foot and ankle injuries in the Netherlands, 1986–2010. BMC Musculoskelet Disord. 2014;15(1):128. doi: 10.1186/1471-2474-15-128
- 5 Halai M, Jamal B, Rea P, Qureshi M, Pillai A. Acute fractures of the pediatric foot and ankle. World J Pediatr. 2015;11(1):14-20. doi: 10.1007/s12519-015-0002-x
- 6 Horner K, Tavarez M. Pediatric Ankle and Foot Injuries. Clinical Pediatric Emergency Medicine. 2016;17(1):38-52. doi: 10.1016/j.cpem.2016.01.003
- 7 Farrell C, Hannon M, Monuteaux MC, Mannix R, Lee LK. Pediatric Fracture Epidemiology and US Emergency Department Resource Utilization. Pediatr Emer Care. 2022;38(7):e1342-e1347. doi: 10.1097/pec.0000000000002752
- 8 Norceide D, Onor GI, Akingbola O, Justice W, Amponsah NF, Okulaja A, et al. The Epidemiology of Sports and Recreation Related Toe Fractures in the United States. Foot & Ankle Orthopaedics. 2025;10(2):24730114251342797. doi: 10.1177/24730114251342797
- 9 Balachandran U, Jain C, Tanghe KK, Mulcahey MK, Fantry A, Gianakos AL, et al. A sport-specific assessment of foot and ankle injuries in female patients: An analysis of national injury trends from 2014 to 2023. Sports Orthopaedics and Traumatology. 2025;41(4):365-372. doi: 10.1016/j.orthtr.2025.05.007
- 10 Zhu T, Qiu X, Deng H, Feng H, Chen J, Huang Z, et al. Clinical analysis of 1301 children with hand and foot fractures and growth plate injuries. BMC Musculoskelet Disord. 2024;25(1):270. doi: 10.1186/s12891-024-07407-z
- 11 Houlihan N, England P, Kiani SN, Ganley T. The Epidemiology of Pediatric Basketball Injuries Presenting to US Emergency Departments. Pediatr Emer Care. 2023;39(4):242-246. doi: 10.1097/pec.0000000000002931
- 12 Chun AG, Snyder EM, Obana KK, Ashinsky BG, Parisien RL, Bottiglieri TS, et al. Youth Soccer Lower Extremity Injuries Presenting to US Emergency Departments Are Decreasing: A 10‐Year Analysis of National Injury Data. Arthroscopy, Sports Medicine, and Rehabil. 2025;7(3):101140. doi: 10.1016/j.asmr.2025.101140
- 13 Vassallo AJ, Hiller C, Stamatakis E, Pappas E. Epidemiology of Dance-Related Injuries Presenting to Emergency Departments in the United States, 2000-2013. Medical Problems of Performing Artists. 2017;32(3):170-175. doi: 10.21091/mppa.2017.3028
- 14 Tisano B, Zynda AJ, Ellis HB, Wilson PL. Epidemiology of Pediatric Gymnastics Injuries Reported in US Emergency Departments: Sex- and Age-Based Injury Patterns. Orthopaedic Journal of Sports Medicine. 2022;10(6):23259671221102478. doi: 10.1177/23259671221102478
- 15 Chen WS, Dunn RY, Chen AJ, Linakis JG. Epidemiology of Nonfatal Bicycle Injuries Presenting to United States Emergency Departments, 2001–2008. Academic Emergency Medicine. 2013;20(6):570-575. doi: 10.1111/acem.12146
- 16 Hoge C, Sabbagh R, Morgan M, Grawe BM. Epidemiology of youth and high school American football-related injuries presenting to United States emergency departments: 2010-2019. The Physician and Sportsmedicine. 2022;50(4):332-337. doi: 10.1080/00913847.2021.1931980
- 17 Lee A, Farooqi A, Abreu E, Talwar D, Maguire K. Trends in pediatric baseball and softball injuries presenting to emergency departments. The Physician and Sportsmedicine. 2023;51(3):247-253. doi: 10.1080/00913847.2022.2040888
- 18 Lee A, Farooqi AS, Talwar D, Maguire KJ. Pediatric Softball Injuries Presenting to Emergency Departments. Pediatr Emer Care. 2022;38(7):e1365-e1368. doi: 10.1097/pec.0000000000002754
- 19 Kuczinski A, Newman JM, Piuzzi NS, Sodhi N, Doran JP, Khlopas A, et al. Trends and Epidemiologic Factors Contributing to Soccer-Related Fractures That Presented to Emergency Departments in the United States. Sports Health: A Multidisciplinary Approach. 2019;11(1):27-31. doi: 10.1177/1941738118798629
- 20 Brant JA, Johnson B, Brou L, Comstock RD, Vu T. Rates and Patterns of Lower Extremity Sports Injuries in All Gender-Comparable US High School Sports. Orthopaedic Journal of Sports Medicine. 2019;7(10):2325967119873059. doi: 10.1177/2325967119873059
- 21 MAROUN R, DAHER M, BOUFADEL P, COVARRUBIAS O, CASEY JC, LOPEZ R, et al. Epidemiology of weightlifting injuries in the pediatric population: 20-year assessment of nationwide emergency department visit data. J Sports Med Phys Fitness. 2025;65(9):1185-1193. doi: 10.23736/s0022-4707.25.16182-3
- 22 Sapogovskiy AV, Kenis VM, Agranovich OЕ, Trofimova SI, Abramov IA, Petrova EV, et al. Inversion injury of ankle joint and foot in children: association with sports participation and comorbidities (analysis based on medical information system data). Pediatr Traum Orthop Reconstr Surg. 2025;13(1):38-48. doi: 10.17816/ptors653455
- 23 Ghattas YS, Zeblisky P, Cassinat J, Aceto M, Spindler KP, Cannada LK. Pickleball-Related Fractures in the United States From 2002 to 2022: An Analysis Using the NEISS Database. Orthopaedic Journal of Sports Medicine. 2024;12(6):23259671241255674. doi: 10.1177/23259671241255674
- 24 Lee PM, Nishi R, Obana KK, Chan SM, You JK, Weiss JM, et al. Pickleball‐Related Geriatric Fractures and Pediatric Equipment‐Related Injuries Are Increasing in Emergency Departments Across the United States. Arthroscopy, Sports Medicine, and Rehabil. 2025;7(5):101228. doi: 10.1016/j.asmr.2025.101228
- 25 Walton CEN, Hussey RW, Reeves PT. No more kids jumping on the bed-emergency departments visits, 2013–2022. The American Journal of Emergency Medicine. 2025;92:161-164. doi: 10.1016/j.ajem.2025.03.013
- 26 Bhat AA, AlRashed RM, Alkhamash J. Diagnosis of foot foreign bodies with ultrasound: a case series from the pediatric emergency department. J Ultrason. 2025;25(102):20250030. doi: 10.15557/jou.2025.0030
- 27 Cucher DJ, Kovacs MS, Clark CE, Hu CKP. Virtual reality consumer product injuries: An analysis of national emergency department data. Injury. 2023;54(5):1396-1399. doi: 10.1016/j.injury.2023.01.030
- 28 Chu G, Vlok L, Zwaag-Pijls C, Houser CM, de Groot B. Emergency Department Management and Follow-up of Children with Bicycle Spoke Injuries. The Journal of Emergency Medicine. 2014;47(3):259-267. doi: 10.1016/j.jemermed.2014.04.028
- 29 Blomberg SNF, Rosenkrantz OCM, Lippert F, Collatz Christensen H. Injury from electric scooters in Copenhagen: a retrospective cohort study. BMJ Open. 2019;9(12):e033988. doi: 10.1136/bmjopen-2019-033988
- 30 Magee LC, Chan C, Talwar D, Maguire KJ, Horn BD. A Comparison of Motorized and Nonmotorized Scooter Injuries in Pediatric Patients Seen in US Emergency Departments. Pediatr Emer Care. 2022;38(6):e1314-e1319. doi: 10.1097/pec.0000000000002706
- 31 Griffin R, Parks CT, Rue LW, McGwin G. Comparison of Severe Injuries Between Powered and Nonpowered Scooters Among Children Aged 2 to 12 in the United States. Ambulatory Pediatrics. 2008;8(6):379-382. doi: 10.1016/j.ambp.2008.08.002
- 32 Fernandez AN, Li KD, Patel HV, Allen IE, Ghaffar U, Hakam N, et al. Injuries With Electric vs Conventional Scooters and Bicycles. JAMA Netw Open. 2024;7(7):e2424131. doi: 10.1001/jamanetworkopen.2024.24131
- 33 Escalante Freitez MF. Orofacial injuries from powered scooters in United States emergency departments: a serial cross-sectional analysis of national estimates. SAP Dentistry. 2025;3:161. doi: 10.62486/dent2025161
- 34 Smith GA. Injuries to Children in the United States Related to Trampolines, 1990–1995: A National Epidemic. Pediatrics. 1998;101(3):406-412. doi: 10.1542/peds.101.3.406
- 35 Houlihan N, Shah R, Adams A, Talwar D, MacAlpine EM, Weltsch D, et al. Pediatric Diving-Related Injuries in Swimming Pools Presenting to US Emergency Departments. Pediatr Emer Care. 2023;39(11):821-827. doi: 10.1097/pec.0000000000003007
- 36 Vosburgh CL, Gruel CR, Herndon WA, Sullivan JA. Lawn Mower Injuries of the Pediatric Foot and Ankle: Observations on Prevention and Management. Journal of Pediatric Orthopaedics. 1995;15(4):504-509. doi: 10.1097/01241398-199507000-00019
- 37 Ren KS, Chounthirath T, Yang J, Friedenberg L, Smith GA. Children treated for lawn mower-related injuries in US emergency departments, 1990–2014. The American Journal of Emergency Medicine. 2017;35(6):893-898. doi: 10.1016/j.ajem.2017.03.022
- 38 Pasco JA, Lane SE, Brennan-Olsen SL, Holloway KL, Timney EN, Bucki-Smith G, et al. The Epidemiology of Incident Fracture from Cradle to Senescence. Calcif Tissue Int. 2015;97(6):568-576. doi: 10.1007/s00223-015-0053-y
- 39 MacLellan J, Smith T, Baserman J, Dowling S. Accuracy of the Ottawa Ankle Rules applied by non-physician providers in a pediatric emergency department. CJEM. 2018;20(5):746-752. doi: 10.1017/cem.2017.399
- 40 DeFroda SF, Gil JA, Owens BD. Epidemiology of lower extremity injuries presenting to the emergency room in the United States: Snow skiing vs. snowboarding. Injury. 2016;47(10):2283-2287. doi: 10.1016/j.injury.2016.07.005
- 41 Tyler JR, Sandler AB, Albagli A, Gilat R, Scanaliato JP, Parnes N. The National Epidemiology of Ankle Sprains in the United States: Updates From 2010 to 2024. Orthopedics. 2025;48(6):371-377. doi: 10.3928/01477447-20251021-01
Declarations
Funding
No financing
Conflict of interest
None
Authorship contributions
Drafting – original draft: Lauren Morgan, Roberto Lombardo.
Writing–review and editing: Lauren Morgan, Roberto Lombardo.