
Abstract
Introduction: Diabetic foot and lower-limb amputation are the most disabling end stage of diabetes, yet their joint hospital burden has not been characterized in Chile as an integrated framework. Methods: Ecological time-series analysis of 26,348,569 national hospital discharges between 2004 and 2019 from the open DEIS microdata mirror (Universidad de Chile repository, CC-BY 4.0). Diabetic foot was a main diagnosis in E10.5-E14.5 and lower-limb amputation a principal surgical procedure code from toe to hip. Crude rates used World Bank population estimates and average annual percent change was estimated by Poisson regression. Results: The period recorded 126,169 diabetic foot discharges and 74,414 lower-limb amputations. The diabetic foot rate rose from 32.9 to 48.6 per 100,000 inhabitants (AAPC 3.5%; 95% CI 3.4-3.7) and the amputation rate from 11.9 to 32.7 (AAPC 7.2%; 95% CI 7.0-7.3). Men contributed 71.2% of diabetic foot and 72.0% of amputation discharges, persons aged 65 years or older concentrated half of the burden, and the Metropolitana region accumulated 32.1% of diabetic foot discharges while Nuble showed the highest internal rate. Major amputations carried 8.0% in-hospital mortality. Conclusions: Diabetic foot and lower-limb amputation discharges grew continuously between 2004 and 2019, concentrated in men, older adults and specific regions, and the amputation burden rose faster than the diabetic foot burden. These temporal, demographic, geographic and clinical components integrate into one framework of the diabetic foot and amputation pathway.
Keywords
diabetic foot, amputation surgical, hospitalization, epidemiology, Chile
INTRODUCTION
Foot complications mark the closing stage of diabetes mellitus and concentrate its most severe hospital consequences. The International Diabetes Federation estimated 537 million adults living with diabetes worldwide in 2021, a figure projected to reach 783 million by 2045, with a growing share of the increase in middle-income countries.(1) The NCD Risk Factor Collaboration showed that the number of adults with diabetes rose faster than the population in most regions between 1990 and 2022, and that treatment coverage remained incomplete.(2) Chile follows this regional pattern: diabetes is among the leading causes of death and disability in the country, and its burden is distributed unevenly across socioeconomic groups.(3)
Diabetic foot arises when neuropathy, ischemia and infection combine in the lower limb, and it precedes most non-traumatic lower-limb amputations. Armstrong et al.(4) reported that 19% to 34% of people with diabetes will develop a foot ulcer in their lifetime and that roughly half of ulcers become infected, with a fifth of moderate or severe infections progressing to amputation. Boulton et al.(5) documented that a lower limb is lost to diabetes somewhere in the world every 30 seconds and that mortality after a major amputation rivals that of many cancers. The global burden is not uniform: Moxey et al.(6) found wide variability in amputation incidence across countries, and Prompers et al.(7) showed in a European cohort that ischemia and infection were already present in most patients at first ulcer presentation. These data locate diabetic foot and amputation where diabetes epidemiology meets hospital care, the point at which prevention is feasible and failure is costly.(8,9)
The hospital pathway from diabetic foot to amputation can be decomposed into components that are measurable in routine discharge data: a temporal component that tracks annual volume and trends, a demographic component that describes sex and age, a geographic component that maps regions, and a clinical severity component that captures amputation level, mortality and length of stay. Chilean studies have examined pieces of this pathway, such as the association between the diabetic foot amputation index and metabolic control(10) or the impact of multidisciplinary foot teams,(11) and national discharge data have been used to describe other conditions in Chile.(12,13) Regional initiatives across Latin America have also documented efforts to organize foot care and to reduce amputations.(14,15) Yet the available studies remain fragmentary: they describe single centers, single outcomes or single regions, and they do not connect the temporal, demographic, geographic and clinical dimensions of the problem.
This fragmentation matters for planning, because the components behave differently and require different responses. The temporal component answers whether the amputation burden is rising or falling, the demographic component identifies whom screening should reach first, the geographic component locates where services are missing, and the clinical severity component quantifies the deaths and bed days at stake. A single framework that links them would let clinicians, health services and policymakers monitor the whole pathway with the same administrative data that Chile already collects.
The objective of this study was to quantify the hospital burden of diabetic foot and lower-limb amputation in Chile and to integrate its temporal, demographic, geographic and clinical components into one framework. The specific objectives were to describe national discharge volumes and annual trends between 2004 and 2019, to characterize their distribution by sex, age and region, to quantify amputation level, in-hospital mortality and length of stay, and to articulate these components into a conceptual model of the diabetic foot and amputation pathway.
METHODS
This was an observational, retrospective, population-based ecological time-series study of national hospital discharge records, reported according to the RECORD checklist for studies
All hospital discharges recorded in Chile between 1 January 2004 and 31 December 2019 were eligible. The period starts in 2004 because the principal surgical procedure code became complete that year, and ends in 2019 because it was the last complete year available in the open data release.
Data source
The unit of analysis was the hospital discharge. Records came from the open-access replication files of the Chilean hospital discharge microdata maintained by the Departamento de Estadisticas e Informacion de Salud (DEIS) of the Ministry of Health and mirrored in the research data repository of the Universidad de Chile under a CC-BY 4.0 license.( 17) The official DEIS portal returned an HTTP 403 error at the time of access, so the open mirror was used and is declared here. Files are tabular, anonymous, and include one row per discharge with sex, age in completed years at admission, region of residence, year of discharge, the main diagnosis coded with the International Classification of Diseases, tenth revision, the principal surgical procedure coded with the Chilean FONASA tariff, discharge condition and length of stay.
Case definitions
A diabetic foot discharge was defined as a record whose main diagnosis was E10.5, E11.5, E12.5, E13.5 or E14.5, that is, diabetes mellitus with peripheral circulatory complications. This category is the standard proxy for diabetic foot admissions in discharge data that carry only a main diagnosis and no secondary diagnoses. A sensitivity definition extended the set to E10.6-E14.6 and L97X, which capture other specified diabetes complications and lower-limb ulcer.
A lower-limb amputation discharge was defined as a record whose principal surgical procedure code corresponded to a toe, transmetatarsal, ankle, leg, knee, thigh or hip amputation. Minor amputations were toe and transmetatarsal procedures, and major amputations were ankle disarticulation, below-knee, through-knee, above-knee, hip disarticulation and inter-ilio abdominal procedures. Revision of an amputation stump was not counted as a new amputation. A diabetes-related amputation was a lower-limb amputation with any diabetes mellitus main diagnosis in E10-E14.
The definitions were chosen to be reproducible and transparent. The peripheral circulatory complication code captures the diabetic foot as the reason for admission rather than diabetes as a comorbid condition, which is the appropriate unit for a discharge-level analysis, and the surgical tariff code identifies the amputation as the action performed during the admission rather than as a pre-existing limb absence. Both codes are the same fields used for reimbursement in the Chilean public system, which favors their completeness and consistency over time.
Variables and outcomes
The outcomes were the annual number of diabetic foot discharges, the annual number of lower-limb amputations, the annual number of diabetes-related amputations, in-hospital mortality and length of stay. In-hospital mortality was the proportion of discharges with a deceased condition at discharge, and length of stay was recorded in days. Stratifying variables were sex (male or female), age group (younger than 45, 45 to 64, 65 to 74, and 75 years or older) and region of residence. Region was aggregated to the 16-region structure released by DEIS; one annual file showed a coding shift between two regions in 2012 that was retained as released and diluted by the 16-year aggregation. Crude rates were computed with national, sex-specific and broad age-group population estimates for Chile retrieved from the World Bank open data API.( 18) The internal regional rate used the region's total hospital discharges as the denominator, which adjusts for hospital volume and population size without requiring external subnational population estimates, and it is reported per 10,000 discharges.
Data quality
The main diagnosis field was complete in more than 99.99% of records and the surgical procedure flag was available for the whole study period, so missingness was negligible for the variables used here. Sex was missing in a small fraction of records and region of residence was complete, with a residual category for unknown or foreign residence. Records with missing sex were excluded from sex-specific analyses but retained in national totals, and records with unknown region were retained and reported separately. The open files do not include secondary diagnoses or secondary procedures, so the definitions rely on the main diagnosis and the principal procedure, as described.
Ethical aspects
The study used anonymous, aggregate, publicly available administrative data with no possibility of re-identification of patients, and therefore required no ethics committee review. No individual-level clinical intervention was performed. The data were accessed and processed under the license terms of the open repository, and the substitution of the official portal by the open mirror is disclosed in the data source description.
RESULTS
Between 2004 and 2019 the database contained 26,348,569 hospital discharges, of which 126,169 carried a main diagnosis of diabetic foot and 74,414 recorded a lower-limb amputation. Four components organize the findings.
Component 1. Temporal component
The temporal component captures the national volume and annual trajectory of diabetic foot and amputation discharges. The diabetic foot discharge rate rose from 32.9 to 48.6 per 100,000 inhabitants between 2004 and 2019, a relative increase of 47.6%, with an average annual percent change of 3.5% (95% CI 3.42-3.67). In absolute terms the annual count climbed from 5,332 to 9,336 discharges. The amputation rate grew faster, from 11.9 to 32.7 per 100,000, a relative increase of 174.3% and an average annual percent change of 7.2% (95% CI 6.98-7.33), while the annual count rose from 1,932 to 6,284. Diabetes-related amputations grew faster still, at 8.0% per year (95% CI 7.78-8.22). The rise was not uniform across the period: both rates climbed steeply until 2014 and then stabilized, with the diabetic foot rate remaining between 49 and 50 per 100,000 and the amputation rate between 32 and 34 per 100,000 in the last five years. The broader sensitivity definition of diabetic foot that added E10.6-E14.6 and L97X yielded 156,888 discharges over the period and reproduced the same upward trajectory. The annual series is shown in (Table 1) and the trajectory in (Figure 1).
year | df_n | df_rate | amp_n | amp_rate | amp_minor | amp_major | amp_diab |
|---|---|---|---|---|---|---|---|
2004 | 5332 | 32.9 | 1932 | 11.9 | 1150 | 782 | 1126 |
2005 | 5685 | 34.8 | 2296 | 14.0 | 1273 | 1023 | 1281 |
2006 | 6157 | 37.3 | 2492 | 15.1 | 1445 | 1047 | 1495 |
2007 | 6915 | 41.5 | 3519 | 21.1 | 2224 | 1295 | 2086 |
2008 | 7140 | 42.4 | 3246 | 19.3 | 1980 | 1266 | 2049 |
2009 | 7061 | 41.5 | 4025 | 23.7 | 2560 | 1465 | 2539 |
2010 | 7953 | 46.3 | 4395 | 25.6 | 2775 | 1620 | 2654 |
2011 | 7933 | 45.7 | 4965 | 28.6 | 3146 | 1819 | 3173 |
2012 | 8430 | 48.1 | 5247 | 30.0 | 3374 | 1873 | 3489 |
2013 | 8784 | 49.7 | 5536 | 31.3 | 3617 | 1919 | 3702 |
2014 | 8786 | 49.2 | 5699 | 31.9 | 3682 | 2017 | 3825 |
2015 | 8968 | 49.7 | 6170 | 34.2 | 4082 | 2088 | 4150 |
2016 | 9076 | 49.7 | 5963 | 32.6 | 3935 | 2028 | 3953 |
2017 | 9322 | 50.2 | 6358 | 34.3 | 4100 | 2258 | 4305 |
2018 | 9291 | 49.2 | 6287 | 33.3 | 4033 | 2254 | 4094 |
2019 | 9336 | 48.6 | 6284 | 32.7 | 4182 | 2102 | 4078 |
Note: Rates per 100,000 inhabitants. Diabetic foot was defined as a main diagnosis in E10.5-E14.5; lower-limb amputation as a principal surgical procedure code for toe, transmetatarsal, ankle, leg, knee, thigh or hip amputation. Source: Elaborated from the DEIS hospital discharge microdata (open mirror, Universidad de Chile repository) and World Bank population estimates.
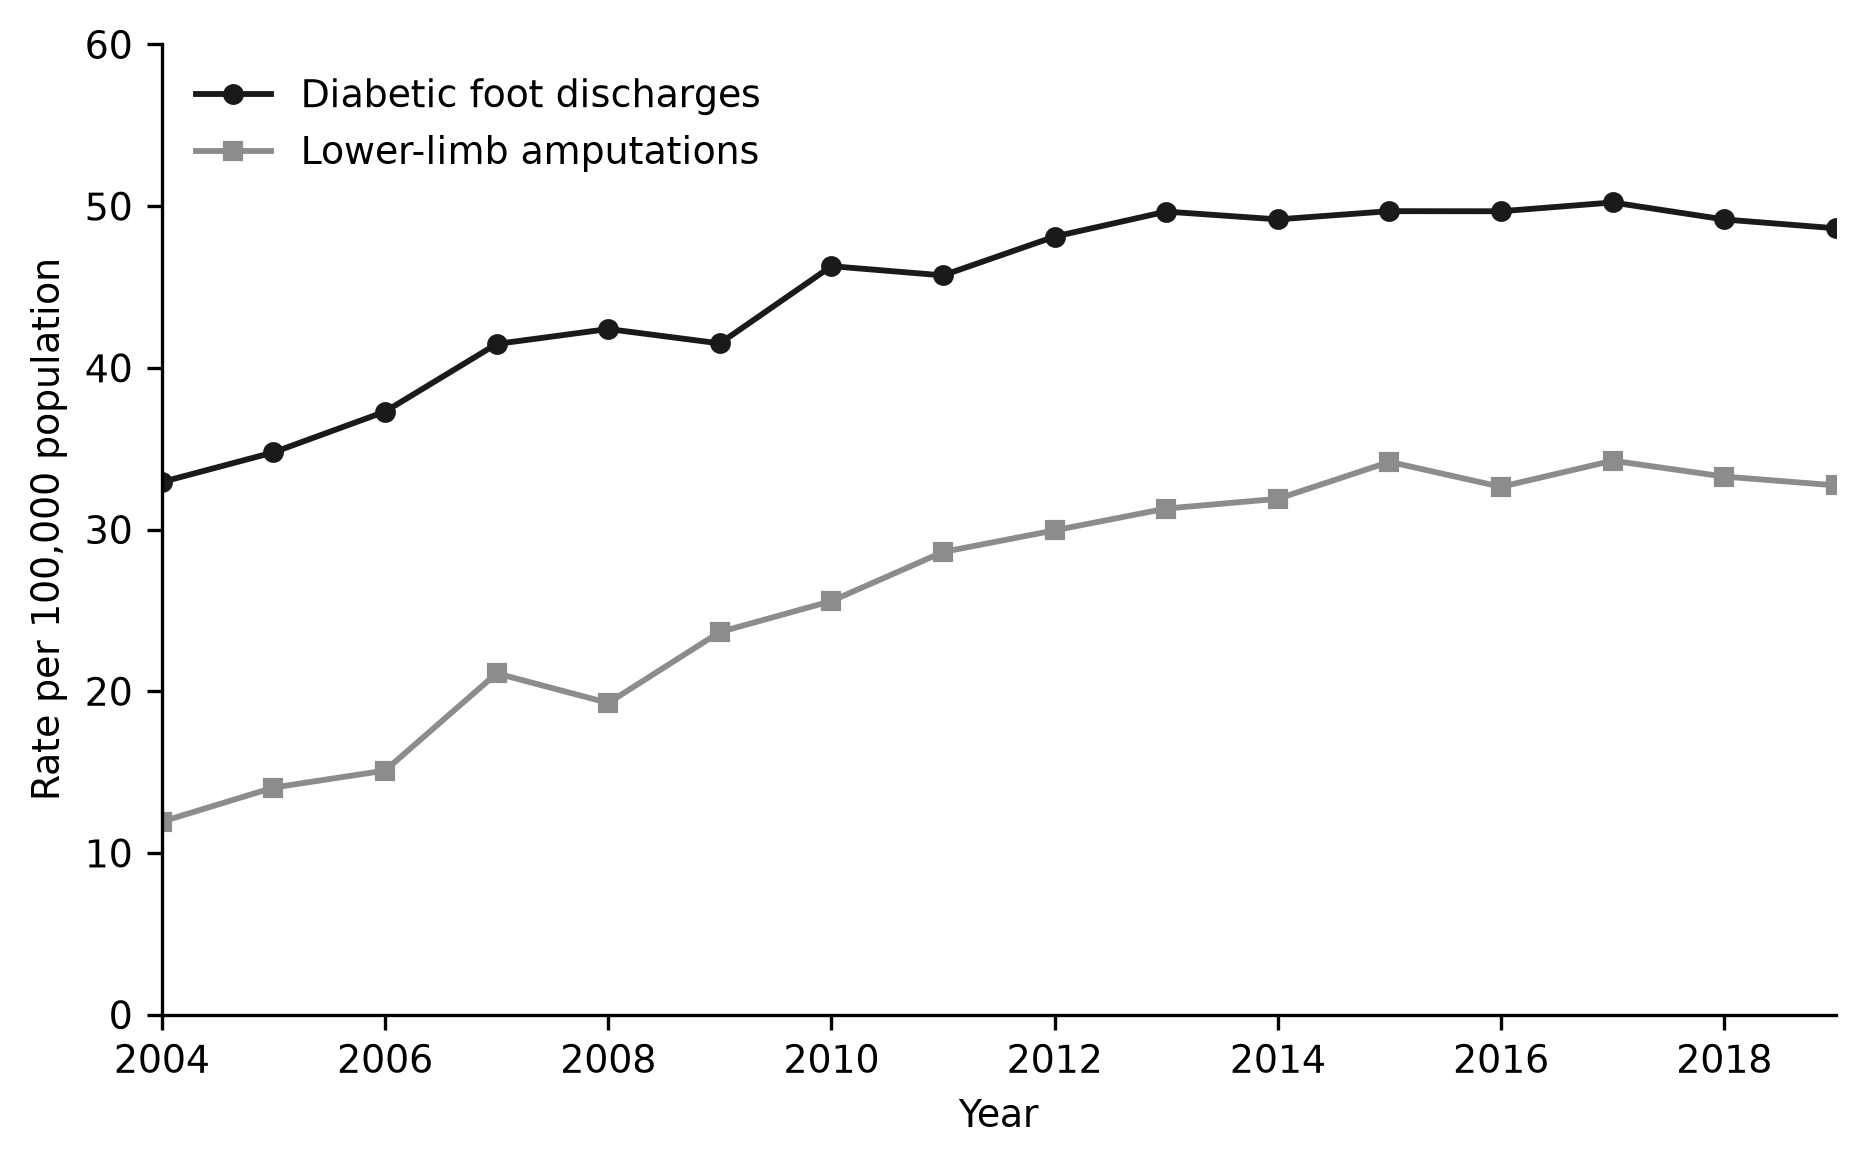
Figure 1. Annual rates of diabetic foot discharges and lower-limb amputations per 100,000 inhabitants, Chile, 2004-2019.
Note: Diabetic foot was defined as a main diagnosis in E10.5-E14.5; lower-limb amputation as a principal surgical procedure code from toe to hip. Source: Elaborated from the DEIS hospital discharge microdata and World Bank population estimates.Component 2. Demographic component
The demographic component describes how the burden distributes by sex and age. Men contributed more than seven of every ten discharges in both outcomes, with 89,862 diabetic foot discharges against 36,307 in women and 53,565 amputations against 20,848 in women. Sex-specific rates reached 64.5 per 100,000 in men and 25.8 in women for diabetic foot, and 38.4 against 14.8 for amputation, a male-to-female ratio of 2.6. The median age was 65 years for diabetic foot discharges and 66 for amputations, with interquartile ranges of 57 to 73 and 58 to 75. Persons aged 45 to 64 years formed the largest single age band, contributing 56,345 diabetic foot discharges, and the youngest band, younger than 45 years, contributed 6,610 discharges, the smallest share. A total of 50.9% of diabetic foot discharges and 55.7% of amputations occurred at 65 years or older. The rate in persons aged 65 years or older reached 218.0 per 100,000 for diabetic foot against 32.3 in persons aged 15 to 64, and the same gap held for amputations, with 140.7 against 16.9. Among older adults the male diabetic foot rate of 340.01 more than doubled the female rate of 119.96, and the male amputation rate of 221.55 nearly tripled the female rate of 75.83. The distribution is shown in (Table 2).
group | df_n | df_pct | amp_n | amp_pct |
|---|---|---|---|---|
Men | 89862 | 71.2 | 53565 | 72.0 |
Women | 36307 | 28.8 | 20848 | 28.0 |
<45 | 6610 | 5.2 | 5026 | 6.8 |
45-64 | 56345 | 44.7 | 28440 | 38.2 |
65-74 | 38928 | 30.9 | 22233 | 29.9 |
75+ | 25274 | 20.0 | 19219 | 25.8 |
Note: Shares are percentages of the national total for each outcome. Sex-specific and age-specific rates per 100,000 inhabitants are reported in the text. Source: Elaborated from the DEIS hospital discharge microdata (open mirror, Universidad de Chile repository).
Component 3. Geographic component
The geographic component maps the regional distribution of the burden and the gradient across regions of residence. The Metropolitana region concentrated 32.1% of diabetic foot discharges and 40.0% of amputations, followed by Valparaiso and Biobio, a ranking that mirrors population size. The center-south regions together contributed roughly half of all diabetic foot discharges. The internal rate per 10,000 hospital discharges exposed a different ordering, because the highest values fell in Nuble and Los Rios rather than in the capital, while the Metropolitana region at 41.1 per 10,000 discharges sat below the rate of several center-south regions and the extreme south held the lowest values. The gradient was widest for diabetic foot, whose internal rate reached its highest value in Nuble and Los Rios and its lowest in the extreme south, while the amputation internal rate was highest in Maule and lowest in the extreme south, with the capital at 30.3 per 10,000 discharges. The regional distribution is shown in (Table 3) and the internal rate gradient in (Figure 2).
region | name | df_n | df_pct | df_per10k | amp_n | amp_pct | amp_per10k |
|---|---|---|---|---|---|---|---|
13 | Metropolitana | 40440 | 32.1 | 41.1 | 29799 | 40.0 | 30.3 |
05 | Valparaíso | 16362 | 13.0 | 56.6 | 8556 | 11.5 | 29.6 |
08 | Biobío | 14385 | 11.4 | 52.0 | 7369 | 9.9 | 26.6 |
09 | Araucanía | 9125 | 7.2 | 55.1 | 2574 | 3.5 | 15.5 |
07 | Maule | 7316 | 5.8 | 51.0 | 5592 | 7.5 | 39.0 |
10 | Los Lagos | 6529 | 5.2 | 49.9 | 2771 | 3.7 | 21.2 |
06 | O'Higgins | 6024 | 4.8 | 49.5 | 4145 | 5.6 | 34.1 |
14 | Los Ríos | 5634 | 4.5 | 71.4 | 2672 | 3.6 | 33.9 |
16 | Ñuble | 5504 | 4.4 | 74.3 | 2513 | 3.4 | 33.9 |
04 | Coquimbo | 4341 | 3.4 | 48.8 | 2801 | 3.8 | 31.5 |
02 | Antofagasta | 3486 | 2.8 | 34.7 | 1858 | 2.5 | 18.5 |
03 | Atacama | 1967 | 1.6 | 46.5 | 1160 | 1.6 | 27.4 |
15 | Arica y Parinacota | 1641 | 1.3 | 51.4 | 653 | 0.9 | 20.4 |
01 | Tarapacá | 1615 | 1.3 | 38.7 | 1005 | 1.4 | 24.1 |
12 | Magallanes | 947 | 0.8 | 26.4 | 512 | 0.7 | 14.3 |
11 | Aysén | 588 | 0.5 | 30.4 | 275 | 0.4 | 14.2 |
99 | Unknown | 265 | 0.2 | 27.3 | 159 | 0.2 | 16.4 |
Note: Counts aggregated over the 16-year period. Share is the percentage of the national total. Discharges per 10,000 is the internal rate computed with the region's total hospital discharges as denominator. Region codes follow the 16-region structure released by DEIS; one annual file (2012) shows a coding shift between regions 09 and 14 that was retained as released. Source: Elaborated from the DEIS hospital discharge microdata (open mirror, Universidad de Chile repository).
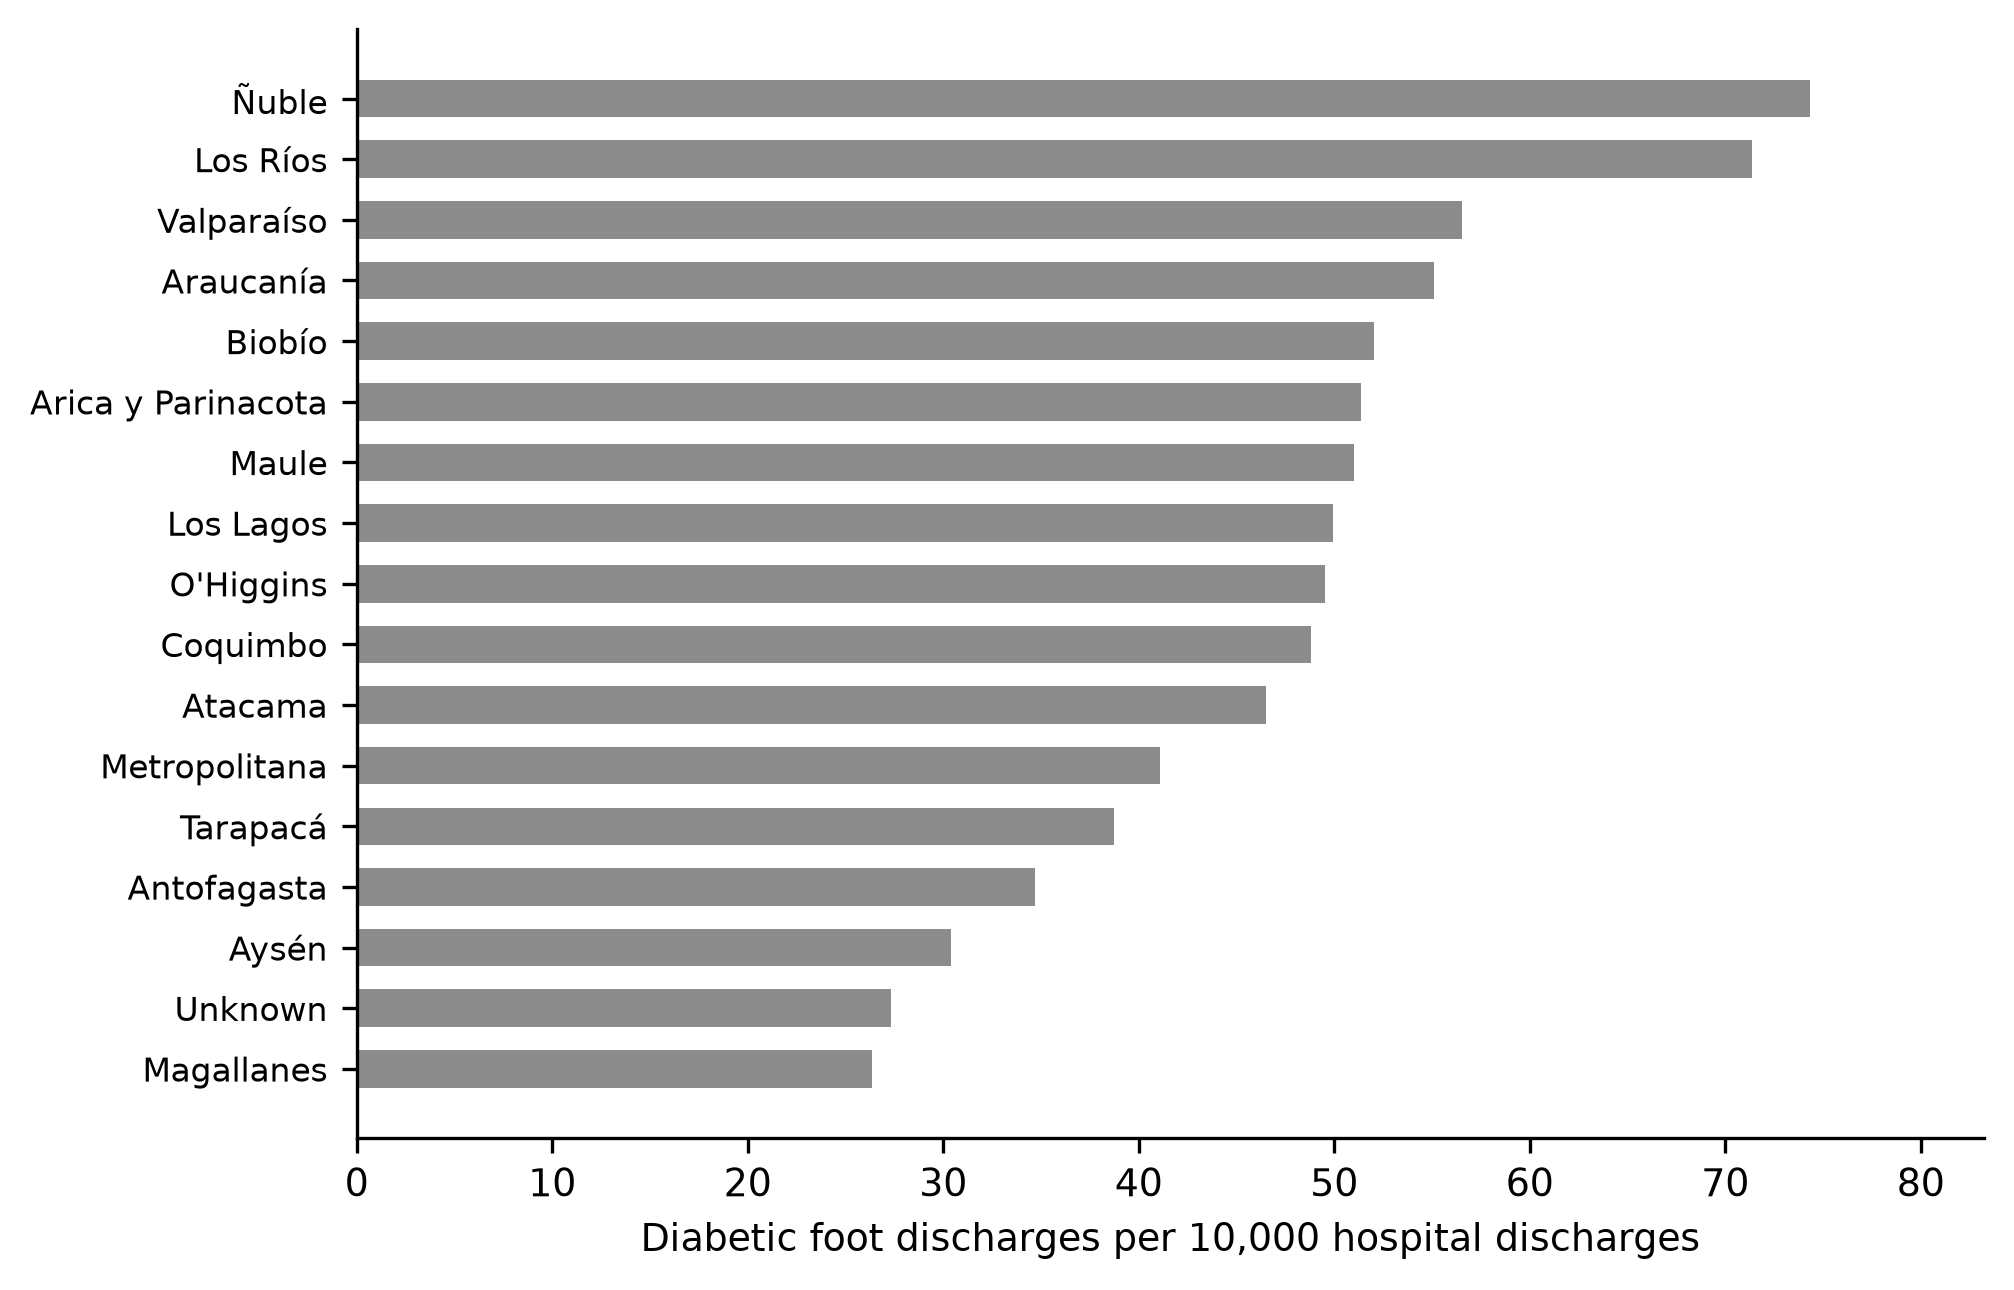
Figure 2. Diabetic foot discharges per 10,000 hospital discharges by region of residence, Chile, 2004-2019.
Note: The internal rate uses the region's total hospital discharges as denominator and does not require external population estimates. Source: Elaborated from the DEIS hospital discharge microdata (open mirror, Universidad de Chile repository).Component 4. Clinical severity component
The clinical severity component captures amputation level, in-hospital mortality and length of stay. Minor amputations represented 63.9% of all lower-limb amputations, with 47,558 procedures, and major amputations 36.1%, with 26,856 procedures. In-hospital mortality was 1.7% for diabetic foot discharges and 3.8% for amputations overall, but the level of amputation divided the risk, because mortality reached 8.0% after major amputations against 1.5% after minor ones. Diabetes-related amputations showed 1.7% mortality, and 64.5% of all amputations carried a diabetes diagnosis. Median length of stay was 10 days for diabetic foot discharges and 11 days for amputations, with a quarter of amputations exceeding 22 days and a quarter of diabetic foot discharges exceeding 20 days. The severity measures are shown in (Table 4).
case | n | mortality_pct | los_med | los_q1 | los_q3 |
|---|---|---|---|---|---|
Diabetic foot discharge | 126169 | 1.7 | 10.0 | 5.0 | 20.0 |
Lower-limb amputation, minor | 47558 | 1.5 | |||
Lower-limb amputation, major | 26856 | 8.0 | |||
Diabetes-related amputation | 47999 | 1.7 | 11.0 | 5.0 | 22.0 |
Note: Length of stay is the median (P25-P75) in days. In-hospital mortality is the percentage of discharges with deceased condition at discharge. Source: Elaborated from the DEIS hospital discharge microdata (open mirror, Universidad de Chile repository).
The four components integrate into one framework. This component structure links a temporal component in which amputation grows faster than diabetic foot to a demographic component that locates the excess in men and older adults, a geographic component that exposes a regional gradient, and a clinical component that quantifies the lethal end of the pathway (Figure 3). Each component was defined operationally in the discharge data, and each rests on the same 16-year national series, so the components are mutually comparable rather than parallel descriptions.
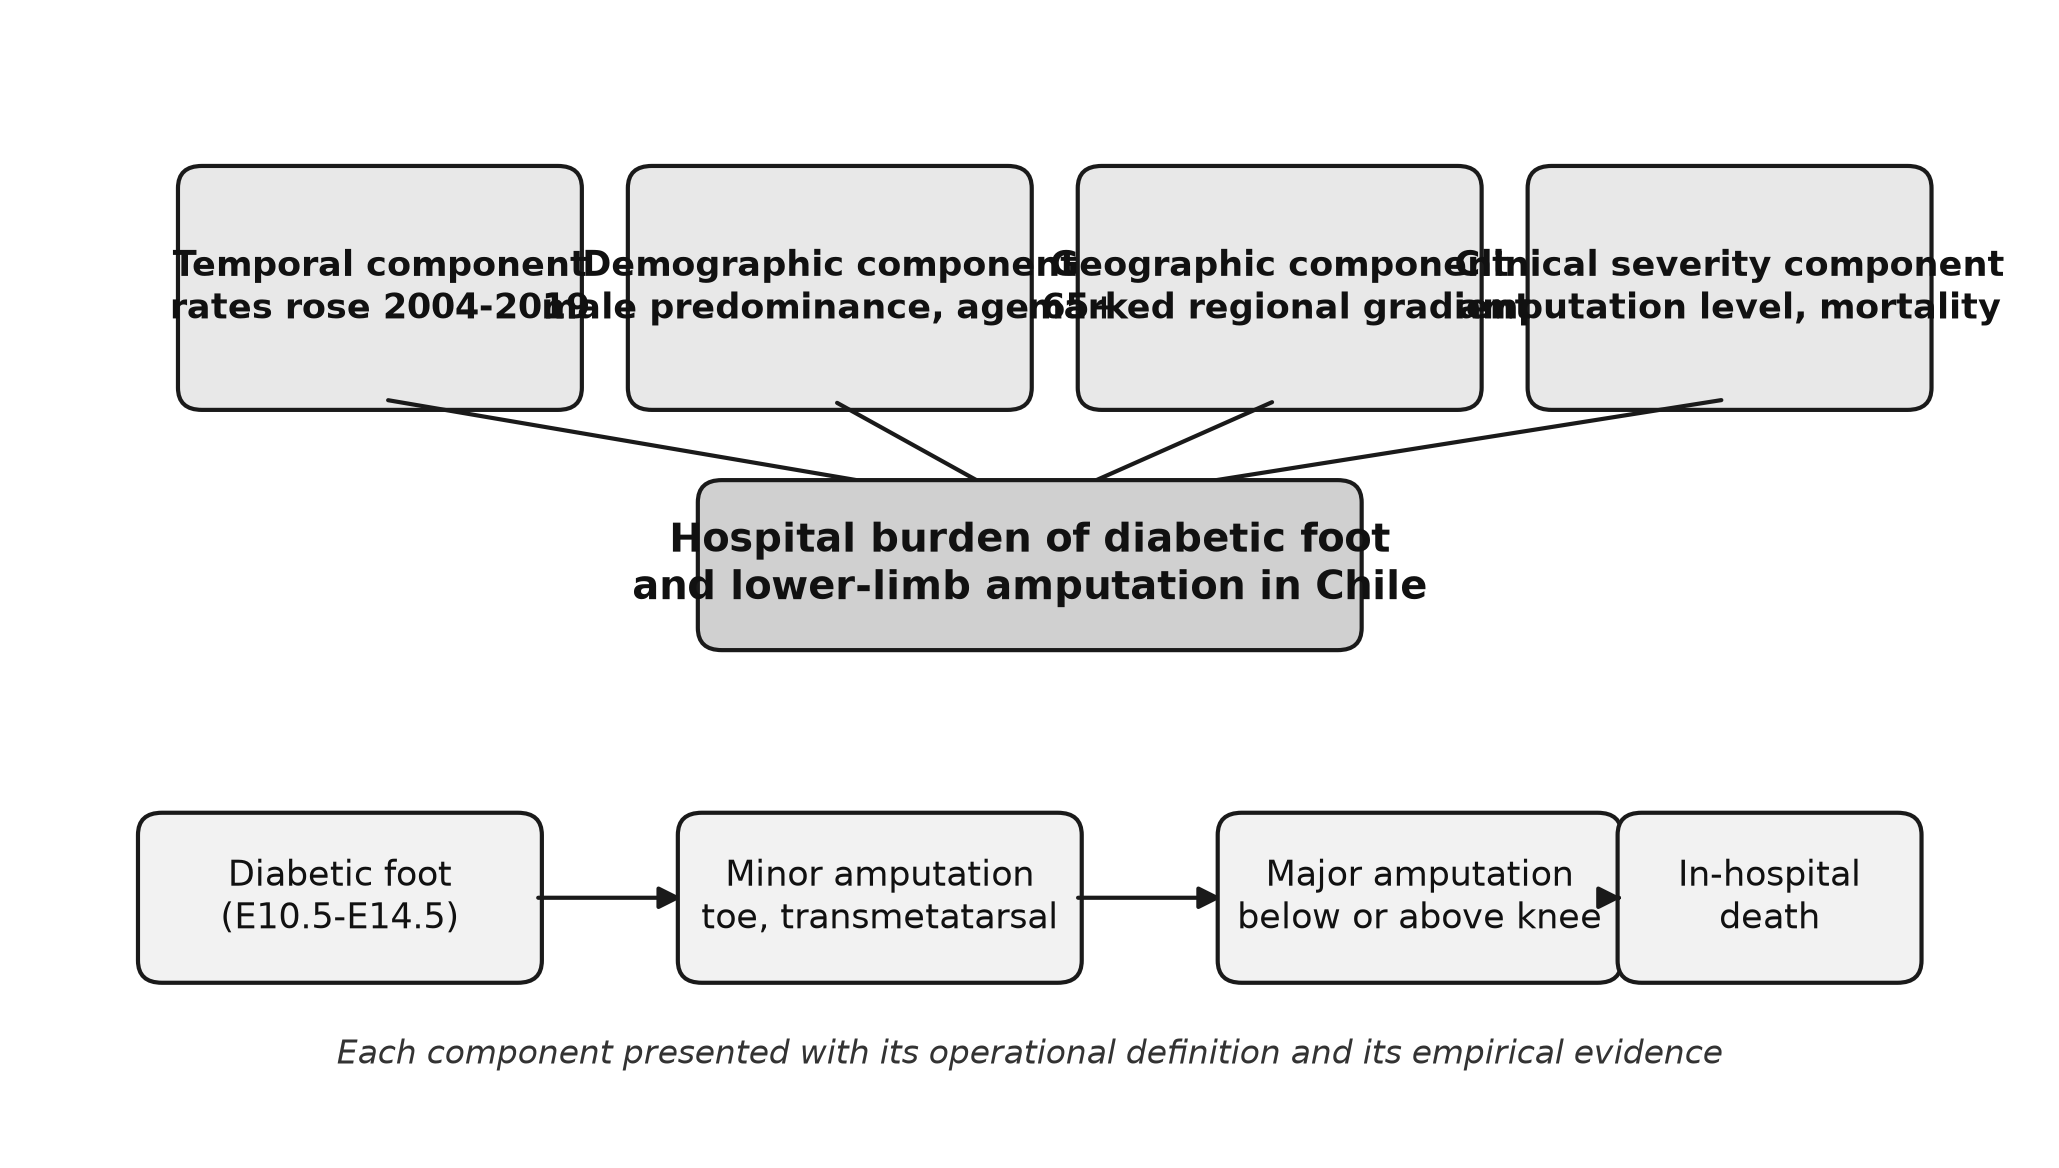
Figure 3. Conceptual framework of the hospital burden of diabetic foot and lower-limb amputation in Chile.
Note: Each component was defined operationally and supported with empirical evidence from the DEIS discharge microdata, 2004-2019. Source: Elaborated from the findings of this study.DISCUSSION
This study set out to quantify the hospital burden of diabetic foot and lower-limb amputation in Chile and to integrate its temporal, demographic, geographic and clinical components into one framework. The findings show that both burdens grew continuously between 2004 and 2019, that amputations grew considerably faster than diabetic foot discharges, and that the burden concentrated in men, in persons aged 65 years or older, and in the center-south regions, with major amputations carrying the highest in-hospital mortality.
The temporal component is the least expected finding and the one that most needs explanation. Amputation rates rose more than the diabetic foot rate across the period, which inverts the pattern reported by Reilly et al.,( 19) who found declining lower-extremity amputation rates secondary to diabetes in the United States population, and by Moxey et al.,( 6) who documented substantial declines in several high-income countries. The divergence is unlikely to reflect coding drift alone, because the diabetic foot series rose smoothly while the amputation series rose steeply, and because the two series are measured in the same administrative system. Part of the growth may reflect genuine expansion of diabetes prevalence in Chile documented over the same window(2) together with an aging population, which increases the denominator of feet at risk, and part may reflect the accumulation of long-term healthcare and sociodemographic risk factors that precede amputation.(20) The rising amputation volume parallels the global increase in diabetes-related mortality and disability between 1990 and 2021 reported by Li et al..(21) The faster rise of diabetes-related amputations suggests that a larger share of the growing amputation volume now arrives with a diabetes diagnosis, consistent with the Chilean finding that the diabetic foot amputation index is sensitive to metabolic control.(10) The stabilization of both rates after 2014 is itself informative. It may reflect saturation of the coding practice once the tariff and the electronic discharge form were consolidated, or a genuine slowing of the underlying incidence, and the two explanations cannot be separated with discharge data alone. What matters for surveillance is that the plateau arrived after a decade of continuous growth, leaving the country with an amputation rate roughly three times the level of 2004, so the gains of the last years are a leveling of a high burden rather than a return to the baseline.
The demographic component places the burden in men and in older adults, and this structure is consistent across studies. Men contributed more than seven of every ten discharges in both outcomes, a male predominance close to the sex differences reported for non-traumatic lower-limb amputations by Kaser et al.(22) and for diabetic amputations in Mexican American elders by Otiniano et al..(23) The explanation is multifactorial rather than hormonal alone, because men in Chile reach amputation with more advanced peripheral arterial disease, later presentation and higher tobacco exposure.(22,24) The concentration of half the burden at 65 years or older matches the age profile of first diabetic foot ulcers in the CODIA cohort(25) and of incident ulcer progression to amputation in the Seattle Diabetic Foot Study,(26) and it implies that age-adjusted denominators, rather than crude counts, should guide resource allocation. The interaction of sex and age is the practical message of this component: the highest rates belong to men aged 65 years or older, a group small enough to be reached by targeted screening but large enough to explain most of the amputations. This profile is consistent with the biological and behavioral pathway reviewed by Armstrong et al.,( 4) in which neuropathy, ischemia and infection accumulate over years of diabetes duration before an ulcer first appears.
The geographic component reveals two superimposed patterns. The Metropolitana region accumulates the largest absolute number because it holds the largest population, yet its internal rate sits below that of several center-south regions, with Nuble and Los Rios at the top of the gradient. This ordering resembles the socioeconomic geography of diabetes in Chile reported by Ortiz et al.( 3) and the regional inequities in colorectal cancer described by Mondschein et al.( 12) from the same discharge system. It also echoes regional disparities in stroke care from national Chilean hospital data.(13) Put differently, the diabetic foot and amputation gradient tracks regions where diabetes prevalence, rurality and delayed access to specialized foot care overlap, and it is exactly this overlap that regional foot care initiatives in Latin America seek to correct.(14,15) The capital region illustrates why absolute counts and internal rates must be read together: the Metropolitana region concentrates the largest number of cases and therefore the largest absolute demand for beds, while the center-south regions face the highest burden relative to their hospital volume and therefore the greatest relative strain. This dual reading is a direct consequence of the framework structure, in which each component answers a different management question.
The magnitude of the burden also places Chile within a broader Latin American and global pattern. The prevalence of diabetic foot in the Brazilian state of Espirito Santo, estimated by Jose Teixeira Costa et al.,( 27) and the systematic review of diabetic foot ulcer prevalence in India by Sahu et al.( 28) both confirm that foot complications concentrate in patients with long-standing diabetes and poor metabolic control, the same profile implied by the age and sex structure observed here. The comparison matters because it shows that the Chilean figures are not an outlier of severity but an expression of a regional problem that is measurable and, in principle, preventable with organized foot care.
The clinical severity component is the most consequential for patients. Major amputations carried eight times the in-hospital mortality of minor amputations, a gradient consistent with the five-year mortality reported after major lower-limb amputation by Zakriya et al.(29) and with the predictors of death and major amputation in infected diabetic foot ulcers described by Ben Zvi et al..(30) The association of major amputation with chronic kidney disease reported by Beaumont et al.(31) matches the severity structure here, in which major procedures concentrate the deaths. The overall mortality of diabetic foot discharges was lower than the mortality reported for amputation cohorts, which reflects the inclusion of less severe ulcer admissions and the survival advantage of minor procedures, as shown for the transition from minor to major amputation by Wadhawan et al..(32) The severity structure argues for limb-preservation programs, whose effect on amputation outcomes Lew et al.(33) quantified, and for the preventive and infection standards consolidated in the IWGDF guidelines.(34-36)
The predominance of minor amputations also has a specific reading. Toe and transmetatarsal procedures outnumbered major ones almost two to one, which is the inverse of the pattern seen in settings where patients present late with irreversible ischemia and proceed directly to a major amputation. A minor amputation that preserves the foot is a limb-salvage outcome, not a failure, provided that the minor procedure does not convert into a major one, a transition whose risk Wadhawan et al.( 32) quantified. The mortality difference between minor and major procedures observed here, eightfold in relative terms, is therefore the clinical argument for keeping the ratio skewed toward minor procedures and for tracking conversion to major amputation as a quality indicator.
Several mechanisms connect these components. Neuropathy, ischemia and infection jointly drive the ulcer that precedes amputation,(7) and each is modifiable through glycemic control, revascularization and early debridement.(8) The excess male burden reflects both biological susceptibility to peripheral arterial disease and behavioral delay, and the regional gradient reflects the social determinants of diabetes described for lower-extremity amputations by Humphries et al.(37) and by Schmittling et al..(38) Within this framework, the temporal component is the summary outcome of the other three, because demographic aging, male predominance and regional access deficits together determine how fast the amputation burden grows.(5)
The contribution of this study over the existing Chilean literature is therefore one of integration rather than novelty of any single number. Previous work quantified the diabetic foot amputation index and its metabolic correlates,( 10) evaluated multidisciplinary foot management,(11) and profiled hospital discharges in the same national system.( 39) This analysis connects those pieces into one framework in which each component is defined operationally, measured in the same data, and related to the others, so that a change in one component can be read against the rest. That is the difference between a collection of descriptive findings and a model that supports surveillance and planning.
The strengths of this study rest on the completeness and coverage of the data. The records include every hospital discharge in Chile over 16 years, which removes sampling error and selection bias, and the case definitions follow the coding conventions used in the national tariff and in previous Chilean studies of the same system.(12,39) The sensitivity analysis that widened the diabetic foot definition did not change the direction or the shape of the temporal trend, which supports the robustness of the main findings to the coding choice. Limitations are integrated with their remedies. First, the discharge data carry only a main diagnosis, so the diabetic foot definition relies on E10.5-E14.5 and cannot capture ulcers coded as secondary diagnoses, which may undercount milder admissions; linking diagnoses within an episode would resolve this. Second, procedure codes identify only the principal surgical procedure, so a simultaneous amputation listed as secondary would be missed, although amputation is almost always the principal procedure when performed. Third, the 2012 regional coding shift introduces measurement error in two regions, retained as released and diluted by the 16-year aggregation; using commune-level data would correct it. Fourth, population denominators by fine age band were not available as an open source, so age-specific rates were limited to broad groups; future analyses should link regional demographic projections. Fifth, no individual clinical data on ulcer severity or revascularization were available, so the clinical component remains descriptive and cannot separate the effect of care from that of case mix.
The implications for practice follow the framework. The temporal component supports surveillance of the amputation rate as a sentinel indicator of diabetic foot care, the demographic component directs screening and podiatric review toward men and older adults, the geographic component targets regional foot teams where the internal rate is highest, and the clinical component prioritizes the prevention of major amputations because they carry the mortality. Within this framework, each component is measurable in routine data and can be tracked after interventions.
The framework also has a monitoring use that extends beyond this study. Because the four components are computed from the same discharge fields that Chile already collects, the same calculation can be repeated annually to detect whether the amputation rate resumes its rise, whether the male and older-adult excess narrows, and whether the regional gradient flattens after services are reorganized. This converts a descriptive national snapshot into a reusable instrument, which is the practical value of a framework over a list of isolated statistics. The approach generalizes to any country that maintains a national discharge database with coded diagnoses and procedures, subject to the same caveats about coding completeness that apply here.( 16)
For podiatric practice the framework specifies where the profession adds value. The demographic component marks men and older adults as the population that should receive regular foot examination, offloading and footwear review, the interventions that the prevention guidelines place at the center of ulcer avoidance.(4,34) The clinical component shows that preserving the foot through minor procedures avoids the eightfold mortality associated with major amputation, which frames podiatric limb-salvage activity as a mortality-reducing intervention rather than a comfort measure. The geographic component, finally, argues for deploying podiatrists in the center-south regions where the internal rate is highest, a staffing decision that discharge data can inform directly.
CONCLUSIONS
In Chile, diabetic foot discharges and lower-limb amputations grew continuously between 2004 and 2019, the amputation burden rose faster than the diabetic foot burden, and diabetes-related amputations grew fastest of all, which identifies the amputation rate as the most sensitive indicator of the pathway.
The burden concentrated in men, in persons aged 65 years or older, and in the center-south regions, where the internal discharge rate exceeded that of the capital, and major amputations carried the highest in-hospital mortality, which identifies where and for whom prevention should act first. Together these temporal, demographic, geographic and clinical components form a single framework through which the hospital pathway from diabetic foot to amputation can be monitored, compared across time and regions, and re-evaluated after preventive and surgical interventions.
References
- 1 Sun H, Saeedi P, Karuranga S, Pinkepank M, Ogurtsova K, Duncan BB, et al. IDF Diabetes Atlas: Global, regional and country-level diabetes prevalence estimates for 2021 and projections for 2045. Diabetes Research and Clinical Practice. 2022;183:109119. doi: 10.1016/j.diabres.2021.109119
- 2 Zhou B, Rayner AW, Gregg EW, Sheffer KE, Carrillo-Larco RM, Bennett JE, et al. Worldwide trends in diabetes prevalence and treatment from 1990 to 2022: a pooled analysis of 1108 population-representative studies with 141 million participants. The Lancet. 2024;404(10467):2077-2093. doi: 10.1016/s0140-6736(24)02317-1
- 3 Ortiz MS, Cabieses B, Oyarte M, Repetto P. Disentangling socioeconomic inequalities of type 2 diabetes mellitus in Chile: A population-based analysis. PLoS ONE. 2020;15(9):e0238534. doi: 10.1371/journal.pone.0238534
- 4 Armstrong DG, Boulton AJM, Bus SA. Diabetic Foot Ulcers and Their Recurrence. N Engl J Med. 2017;376(24):2367-2375. doi: 10.1056/nejmra1615439
- 5 Boulton AJ, Vileikyte L, Ragnarson-Tennvall G, Apelqvist J. The global burden of diabetic foot disease. The Lancet. 2005;366(9498):1719-1724. doi: 10.1016/s0140-6736(05)67698-2
- 6 Moxey PW, Gogalniceanu P, Hinchliffe RJ, Loftus IM, Jones KJ, Thompson MM, et al. Lower extremity amputations - a review of global variability in incidence. Diabetic Medicine. 2011;28(10):1144-1153. doi: 10.1111/j.1464-5491.2011.03279.x
- 7 Prompers L, Huijberts M, Apelqvist J, Jude E, Piaggesi A, Bakker K, et al. High prevalence of ischaemia, infection and serious comorbidity in patients with diabetic foot disease in Europe. Baseline results from the Eurodiale study. Diabetologia. 2007;50(1):18-25. doi: 10.1007/s00125-006-0491-1
- 8 Singh N. Preventing Foot Ulcers in Patients With Diabetes. JAMA. 2005;293(2):217. doi: 10.1001/jama.293.2.217
- 9 Cavanagh P, Attinger C, Abbas Z, Bal A, Rojas N, Xu Z. Cost of treating diabetic foot ulcers in five different countries. Diabetes Metabolism Res. 2012;28(S1):107-111. doi: 10.1002/dmrr.2245
- 10 Kuschel F, Orellana I, Valdés M. Asociación entre el índice de amputación por pie diabético y los indicadores de atención y manejo de diabetes mellitus tipo 2 en los Centros de Salud del Servicio Metropolitano Oriente, entre 2014 y 2018. Rev méd Chile. 2022;150(7):912-918. doi: 10.4067/s0034-98872022000700912
- 11 Guzmán VM, Olivares Quiroga CA, Chinga Andreani AJ, Iribarren Brown OA. Impacto del manejo multidisciplinario del pie diabético. Rev Cir. 2023;75(3). doi: 10.35687/s2452-454920230031762
- 12 Mondschein S, Subiabre F, Yankovic N, Estay C, Von Mühlenbrock C, Berger Z. Colorectal cancer trends in Chile: A Latin-American country with marked socioeconomic inequities. PLoS ONE. 2022;17(11):e0271929. doi: 10.1371/journal.pone.0271929
- 13 Nuñez M, Allende MI, González F, Cavada G, Anderson CS, Muñoz Venturelli P. Sex Differences in Profile and In‐Hospital Death for Acute Stroke in Chile: Data From a Nationwide Hospital Registry. JAHA. 2024;13(15):e035152. doi: 10.1161/jaha.123.035152
- 14 Campillo-Vilorio N, Aragón-Sánchez J. Latin American initiatives to improve foot care in people with diabetes: the effort to reduce diabetes-related lower extremity amputations. Diabetes Research and Clinical Practice. 2025;226:112385. doi: 10.1016/j.diabres.2025.112385
- 15 Tacca-Quinteros PM, Tantaleán-Gutiérrez LV, Yovera-Aldana M. Capacidad pronóstica de los sistemas de clasificación de pie diabético para amputación de miembro inferior en América Latina y el Caribe: una revisión sistemática con metaanálisis. Acta Med Peru. 2024;41(3):167-82. doi: 10.35663/amp.2024.413.2925
- 16 Benchimol EI, Smeeth L, Guttmann A, Harron K, Moher D, Petersen I, et al. The REporting of studies Conducted using Observational Routinely-collected health Data (RECORD) Statement. PLoS Med. 2015;12(10):e1001885. doi: 10.1371/journal.pmed.1001885
- 17 Departamento de Estadisticas e Informacion de Salud, Ministerio de Salud de Chile; Repositorio de Datos de Investigacion de la Universidad de Chile. Egresos hospitalarios de Chile (microdatos DEIS), 2001-2019 [Internet]. 2022. Available from: https://doi.org/10.34691/FK2/WUQXZP
- 18 World Bank. World Development Indicators: population estimates for Chile [Internet]. 2025. Available from: https://data.worldbank.org/indicator/SP.POP.TOTL
- 19 Reilly MA, Cohen IC, Watson SL, Minc SD, Ho KJ, Feinglass J. A population health analysis of trends in lower extremity amputation secondary to diabetes and peripheral artery disease, 2016–2023. Diabetes Research and Clinical Practice. 2025;230:112963. doi: 10.1016/j.diabres.2025.112963
- 20 Jensen PS, Kallemose T, Kirketerp-Møller K, Juul-Larsen HG. Identifying long-term healthcare and sociodemographic risk factors for lower extremity amputation: a 10-year national registry-based case–control study in Denmark. BMJ Open. 2025;15(12):e112203. doi: 10.1136/bmjopen-2025-112203
- 21 Li Z, Hou Y, Wang D, Ma Y, Guo Y, Xu Y. Trends and Disparities in the Impact of Diabetes Mellitus Mortality and Disability, 1990–2021: A Systematic Analysis of the 2021 Global Burden of Disease Study. The American Journal of Tropical Medicine and Hygiene. 2025;113(6):1430-1441. doi: 10.4269/ajtmh.25-0335
- 22 Kaser S, Radlinger B, Blasinger J, Koellenberger N, Streitberger V, Kopp L, et al. Non-Traumatic Lower-Limb Amputations: Outcome, Sex-Differences, Comorbidity Patterns and Temporal Trends from 2006 to 2022. JCM. 2025;14(12):4030. doi: 10.3390/jcm14124030
- 23 Otiniano ME, Du X, Ottenbacher K, Black SA, Markides KS. Lower extremity amputations in diabetic Mexican American elders. Journal of Diabetes and its Complications. 2003;17(2):59-65. doi: 10.1016/s1056-8727(02)00175-7
- 24 Hashmi M, Shiraliyeva N, Herrera A, Tabassum H, Schechter C, Daily JP, et al. Who's really footing the bill? Sex and ethnicity disparities in the cost of diabetic foot ulcer-related amputations in a major healthcare system. The Journal of Foot and Ankle Surgery. 2025;64(4):441-445. doi: 10.1053/j.jfas.2025.01.017
- 25 Julla JB, Jolivet T, Estellat C, Varoquaux G, Carlier A, Gautier JF, et al. Incidence of death and amputation in patients with a first diabetic foot ulcer: results from the CODIA cohort. Diabetes & Metabolism. 2025;51(6):101700. doi: 10.1016/j.diabet.2025.101700
- 26 Al‐Busaidi IS, Seelig AD, Boyko EJ. Association of Incident Diabetic Foot Ulcer With Lower‐Extremity Amputation Risk: The Prospective Seattle Diabetic Foot Study. Diabetes Metabolism Res. 2025;41(8):e70102. doi: 10.1002/dmrr.70102
- 27 Jose Teixeira Costa W, Pedrozo Campos Antunes T, Carlos de Abreu L, Lucas Souza Ramos J, Mende de Castro J, Batista Francalino da Rocha J, et al. Prevalência de pé diabético e seus fatores de risco no Estado do Espirito Santo, Brasil. jhgd. 2023;33(1):33-43. doi: 10.36311/jhgd.v33.14295
- 28 Sahu SS, Chaudhary V, Sharma N, Kumari S, Pal B, Khurana N. Prevalence and risk factors associated with diabetic foot ulcer in India: a systematic review and meta-analysis. Int J Diabetes Dev Ctries. 2025;45(3):516-527. doi: 10.1007/s13410-024-01400-x
- 29 Zakriya M, Rehman ZU, Anees M, Shaikh H, Memon AQ, Siddiqui NA, et al. Predictors of 30-day mortality in major lower limb amputations: insights from a five-year retrospective study in a South Asian LMIC. BMC Surg. 2025;25(1):300. doi: 10.1186/s12893-025-03013-5
- 30 Ben Zvi L, Maman D, Margulis M, Berkovich Y. Predictors of Major Amputation and Mortality in Infected Diabetic Foot Ulcers: A Retrospective Nationwide Inpatient Sample Study. IJERPH. 2025;22(9):1387. doi: 10.3390/ijerph22091387
- 31 Beaumont M, Hobson K, Rax H, Sutton A, Hill A, Lindström D, et al. Mortality and Major Amputation in Patients With Diabetes‐Related Foot Ulcers and Chronic Renal Disease. ANZ Journal of Surgery. 2025;95(10):2039-2045. doi: 10.1111/ans.70194
- 32 Wadhawan N, Shibuya N, Jupiter DC. The impact of minor amputation on occurrence of major amputation in patients with diabetic foot ulcers. The Journal of Foot and Ankle Surgery. 2025;64(6):729-732. doi: 10.1053/j.jfas.2025.05.013
- 33 Lew E, Collins NP, Marek J, Schenck RC, Richter D, Gallegos R, et al. The Impact of Implementing a Diabetic Limb-Preservation Program on Amputation Outcomes at an Academic Institution in a Majority-Minority State. The International Journal of Lower Extremity Wounds. 2025;24(4):1179-1187. doi: 10.1177/15347346231169879
- 34 Schaper NC, van Netten JJ, Apelqvist J, Bus SA, Fitridge R, Game F, et al. Practical guidelines on the prevention and management of diabetes‐related foot disease (IWGDF 2023 update). Diabetes Metabolism Res. 2024;40(3):e3657. doi: 10.1002/dmrr.3657
- 35 Bus SA, Sacco ICN, Monteiro‐Soares M, Raspovic A, Paton J, Rasmussen A, et al. Guidelines on the prevention of foot ulcers in persons with diabetes (IWGDF 2023 update). Diabetes Metabolism Res. 2024;40(3):e3651. doi: 10.1002/dmrr.3651
- 36 Senneville É, Albalawi Z, van Asten SA, Abbas ZG, Allison G, Aragón‐Sánchez J, et al. IWGDF/IDSA guidelines on the diagnosis and treatment of diabetes‐related foot infections (IWGDF/IDSA 2023). Diabetes Metabolism Res. 2024;40(3):e3687. doi: 10.1002/dmrr.3687
- 37 Humphries MD. Social and Structural Determinants of Lower Extremity Amputations in Diabetes. Curr Diab Rep. 2025;25(1):40. doi: 10.1007/s11892-025-01598-y
- 38 Schmittling KA. Risk assessment modeling for diabetes-related lower extremity amputation using socioeconomic and behavioral health indicators. Journal of Diabetes and its Complications. 2025;39(10):109153. doi: 10.1016/j.jdiacomp.2025.109153
- 39 Hernández Vilches J, Ramírez-Santana M. Comparing the profile of hospital discharges between nationals and international migrants: a decade of contrasts and health challenges for Chile (2013 to 2022). Medwave. 2025;25(08):e3086-e3086. doi: 10.5867/medwave.2025.08.3086
Declarations
Funding
No financing
Conflict of interest
None
Authorship contributions
Drafting – original draft: Andrea Gabriela Rea Fernández, Eduardo J Rodríguez López.
Writing–review and editing: Andrea Gabriela Rea Fernández, Eduardo J Rodríguez López.