

Abstract
Introduction: Periodic foot examination prevents diabetic foot ulcers and amputations, yet its population coverage and socioeconomic distribution in Brazil are poorly documented. Methods: Cross-sectional analysis of the 2013 and 2019 Brazilian National Health Survey. Adults aged 18 years or older with self-reported diabetes were included. Coverage of foot examination by a health professional was estimated with design-based methods and inequalities were quantified by income, race/color, region and health service use. Survey-weighted Poisson regression estimated adjusted prevalence ratios. Results: Overall coverage of ever having the feet examined reached 46.8% (95% CI 45.13-48.52). Coverage differed by income quintile, race/color, region and health service use, and the absolute difference between the richest and poorest quintiles was 19.9 percentage points in 2019. Conclusions: Foot examination coverage among Brazilian adults with diabetes is incomplete and unequal, with lower coverage concentrated in socioeconomically disadvantaged groups.
Keywords
diabetes mellitus, diabetic foot, physical examination, healthcare disparities, Brazil, health surveys
INTRODUCTION
Diabetes mellitus is one of the most prevalent chronic conditions in Brazil and its burden has grown steadily over the past decade. The prevalence of self-reported diabetes among Brazilian adults reached 7.7% in the 2019 National Health Survey, up from 6.2% in 2013, which corresponds to millions of newly identified cases over six years.(1,2) The condition drives a substantial share of the national morbidity from noncommunicable diseases, and its vascular and neurologic complications do not distribute evenly across the population: they concentrate among adults with lower income, less schooling and poorer access to health care.(3-5) Diabetes also interacts with the country's marked socioeconomic and regional inequalities, so that the risk of complications is highest precisely in the populations with the least capacity to pay for private care. This unequal distribution means that the groups that carry the highest clinical risk are precisely those with the fewest resources to obtain preventive care.
Diabetic foot disease is among the most disabling and costly complications of diabetes. Foot ulcers precede the majority of lower limb amputations, and their prevention depends on the systematic identification of people at risk through clinical examination of the feet.(6,7) Peripheral neuropathy and lower limb amputations impose a heavy functional and economic burden on people with diabetes and on the health system, and in Brazil the direct medical costs of diabetic foot disease reach hundreds of millions of dollars per year, concentrated in hospitalizations and amputations.(8,9) International guidance recommends that every person with diabetes undergo a foot examination at least once a year, with more frequent review for those at higher risk.(7) The pattern expected in this analysis is one of incomplete coverage and a socioeconomic gradient, in which disadvantaged groups report lower examination rates despite a higher burden of foot complications.(10) Periodic examination is also a monitored indicator of the Brazilian strategic plans for chronic noncommunicable diseases, which makes its population measurement relevant for policy.(11)
National data on the coverage of foot examination in Brazil are recent and remain limited to single waves or to single dimensions of inequality. A 2019 analysis reported that more than half of Brazilian adults with diabetes had never had their feet examined, with marked differences by race/color.(12) Studies using the same survey have documented inequalities in diabetes care along income and education lines and have described the cascade from diagnosis to treatment, but they have not isolated foot examination across the main axes of inequality or compared the 2013 and 2019 waves.(13-15) Quantifying coverage and its social distribution across the two waves matters because it identifies whether the expansion of primary care in the period was accompanied by better preventive foot care and which groups remain underserved. The objective of this study was to estimate the coverage of foot examination among Brazilian adults with diabetes in 2013 and 2019 and to quantify inequalities by income, race/color, region and health service use.
METHODS
Design and data source
This was a cross-sectional secondary analysis of the two most recent waves of the Brazilian National Health Survey (Pesquisa Nacional de Saúde, PNS), a nationally representative household survey conducted by the Brazilian Institute of Geography and Statistics (IBGE) in 2013 and 2019. The PNS was designed to produce estimates for Brazil, its macroregions and states and to monitor the health of the adult population through a standardized household questionnaire applied to one selected resident aged 15 years or older per household. Public anonymized microdata were downloaded without login from the IBGE file server at https://ftp.ibge.gov.br/PNS/, using the fixed-width files and variable dictionaries published with each wave. The two editions use stratified multi-stage cluster sampling with comparable but not identical designs, and the post-stratification weights of each edition are not directly interchangeable, as described in the methodological comparison of the two surveys.(16) The study follows the STROBE recommendations for the reporting of cross-sectional observational studies.
Study population
Adults aged 18 years or older with self-reported diabetes were included. Diabetes was defined by an affirmative answer to the question on a previous medical diagnosis of diabetes, and women who reported diabetes only during pregnancy were excluded. In the 2013 questionnaire gestational diabetes was captured as a separate response category, and in 2019 as a follow-up question; both were treated identically for the exclusion. The analytical sample combined both survey waves; each observation carried the survey weight, stratum and primary sampling unit identifiers of its own wave, so that the pooled analysis remained design consistent and each wave contributed its own design information.
Outcome
The primary outcome was lifetime coverage of foot examination by a health professional. It was defined from the question on when a physician or other health professional last examined the respondent's feet to check sensation or the presence of wounds or irritations, which in both waves offers six response categories ranging from less than six months to three years or more and a final category of never having had the feet examined. Categories from less than six months to three years or more were combined as ever examined, against never having had the feet examined; ignored or non-applicable responses were treated as missing and excluded from the denominator. This lifetime definition captures any contact with a professional examination of the feet, independently of the recommended annual periodicity, and therefore measures the basic coverage of the preventive service. A secondary outcome was foot examination within the last twelve months, combining the two most recent categories and reflecting adherence to the recommended annual periodicity.
Exposures and covariates
Inequality dimensions were per capita household income, self-reported race/color, geographic region of residence and health service use. Income was categorized into weighted quintiles of per capita household income computed in the pooled sample, from the poorest to the richest quintile, so that each quintile contains one fifth of the weighted population with diabetes; quintiles rather than arbitrary monetary cut-offs were used to make the groups comparable across the two waves despite inflation. Race/color was categorized as White, Black, Brown and Other, following the survey classification, in which Black and Brown are the groups historically exposed to racial disadvantage. Region was derived from the state of residence as North, Northeast, Southeast, South and Center-West, the five macroregions that structure the public health system. Health service use comprised private medical health insurance, regular medical follow-up for diabetes and medical care for diabetes within the last twelve months; the first two were retained in the adjusted model. Covariates for adjustment were age, sex and educational attainment, the last grouped into four levels from up to incomplete primary education to tertiary education.
Data processing and quality control
The fixed-width microdata files were read with the column positions and formats published in the official dictionaries of each wave. Records were restricted to realized interviews, and the analytical file was built from the diabetes module of the selected resident questionnaire. Range and consistency checks were applied to age, income and the outcome categories, and duplicates were ruled out by the absence of repeated primary sampling unit and person identifiers. The cleaned analytical subset was stored for reproducibility, and the analysis script was executed twice with identical results.
Statistical analysis
All estimates accounted for the survey weights, strata and primary sampling units of each wave, and primary sampling units were made unique across waves by prefixing the survey year. Coverage was estimated as a weighted percentage with 95% confidence intervals obtained by Taylor linearization of the design, using the post-stratification weights calibrated to population projections for the selected resident. Absolute inequality was expressed as the percentage-point difference between extreme groups and relative inequality as the ratio of coverage between them, computed within each wave. Associations were estimated with survey-weighted Poisson regression with log link and robust sandwich variance, which yields adjusted prevalence ratios with 95% confidence intervals for a binary outcome; the model was adjusted for age, sex, education, income quintile, race/color, region, private health insurance, regular diabetes follow-up and survey year. Reference categories were the poorest income quintile, White race/color, the Southeast region, the lowest education level and the 2013 wave. Because regular follow-up and recent diabetes care are strongly collinear, recent care was retained only in the descriptive analysis. A sensitivity analysis redefined the outcome as examination within the last twelve months, and a second sensitivity analysis excluded the 2019 wave to verify the stability of the associations in the earlier survey. The significance level was set at 0.05, two sided, and confidence intervals were reported at 95%. Analyses were performed in Python with pandas, NumPy, SciPy and Statsmodels, and figures were produced with Matplotlib in grayscale at 300 dpi. Because the data are public and anonymized, no ethical approval was required.
RESULTS
The analytical sample comprised 9,499 adults aged 18 years or older with a self-reported diagnosis of diabetes, of whom 3,182 were interviewed in 2013 and 6,317 in 2019 (Table 1). In 2019 the sample was predominantly female and older, with 58.1% women and 56.5% of participants aged 60 years or older; the corresponding figures in 2013 were 59.8% and 52.6%. The largest race/color group was Brown in 2019 (41.2%) and White in 2013 (51.1%), and roughly two thirds of participants had not completed primary education in both waves. Between the two waves the sample aged and the proportion reporting regular diabetes follow-up increased from 67.7% to 71.4%, while the proportion with private insurance remained around 28%. Records with missing or ignored responses to the foot examination question were excluded from the outcome analyses, which left the effective sample for coverage estimates slightly smaller than the total analytical sample. Overall coverage of ever having the feet examined reached 46.8% (95% CI 45.13-48.52), and coverage of examination within the last twelve months reached 34.8% (95% CI 33.21-36.53).
Characteristic | 2013 | 2019 |
|---|---|---|
Female | 59.8 (2355) | 58.1 (4210) |
Age 60 years or older | 52.6 (1896) | 56.5 (4274) |
Race: White | 51.1 (1556) | 45.1 (2734) |
Race: Black | 10.7 (415) | 11.6 (879) |
Race: Brown | 36.8 (1608) | 41.2 (3354) |
Education: up to incomplete primary | 71.1 (2562) | 66.2 (4767) |
Education: tertiary | 8.5 (332) | 9.5 (710) |
Private health insurance | 28.3 (948) | 27.6 (1733) |
Regular diabetes follow-up | 67.7 (2496) | 71.4 (4921) |
Diabetes care in last 12 months | 72.9 (2705) | 79.1 (5670) |
Region: Southeast | 49.8 (1050) | 47.8 (1832) |
Region: Northeast | 22.8 (1069) | 24.6 (2416) |
Note: Values are weighted percentages with unweighted counts in parentheses. Source: Elaborated by the authors from IBGE PNS 2013 and 2019 microdata.
The pattern across the two waves was one of limited change, with coverage of 44.8% in 2013 and 48.3% in 2019 (Figure 1). The distribution of coverage by income formed a gradient in both waves; the gap between the richest and poorest quintiles reached 18.4 percentage points in 2013 and 19.9 percentage points in 2019, and coverage was 1.5 times higher in the richest than in the poorest quintile in 2019 (Figure 2). In 2019 coverage climbed from 37.9% in the poorest quintile to 43.9% in the second, 49.1% in the third, 47.7% in the fourth and 57.8% in the richest quintile, and in 2013 the same pattern ranged from 41.4% to 59.8%. The slope of the gradient was monotonic in 2019 but flattened between the third and fourth quintiles, and the gap was driven mainly by the markedly higher coverage of the richest group.
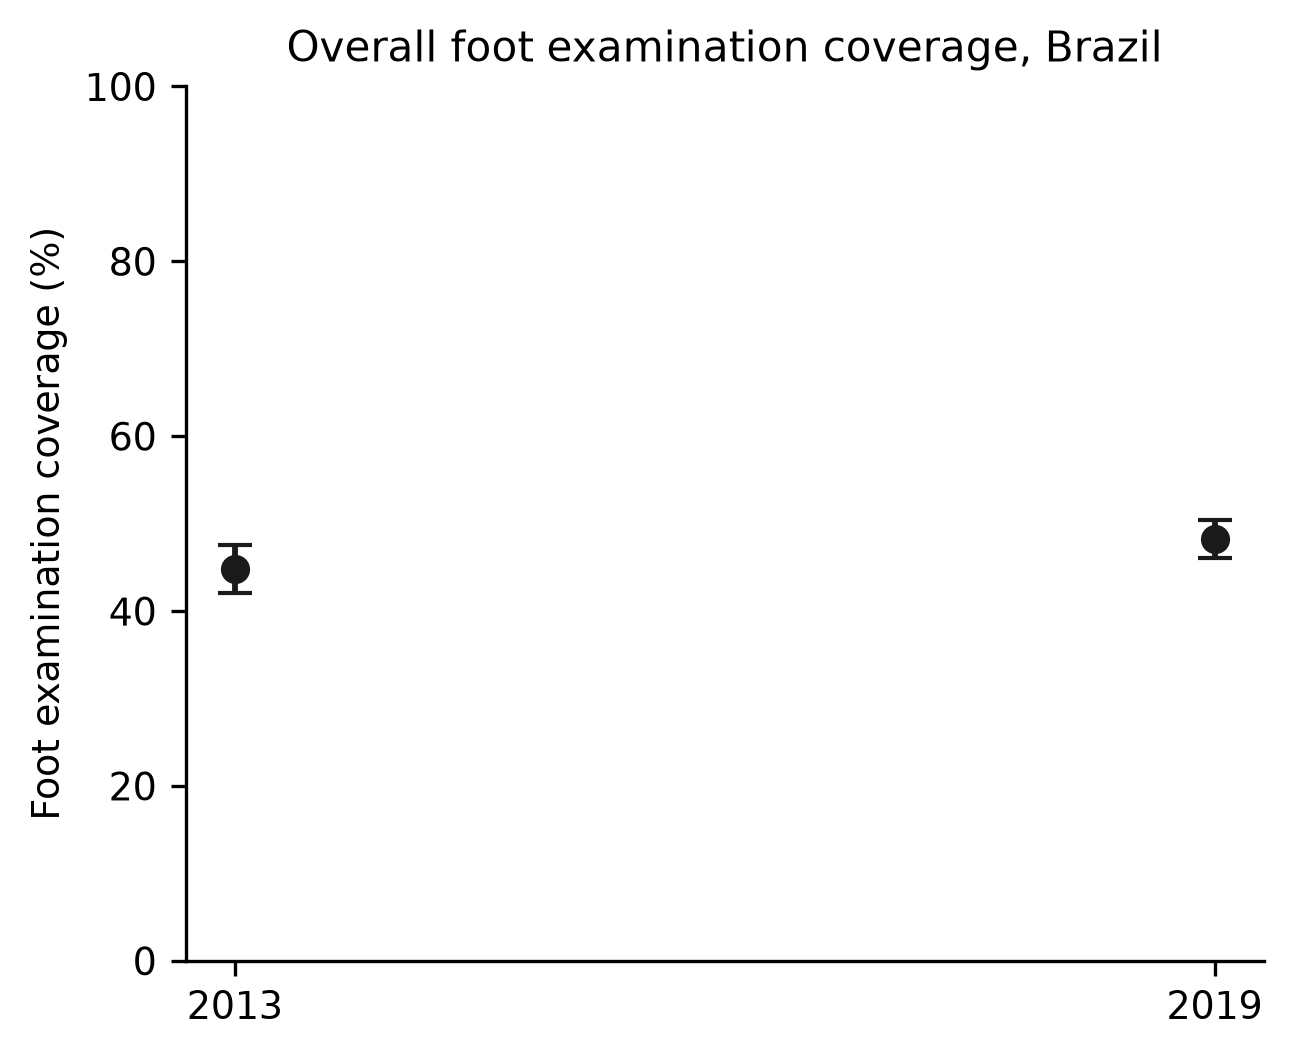
Figure 1. Overall coverage of foot examination among adults with diabetes, Brazil, 2013 and 2019.
Note: Dots represent weighted coverage and bars represent 95% confidence intervals. Source: Elaborated by the authors from IBGE PNS 2013 and 2019 microdata.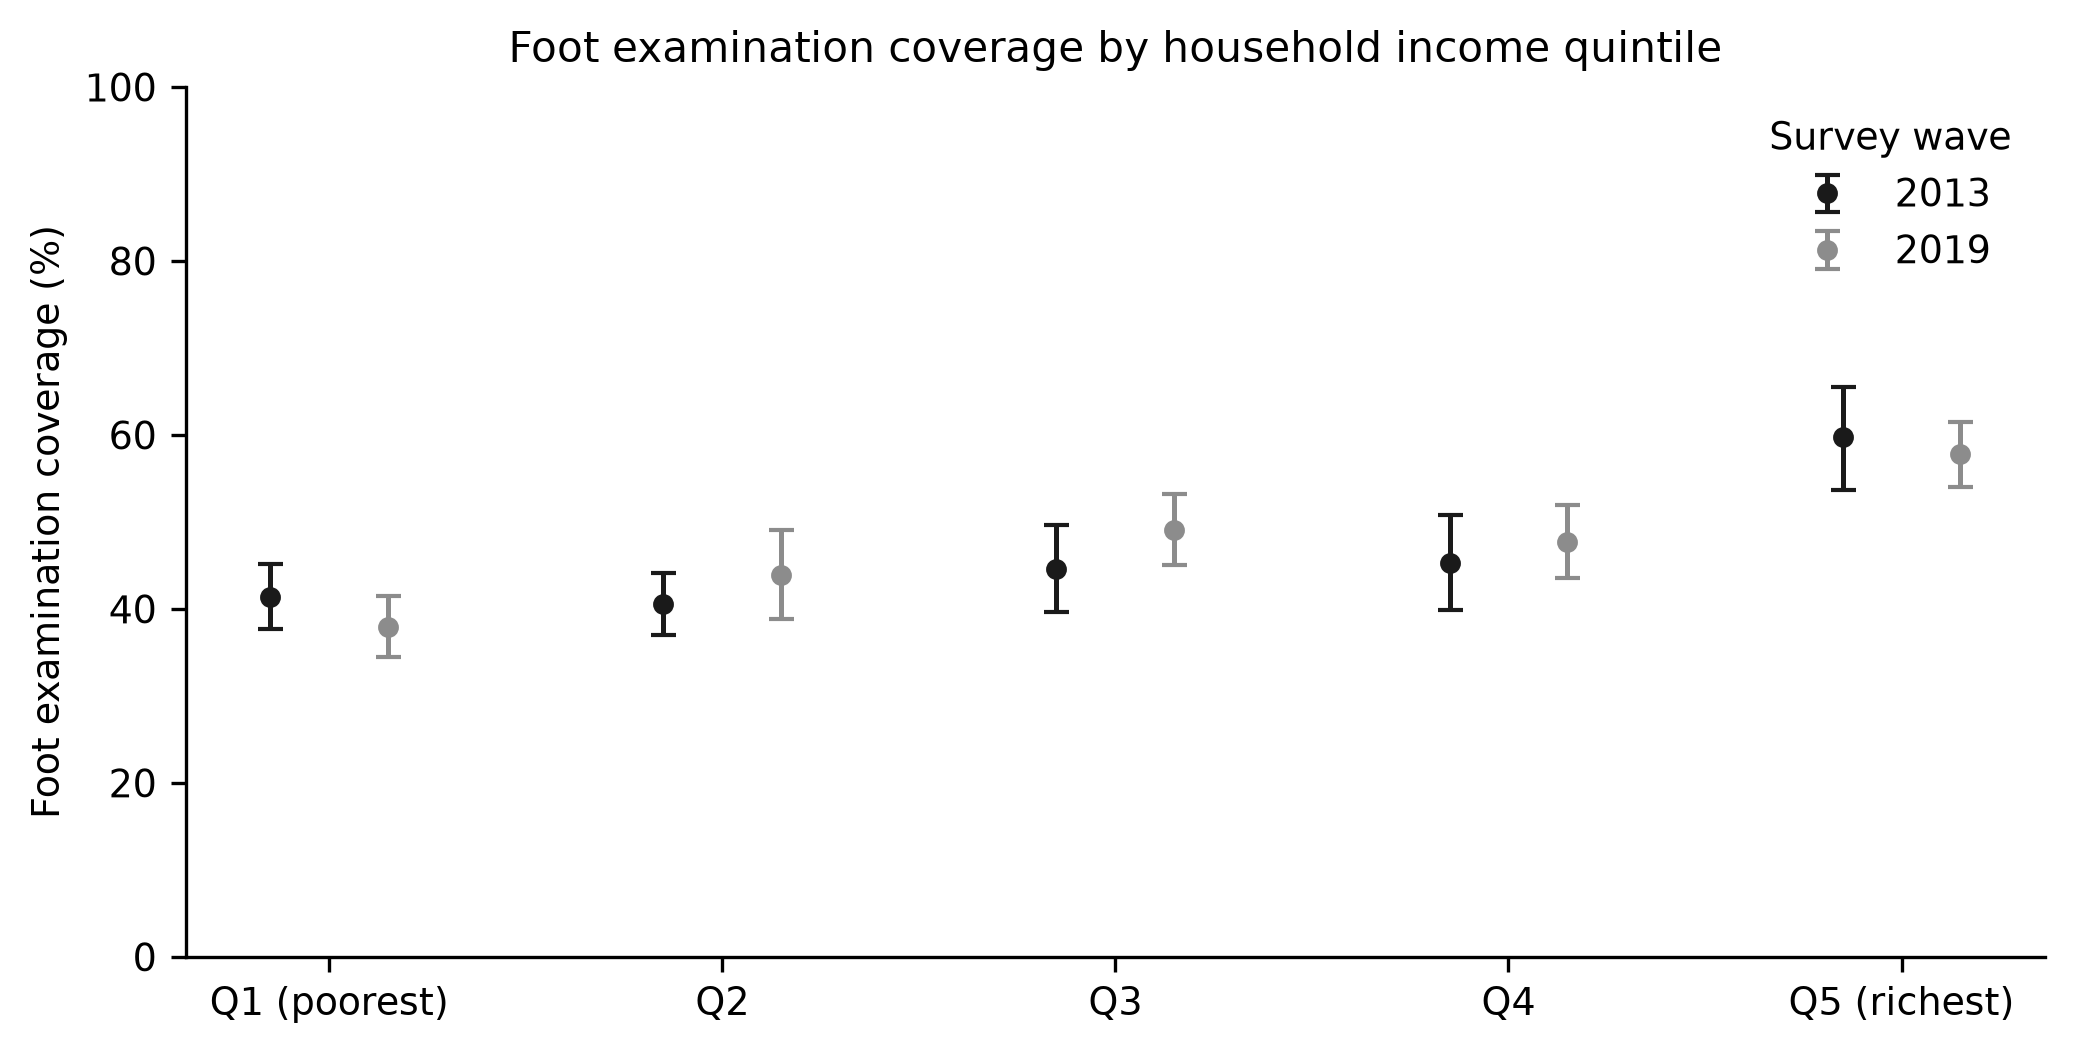
Figure 2. Coverage of foot examination among adults with diabetes by per capita household income quintile, Brazil, 2013 and 2019.
Note: Dots represent weighted coverage and bars represent 95% confidence intervals. Source: Elaborated by the authors from IBGE PNS 2013 and 2019 microdata.The distribution of coverage by race/color changed between waves (Figure 3). In 2013 White, Black and Brown adults reported similar coverage, with the lowest value among Brown adults at 40.8%, and in 2019 the White-Black difference reached −10.6 percentage points, with the lowest value among Black adults at 41.2% and with White adults at 51.8%. Coverage by region spread across a wide range in both waves, peaking in the Southeast and South and reaching the lowest values in the Northeast in 2013 (Figure 4); the Northeast-Southeast difference narrowed from 12.8 percentage points in 2013 to 4.2 percentage points in 2019, and the Center-West moved from the lowest position in 2013 to an intermediate position in 2019. In 2019 the regional values ranged from 45.5% in the Northeast to 49.8% in the South, a substantially narrower spread than in 2013, when the Northeast reached only 37.0% against 49.8% in the Southeast.
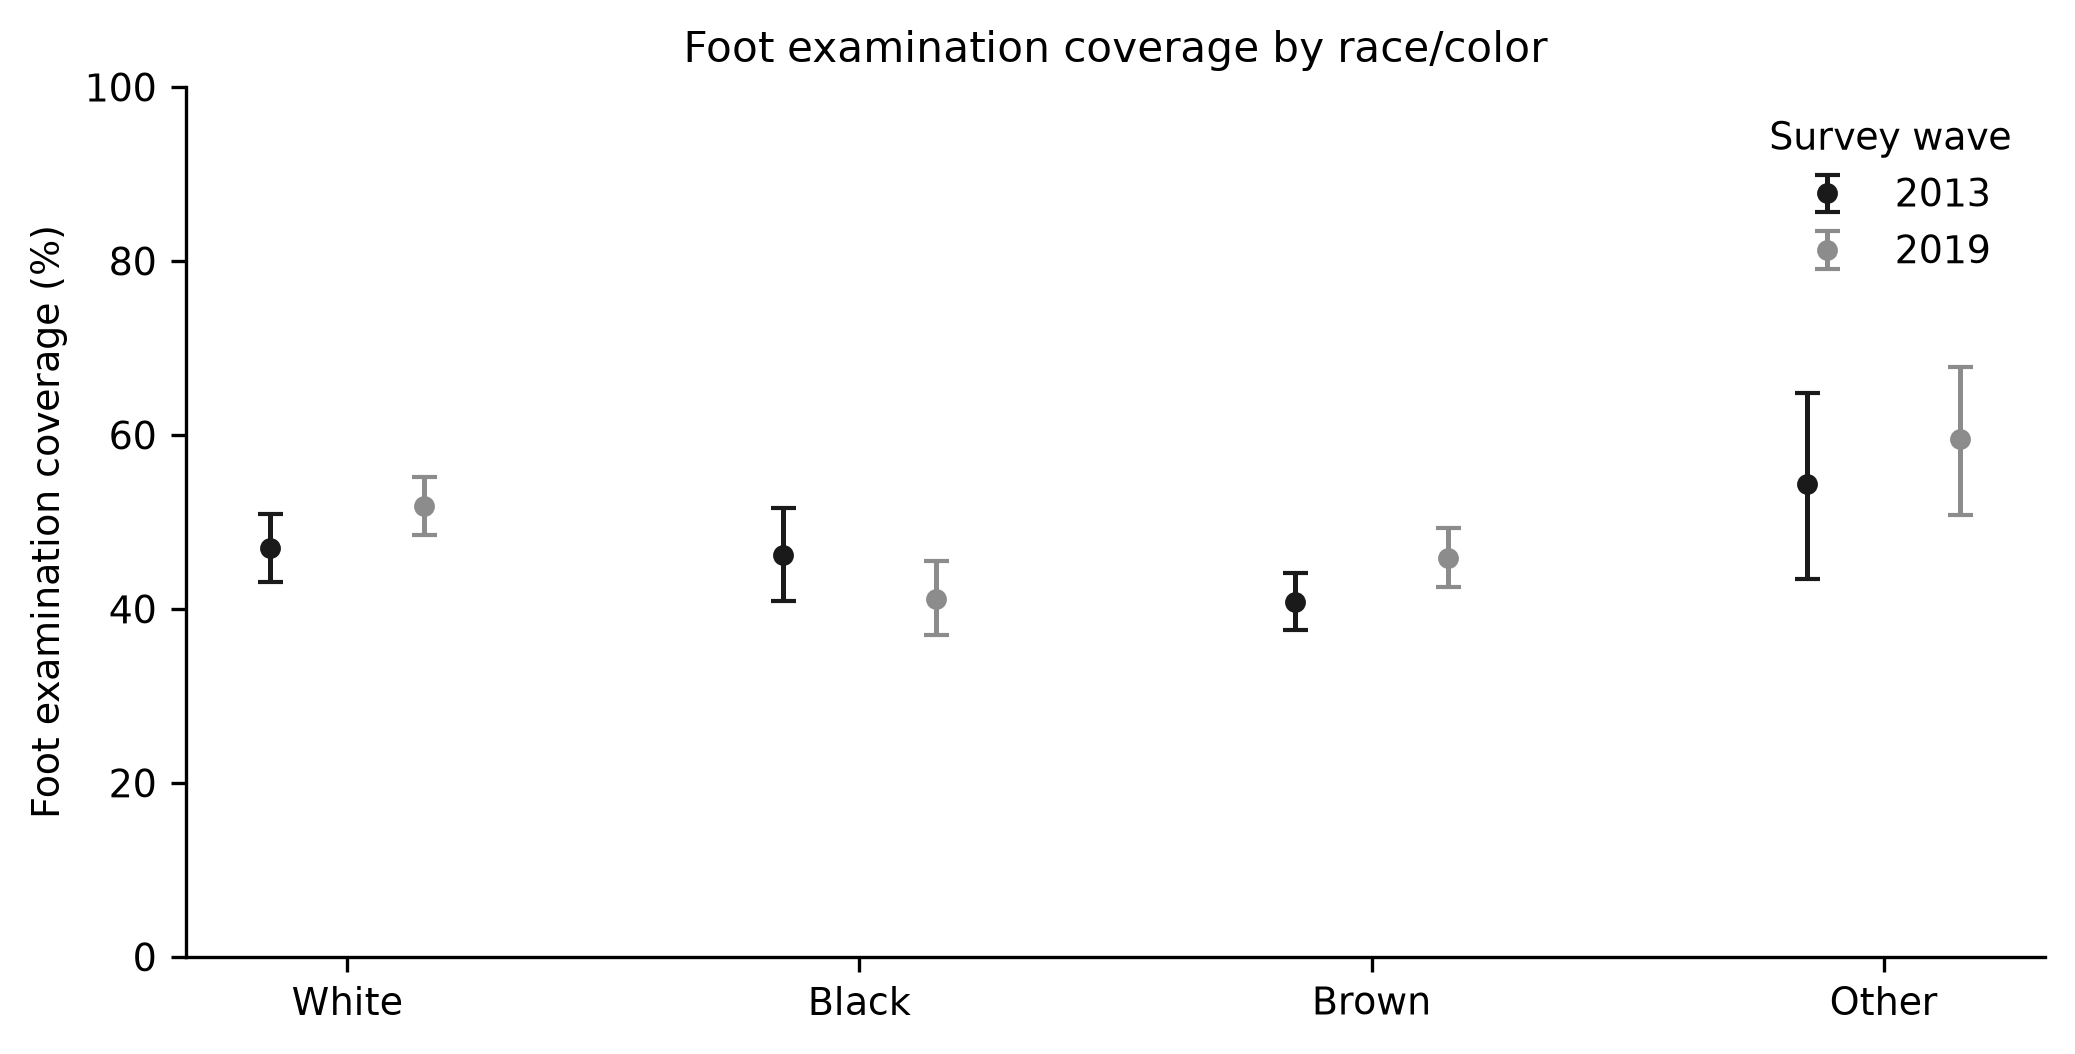
Figure 3. Coverage of foot examination among adults with diabetes by race/color, Brazil, 2013 and 2019.
Note: Dots represent weighted coverage and bars represent 95% confidence intervals. Source: Elaborated by the authors from IBGE PNS 2013 and 2019 microdata.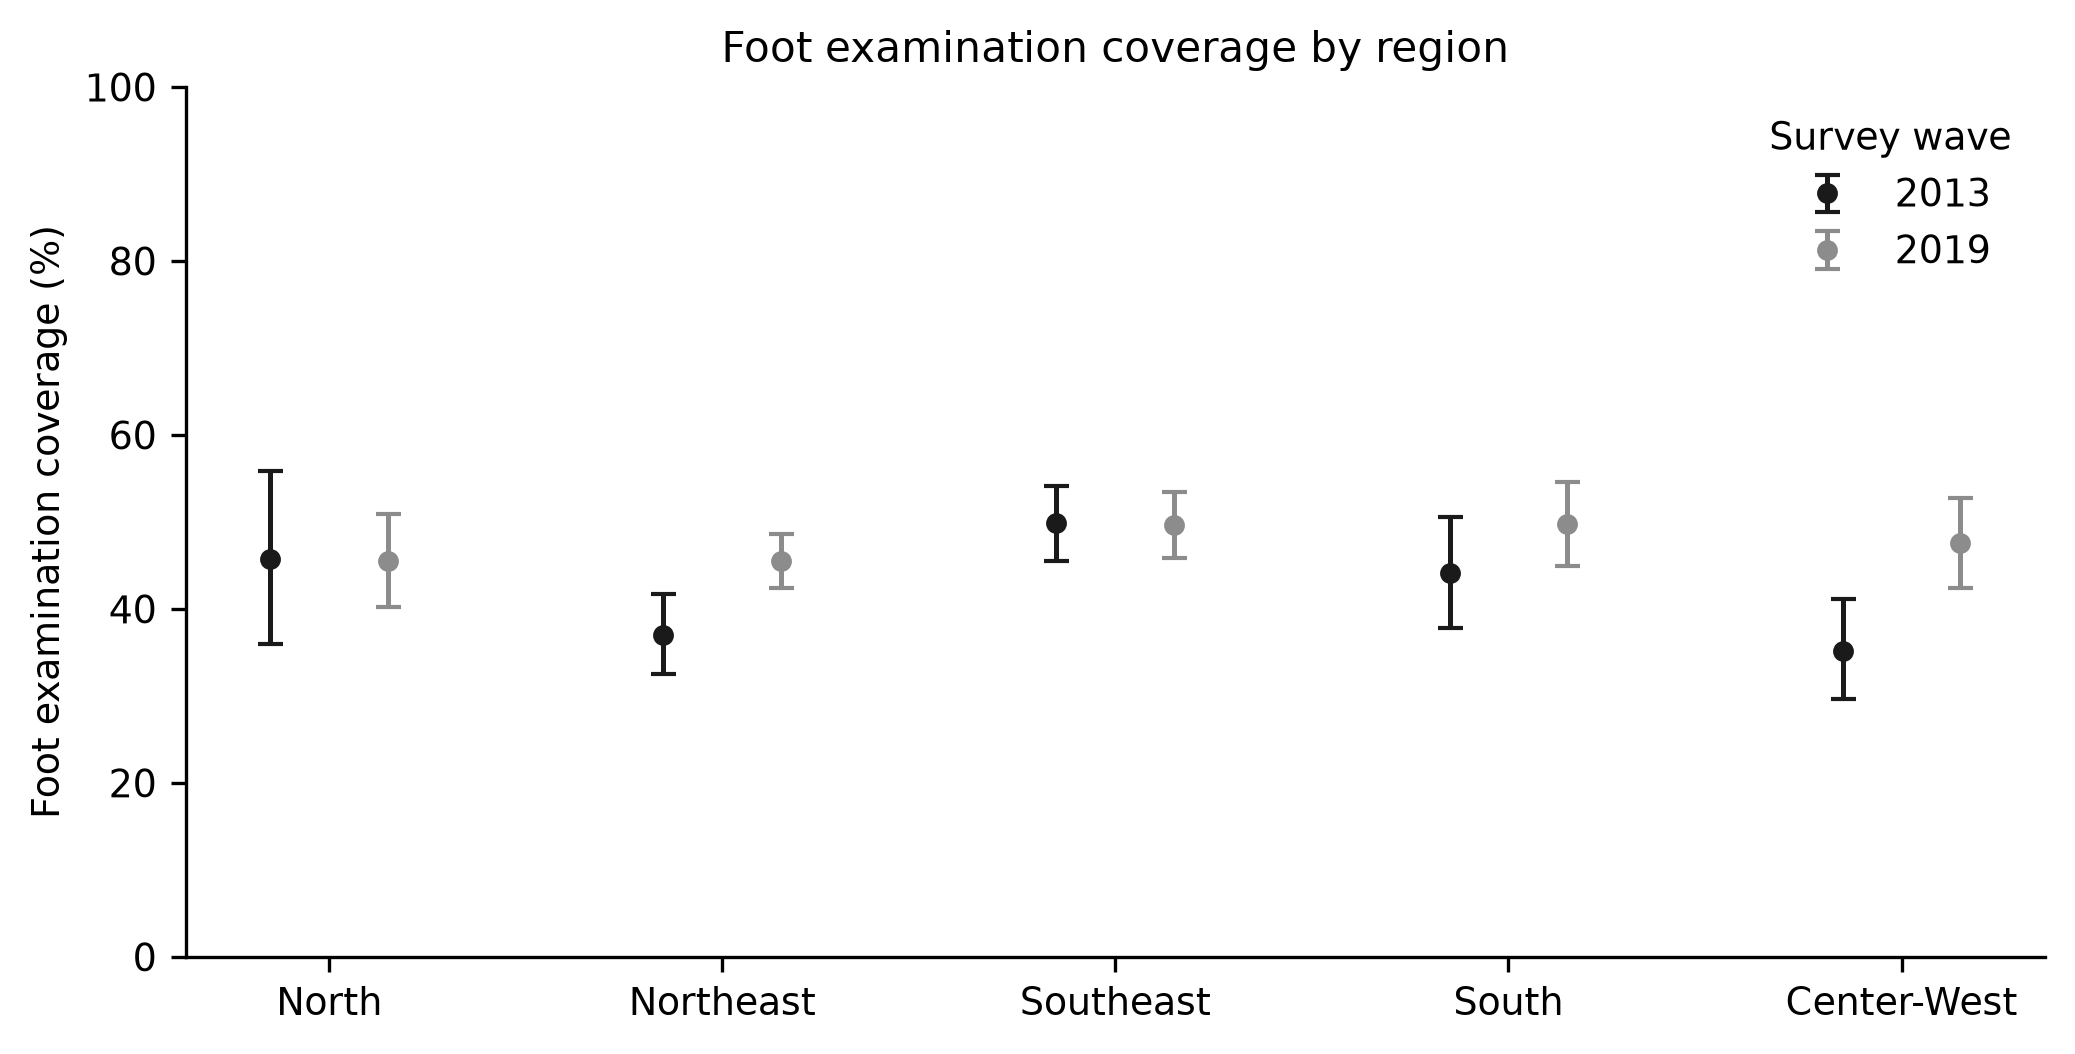
Figure 4. Coverage of foot examination among adults with diabetes by geographic region, Brazil, 2013 and 2019.
Note: Dots represent weighted coverage and bars represent 95% confidence intervals. Source: Elaborated by the authors from IBGE PNS 2013 and 2019 microdata.Coverage also varied by health service use, with higher values among adults with private insurance and regular diabetes follow-up than among those without (Figure 5). In 2019 coverage reached 56.8% among adults with private insurance and 45.0% among those without, and 51.6% among those with regular follow-up against 34.2% among those without; the corresponding values in 2013 were 54.3% against 41.0% and 50.2% against 31.4%. Adults who had received diabetes care in the last twelve months also reported higher coverage than those who had not, with 49.3% against 39.8% in 2019. In the adjusted model, the income gradient persisted, with an adjusted prevalence ratio of 1.22 (95% CI 1.07-1.39) for the richest compared with the poorest quintile, and the intermediate quintiles showed progressively smaller estimates that did not all reach statistical significance (Table 2). Regular diabetes follow-up showed the strongest association, with an adjusted prevalence ratio of 1.49 (95% CI 1.34-1.65), and private health insurance was also associated with higher coverage (adjusted prevalence ratio 1.13; 95% CI 1.03-1.24). The race/color differences observed descriptively were attenuated after adjustment, with adjusted prevalence ratios of 0.92 (95% CI 0.82-1.04) for Black and 0.97 (95% CI 0.89-1.05) for Brown adults relative to White adults, and coverage was similar between waves (adjusted prevalence ratio 1.01; 95% CI 0.94-1.09). Among the other covariates, adults with tertiary education had higher adjusted coverage than those with up to incomplete primary education, and coverage remained lower in the Center-West than in the Southeast.
The secondary outcome followed the same patterns. Coverage of examination within the last twelve months reached 33.5% (95% CI 30.87-36.26) in 2013 and 35.8% (95% CI 33.75-37.94) in 2019, and the gap by income and by health service use remained visible in both waves. The twelve-month indicator was consistently lower than lifetime coverage in every stratum, which reflects the fact that a proportion of adults who had ever been examined did not receive the examination in the reference year, a pattern consistent with the gap between any and annual preventive care.
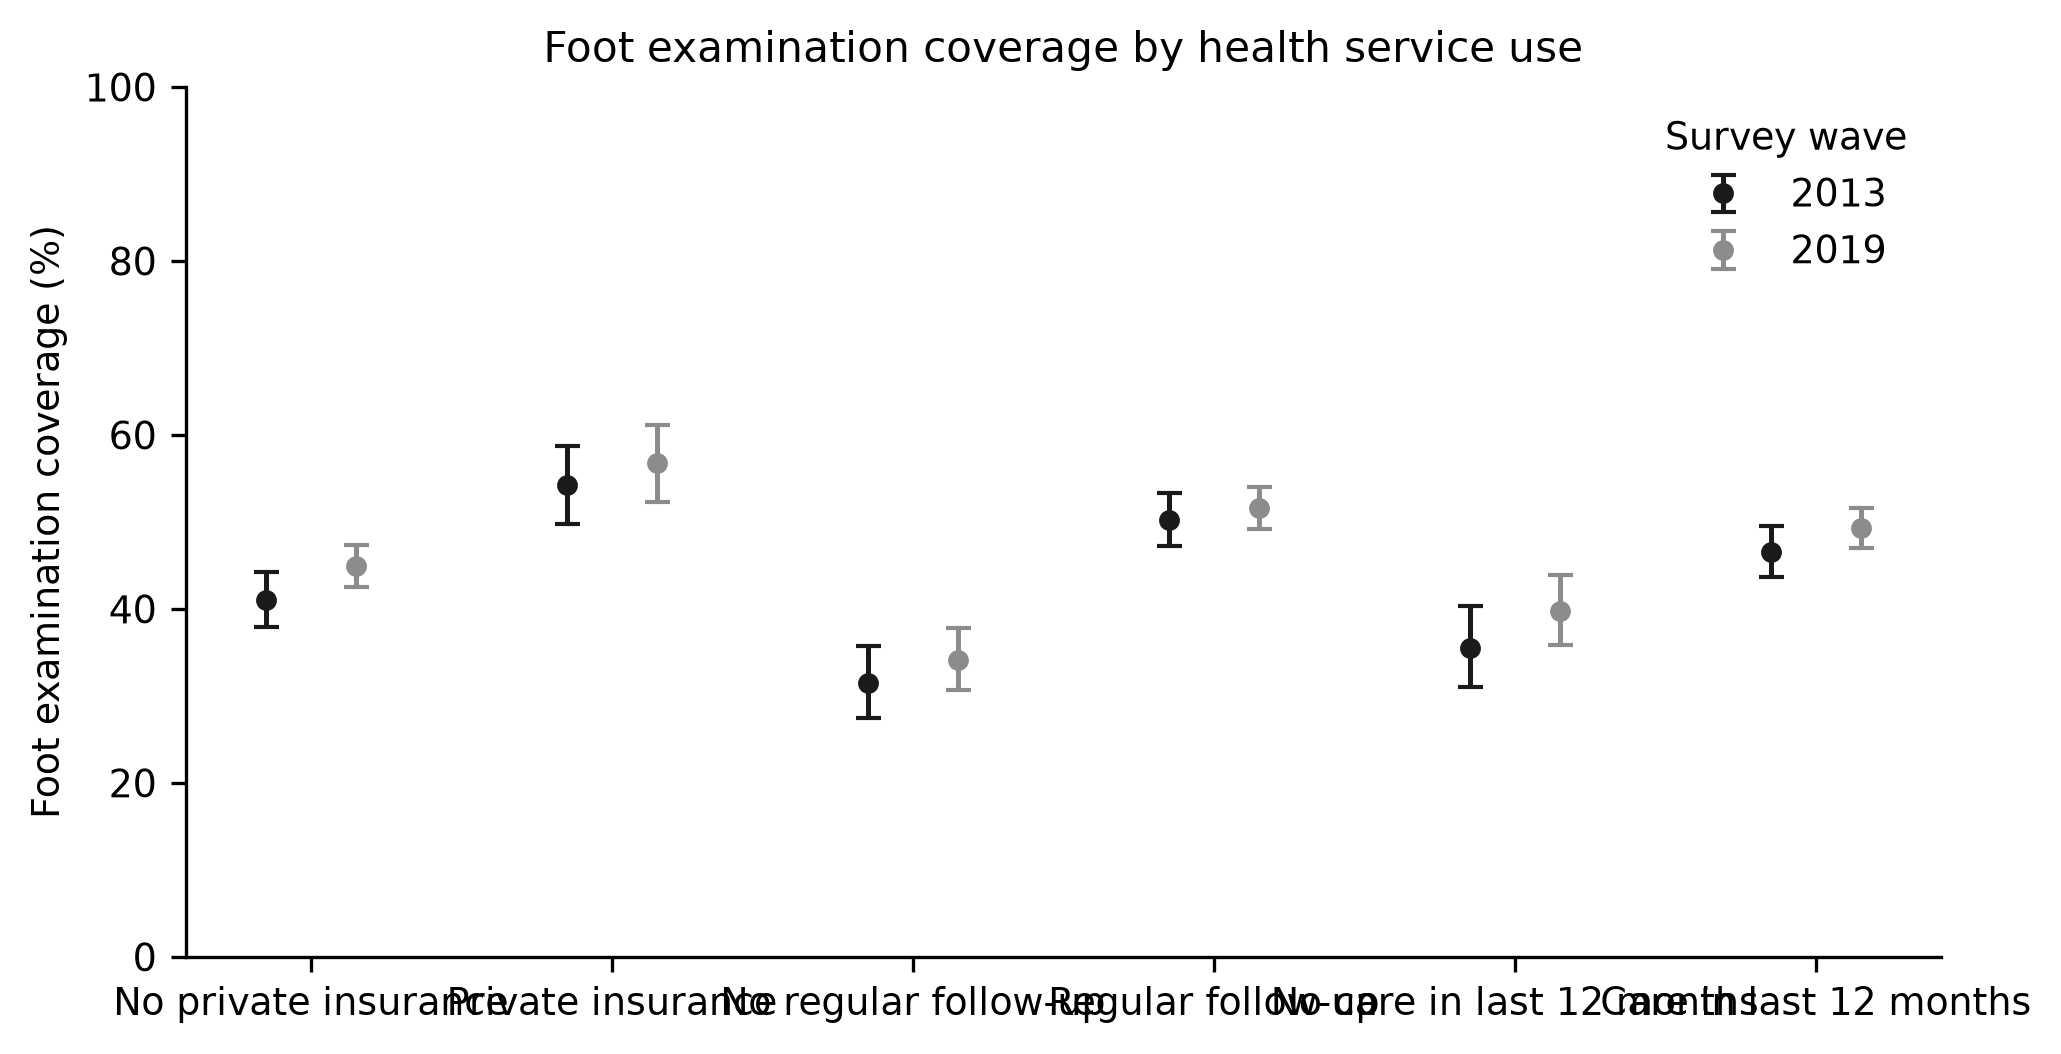
Figure 5. Coverage of foot examination among adults with diabetes by health service use, Brazil, 2013 and 2019.
Note: Dots represent weighted coverage and bars represent 95% confidence intervals. Source: Elaborated by the authors from IBGE PNS 2013 and 2019 microdata.Variable | Prevalence ratio | 95% CI | p |
|---|---|---|---|
Income quintile 2 (vs 1) | 1.03 | 0.91-1.17 | 0.653 |
Income quintile 3 (vs 1) | 1.12 | 1.00-1.27 | 0.057 |
Income quintile 4 (vs 1) | 1.06 | 0.94-1.20 | 0.357 |
Income quintile 5, richest (vs 1) | 1.22 | 1.07-1.39 | 0.002 |
Race/color: Black (vs White) | 0.92 | 0.82-1.04 | 0.198 |
Race/color: Brown (vs White) | 0.97 | 0.89-1.05 | 0.469 |
Race/color: Other (vs White) | 1.16 | 0.92-1.45 | 0.209 |
Region: North (vs Southeast) | 1.01 | 0.89-1.15 | 0.832 |
Region: Northeast (vs Southeast) | 0.93 | 0.85-1.02 | 0.131 |
Region: South (vs Southeast) | 0.97 | 0.88-1.07 | 0.581 |
Region: Center-West (vs Southeast) | 0.89 | 0.80-0.99 | 0.029 |
Private health insurance | 1.13 | 1.03-1.24 | 0.008 |
Regular diabetes follow-up | 1.49 | 1.34-1.65 | <0.001 |
Education: incomplete secondary (vs up to incomplete primary) | 1.04 | 0.87-1.26 | 0.650 |
Education: secondary or incomplete tertiary | 1.02 | 0.93-1.12 | 0.680 |
Education: tertiary | 1.14 | 1.02-1.27 | 0.026 |
Survey year 2019 (vs 2013) | 1.01 | 0.94-1.09 | 0.748 |
Note: Survey-weighted Poisson regression with log link and robust variance, adjusted for age, sex, education, income quintile, race/color, region, private health insurance, regular diabetes follow-up and survey year. CI = confidence interval. Source: Elaborated by the authors from IBGE PNS 2013 and 2019 microdata.
DISCUSSION
Coverage of foot examination among Brazilian adults with diabetes is incomplete and unevenly distributed: nearly half of adults with diabetes had never had their feet examined, and coverage varied by income, race/color, region and health service use. The income gradient persisted after adjustment, regular diabetes follow-up was the strongest correlate of examination, and the descriptive race/color gap was largely explained by income, region and service use. The stability of overall coverage between the two waves, in the context of a growing population with diabetes, implies that the absolute number of adults who have never had a foot examination did not fall over the period.
The coverage observed here is consistent with a 2019 nationwide analysis that reported that 52% of adults with diabetes had never had their feet examined.(12) The pattern also agrees with studies showing socioeconomic and racial inequalities in diabetes care in Brazil, in which preventive services reach richer and White adults more often than poorer and Black or Brown adults.(13,14) The gradient repeats a pattern documented across Latin America, where compliance with eye and foot preventive care is low and favors groups with better access, and it is consistent with the unequal distribution of diabetes care processes described for hypertension and diabetes medicines in the public system.(17,18) The persistence of the gradient despite a universal public health system suggests that barriers operate beyond coverage of services, at the level of supply, referral and provider adherence to foot examination protocols.(19)
The pattern of the income gradient is compatible with the unequal distribution of diabetes complications in Brazil. Studies of hospitalized patients and regional records show that foot ulcers and amputations concentrate in socially vulnerable populations and in less developed regions.(20-23) The higher amputation burden in poorer areas mirrors the lower coverage of preventive examination found here, which supports the plausibility of an association between deficient screening and later complications.(9) The same inversion, in which those at highest risk receive the least prevention, has been reported in Brazilian primary care settings, where established risk factors for foot ulcers are detected late.(24) In the United States, similar disparities in preventive foot examination have been described among socially disadvantaged groups, suggesting that the phenomenon is not specific to Brazil.(25-28)
The magnitude of the coverage found here is low even by the standards of countries that also report gaps in preventive care. National estimates from the United States describe higher rates of annual foot examination than the lifetime coverage observed in Brazil, although they too show flat or incomplete progress over time, and analyses of national health examination surveys in the United States associate the receipt of a foot check with older age and with markers of more intensive diabetes care rather than with need.(26,28,29) Across Latin America and the Caribbean, pooled estimates indicate that a substantial share of people with diabetes do not receive either eye or foot preventive care, which places the Brazilian results within a regional pattern of incomplete preventive coverage.(17) The comparison suggests that the shortfall in Brazil is not explained by the absence of guidance or by the novelty of the recommendation, but by the way preventive foot care is organized and delivered.
Several mechanisms can explain why the examination concentrates in routine follow-up and among the insured. In the public system, the examination depends on the availability of trained providers and on time during consultations that are often occupied by urgent problems; health professionals themselves identify lack of time, training and equipment as barriers.(19,30) On the demand side, patients with limited schooling are less able to request the examination, and low health literacy has been associated with worse foot outcomes elsewhere.(31) The combination of supply and demand constraints makes the examination sensitive to the quality of the primary care unit in which the person is registered, which is consistent with the regional differences observed here.(32)
The absence of meaningful change between 2013 and 2019 deserves attention, because the period coincided with the expansion of primary care coverage through the Family Health Strategy and with explicit national goals for the care of people with chronic conditions. The stability of coverage suggests that the expansion of access did not by itself translate into more foot examinations, and that the examination has not been incorporated as a routine item of the diabetes consultation in most services. The monitoring of noncommunicable disease goals has improved the availability of indicators, but the foot examination indicator appears to have remained below its target over the period.(11) This finding points to an implementation gap rather than a knowledge gap, in which recommendations exist but the clinical routine does not convert them into systematic examination.
The Brazilian context is relevant for interpreting the gap. The Unified Health System offers universal coverage, and diabetes care is organized largely in primary care, where the Family Health Strategy reaches the poorest municipalities and households. The fact that the income gradient and the follow-up gradient persist within a universal system indicates that universal entitlement is not sufficient when the clinical content of the consultation is not standardized. It also suggests that private coverage confers an advantage through the organization of preventive items such as the foot examination, beyond faster access alone, a pattern consistent with the unequal sources of medicines described for hypertension and diabetes in the same survey.(18) Policies that make the foot examination a remunerated or monitored item of the primary care record could therefore act on the strongest modifiable correlate identified here.
From a podiatric perspective, the results reinforce the rationale for integrating foot risk assessment into the primary care pathway for diabetes and for strengthening referral of people at high risk to specialized foot care. The gradient by income and the attenuation of the race/color gap after adjustment indicate that the most effective target is the population without regular follow-up and without private coverage, rather than any single demographic group. Structured screening programs have shown that coverage can be raised when the examination is made an explicit, scheduled step of the diabetes visit, and the same logic is applicable to the Brazilian public network, where the podiatric examination remains an underused resource in the management of the diabetic foot.(33,34)
Race/color differences were present descriptively and coincide with prior evidence that Black and Brown Brazilians experience worse diabetes-related outcomes and lower use of preventive care.(35,36) The widening White-Black gap between 2013 and 2019 is consistent with the 2019 analysis that identified race as a marker of missing foot examination and reported that never having had the feet examined was more frequent among Black and Brown than among White adults.(12) In this study the gap was largely attenuated after adjustment for income, region and service use, which suggests that much of the racial inequality in foot examination operates through the unequal socioeconomic position and access to services of Black and Brown adults rather than through race itself. The interpretation is that race/color is a powerful and easily measured marker of disadvantage, but that the modifiable levers for closing the gap are the same ones identified for income and service use. The regional gradient, with lower coverage in the North and Northeast, aligns with the historical concentration of health services and specialized care in the Southeast and South.(13) Regional differences in the prevalence of foot problems and in patients' knowledge of foot care point in the same direction and suggest that local supply and education shape what examination can achieve.(37,38)
The association between health service use and foot examination indicates that the examination is largely delivered through routine diabetes care. Adults who attend regular follow-up or received care within the last year had markedly higher coverage, and private insurance was independently associated with examination, a finding that mirrors the positive association between a good assessment of primary health care and better care processes in Brazil.(29,32) Completion of routine diabetes care processes has been linked to lower mortality, which reinforces the value of embedding foot examination in follow-up visits.(39) Self-care practices are also more frequent where professional guidance is provided, which further links the delivery of the examination to broader preventive behavior.(40) This finding suggests that strengthening the integration of foot examination into routine primary care consultations, rather than relying on separate specialty visits, could raise coverage across all groups.(33) Screening embedded in primary care has been shown to contribute to the prevention of lower extremity amputations, which makes the low coverage documented here an equity problem and, at the same time, a missed opportunity for prevention.(33) Health professionals report barriers of time, training and equipment, and low health literacy is associated with worse foot outcomes, which supports the need for system-level rather than individual-level interventions.(19,30,31) Similar campaigns in other settings have shown that structured screening can expand early detection of foot problems.(34)
The main strengths of this study are the nationally representative sample, the design-based estimation, the availability of two waves and the standardized measurement of the outcome through a validated survey question. The use of post-stratification weights and the explicit treatment of strata and primary sampling units make the coverage estimates and prevalence ratios representative of the Brazilian adult population with diabetes, and the reproducibility of the analysis was confirmed by running the analytical script twice with identical results. The limitations are those inherent to self-reported data, which may overestimate preventive care relative to administrative records, and to the cross-sectional design, which does not establish temporality between exposures and examination. The outcome captures the recall of an examination by any health professional and does not distinguish the quality or the completeness of that examination, nor does it distinguish a visual inspection from a structured assessment of sensation. The income and race categorizations follow the survey's own definitions and cannot separate the overlapping contributions of income, race and region. Missing outcome data were modest and were excluded, and the exclusion is unlikely to bias the estimates because the demographic profile of excluded records did not differ materially from the analytical sample. The comparison of two waves relies on the assumption that the outcome question is understood in the same way in both editions, which is supported by the identical wording of the question in the two questionnaires. The findings generalize to the national population of adults with diabetes in Brazil because the survey is nationally representative, but they do not describe the clinical quality of the examination or the subsequent referral of people at risk to specialized foot care. Future studies should link survey data to primary care records to validate self-reported foot examination and should monitor coverage annually to detect changes after policy interventions, ideally with clinical confirmation of the examination rather than self-report.
Taken together, the results describe a preventive service that remains far from universal and that reproduces the broader inequalities of the Brazilian health system. The examination is available to those who are already connected to regular care, which means that the very population most exposed to foot complications, poorer adults without regular follow-up, is the least likely to be screened. The stability of coverage across two waves, in a context of expanding primary care, indicates that closing this gap requires more than the general expansion of services: it requires making the foot examination an explicit, scheduled and audited component of the diabetes consultation and of the quality indicators used to evaluate primary care.
The implications are practical. Because the examination is already concentrated in routine diabetes care, policies that embed a structured foot examination into every diabetes consultation, particularly in the public primary care network of the North and Northeast, would target the largest gaps. Monitoring coverage by income and race/color, in addition to the overall average, would allow the health system to detect inequalities that a single national indicator conceals, and would guide the allocation of training and equipment to the areas where the gap between risk and prevention is widest.
CONCLUSIONS
Coverage of foot examination among Brazilian adults with diabetes was incomplete in both survey waves, reaching less than half of the population, and it changed little between 2013 and 2019. Inequalities were marked by income, with a gap of nearly twenty percentage points between the richest and poorest quintiles, and were present to a smaller and partly overlapping degree by race/color and region. Regular diabetes follow-up and private health insurance were the strongest correlates of having the feet examined, which identifies the connection to routine diabetes care as the main lever for improvement. Monitoring coverage by income and race/color, and embedding the foot examination as an explicit item of the diabetes consultation, are needed to close the gap between risk and prevention in the population with diabetes.
References
- 1 Reis RCPD, Duncan BB, Malta DC, Iser BPM, Schmidt MI. Evolution of diabetes in Brazil: prevalence data from the 2013 and 2019 Brazilian National Health Survey. Cad Saúde Pública. 2022;38(suppl 1):e00149321. doi: 10.1590/0102-311x00149321
- 2 Malta DC, Bernal RTI, Sá ACMGND, Silva TMRD, Iser BPM, Duncan BB, et al. Self-reported diabetes and factors associated with it in the Brazilian adult population: National Health Survey, 2019. Ciênc saúde coletiva. 2022;27(7):2643-2653. doi: 10.1590/1413-81232022277.02572022en
- 3 Macinko J, Mullachery PH. Education-related health inequities in noncommunicable diseases: an analysis of the Brazilian National Health Survey, 2013 and 2019. Cad Saúde Pública. 2022;38(suppl 1):e00137721. doi: 10.1590/0102-311x00137721
- 4 Muzy J, Campos MR, Emmerick I, Silva RSD, Schramm JMDA. Prevalência de diabetes mellitus e suas complicações e caracterização das lacunas na atenção à saúde a partir da triangulação de pesquisas. Cad Saúde Pública. 2021;37(5):e00076120. doi: 10.1590/0102-311x00076120
- 5 Martins RB, Ordaz-Briseño SA, Flores-Hernández S, Bós ÂJG, Baptista-Rosas RC, Mercado-Sesma AR. Comparison of prevalence of diabetes complications in Brazilian and Mexican adults: a cross-sectional study. BMC Endocr Disord. 2021;21(1):48. doi: 10.1186/s12902-021-00711-y
- 6 Armstrong DG, Boulton AJM, Bus SA. Diabetic Foot Ulcers and Their Recurrence. N Engl J Med. 2017;376(24):2367-2375. doi: 10.1056/nejmra1615439
- 7 Bus SA, Sacco ICN, Monteiro‐Soares M, Raspovic A, Paton J, Rasmussen A, et al. Guidelines on the prevention of foot ulcers in persons with diabetes (IWGDF 2023 update). Diabetes Metabolism Res. 2024;40(3):e3651. doi: 10.1002/dmrr.3651
- 8 Perveen W, Ahsan H, Rameen Shahzad, Fayyaz S, Zaif A, Paracha MA, et al. Prevalence of peripheral neuropathy, amputation, and quality of life in patients with diabetes mellitus. Sci Rep. 2024;14(1):14430. doi: 10.1038/s41598-024-65495-2
- 9 Toscano C, Sugita T, Rosa M, Pedrosa H, Rosa R, Bahia L. Annual Direct Medical Costs of Diabetic Foot Disease in Brazil: A Cost of Illness Study. IJERPH. 2018;15(1):89. doi: 10.3390/ijerph15010089
- 10 van Netten JJ, Raspovic A, Lavery LA, Monteiro‐Soares M, Rasmussen A, Sacco ICN, et al. Prevention of foot ulcers in the at‐risk patient with diabetes: a systematic review. Diabetes Metabolism Res. 2020;36(S1):e3270. doi: 10.1002/dmrr.3270
- 11 Malta DC, Silva AGD, Gomes CS, Stopa SR, Oliveira MMD, Sardinha LMV, et al. Monitoramento das metas dos planos de enfrentamento das Doenças Crônicas Não Transmissíveis: resultados da Pesquisa Nacional de Saúde, 2013 e 2019. Epidemiol Serv Saúde. 2022;31(spe1):e2021364. doi: 10.1590/ss2237-9622202200008.especial
- 12 Bramante CN, Rizzato JS, Nakamura IB, Galvão TF, Silva MT. Racial Disparities in Foot Examination among People with Diabetes in Brazil: A Nationwide Survey, 2019. Ethn Dis. 2024;34(4):221-229. doi: 10.18865/ethndis-2023-50
- 13 Neves RG, Saes MDO, Duro SMS, Flores TR, Tomasi E. Inequalities in care for the people with diabetes in Brazil: A nationwide study, 2019. PLoS ONE. 2022;17(6):e0270027. doi: 10.1371/journal.pone.0270027
- 14 Malta DC, Ribeiro EG, Gomes CS, Alves FTA, Stopa SR, Sardinha LMV, et al. Indicadores da linha de cuidado de pessoas com diabetes no Brasil: Pesquisa Nacional de Saúde 2013 e 2019. Epidemiol Serv Saúde. 2022;31(spe1):e2021382. doi: 10.1590/ss2237-9622202200011.especial
- 15 Santos KBM, Reis RCPD, Duncan BB, D’Avila OP, Schmidt MI. Access to diabetes diagnosis in Brazil based on recent testing and consultation: The Brazilian national health survey, 2013 and 2019. Front Endocrinol. 2023;14:1122164. doi: 10.3389/fendo.2023.1122164
- 16 Souza Júnior PRBD, Szwarcwald CL, Almeida WDSD, Damacena GN, Pedroso MDM, Sousa CAMD, et al. Comparison of sampling designs from the two editions of the Brazilian National Health Survey, 2013 and 2019. Cad Saúde Pública. 2022;38(suppl 1):e00164321. doi: 10.1590/0102-311x00164321
- 17 Carrillo-Larco RM, Guzman-Vilca WC, Varghese JS, Pasquel FJ, Caixeta R, Antini C, et al. Compliance with eye and foot preventive care in people with self-reported diabetes in Latin America and the Caribbean: Pooled, cross-sectional analysis of nine national surveys. Primary Care Diabetes. 2024;18(3):374-379. doi: 10.1016/j.pcd.2024.03.001
- 18 Mengue SS, Tierling VL, Tavares NUL, Fontanella AT. Sources of medicines for hypertension and diabetes in Brazil: results from the National Health Survey. Cad Saúde Pública. 2022;38(suppl 1):e00152721. doi: 10.1590/0102-311x00152721
- 19 Mullan L, Driscoll A, Wynter K, Rasmussen B. Barriers and enablers to delivering preventative and early intervention footcare to people with diabetes: a scoping review of healthcare professionals’ perceptions. Australian Journal of Primary Health. 2019;25(6):517-525. doi: 10.1071/py19115
- 20 Cerqueira MMBDF, Maia HMSF, Mercês MCD, Santos da Natividade M, Almeida ODS, Santana EF, et al. Complications related to diabetic foot ulcer and associated social vulnerability factors at a referral centre in Brazil. J Wound Care. 2022;31(11):946-960. doi: 10.12968/jowc.2022.31.11.946
- 21 Santos KPBD, Luz SCTD, Mochizuki L, d'Orsi E. Carga da doença para as amputações de membros inferiores atribuíveis ao diabetes mellitus no Estado de Santa Catarina, Brasil, 2008-2013. Cad Saúde Pública. 2018;34(1). doi: 10.1590/0102-311x00013116
- 22 Costa WJT, Penha-Silva N, Bezerra IMP, Paulo dos Santos I, Ramos JLS, Castro JMD, et al. Analysis of Diabetes Mellitus-Related Amputations in the State of Espírito Santo, Brazil. Medicina. 2020;56(6):287. doi: 10.3390/medicina56060287
- 23 Parisi MCR, Moura Neto A, Menezes FH, Gomes MB, Teixeira RM, de Oliveira JEP, et al. Baseline characteristics and risk factors for ulcer, amputation and severe neuropathy in diabetic foot at risk: the BRAZUPA study. Diabetol Metab Syndr. 2016;8(1):25. doi: 10.1186/s13098-016-0126-8
- 24 Bortoletto MSS, Andrade SMD, Matsuo T, Haddad MDCL, González AD, Silva AMR. Risk factors for foot ulcers—A cross sectional survey from a primary care setting in Brazil. Primary Care Diabetes. 2014;8(1):71-76. doi: 10.1016/j.pcd.2013.04.003
- 25 Fermawi SA, Tolson JP, Knapp SM, Marrero D, Zhou W, Armstrong DG, et al. Disparities in preventative diabetic foot examination. Seminars in Vascular Surgery. 2023;36(1):84-89. doi: 10.1053/j.semvascsurg.2023.01.001
- 26 Cornwall MW, Warren M, Witty W. Association of Risk Factors with Receiving a Foot Check in People With Diabetes: NHANES 2013-2016. Primary Care Diabetes. 2021;15(1):126-131. doi: 10.1016/j.pcd.2020.07.005
- 27 Sohn MW, Kang H, Park JS, Yates P, McCall A, Stukenborg G, et al. Disparities in recommended preventive care usage among persons living with diabetes in the Appalachian region. BMJ Open Diab Res Care. 2016;4(1):e000284. doi: 10.1136/bmjdrc-2016-000284
- 28 Peraj E, Subhani MR, Jeong J, Vaknin OS, Twarog JP. Characteristics among adult patients with diabetes who received a foot exam by a health care provider in the past year: An analysis of NHANES 2011–2016. Primary Care Diabetes. 2019;13(3):242-246. doi: 10.1016/j.pcd.2018.11.004
- 29 Wittman JT, Bullard KM, Benoit SR. Trends in Preventive Care Services Among U.S. Adults With Diagnosed Diabetes, 2008–2020. Diabetes Care. 2023;46(12):2285-2291. doi: 10.2337/dc23-1119
- 30 Felix LG, Mendonça AEOD, Costa IKF, Oliveira SHDS, Almeida AMD, Soares MJGO. Knowledge of primary care nurses before and after educational intervention on diabetic foot. Rev Gaúcha Enferm. 2021;42:e20200452. doi: 10.1590/1983-1447.2021.20200452
- 31 Hadden K, Martin R, Prince L, Barnes CL. Patient Health Literacy and Diabetic Foot Amputations. The Journal of Foot and Ankle Surgery. 2019;58(5):877-879. doi: 10.1053/j.jfas.2018.12.038
- 32 Carvalho FCD, Bernal RTI, Perillo RD, Malta DC. Association between positive assessment of Primary Health Care, sociodemographic characteristics and comorbidities in Brazil. Rev bras epidemiol. 2022;25:e220023. doi: 10.1590/1980-549720220023
- 33 Ang GY, Yap CW, Saxena N. Effectiveness of Diabetes Foot Screening in Primary Care in Preventing Lower Extremity Amputations. Ann Acad Med Singap. 2017;46(11):417-423. doi: 10.47102/annals-acadmedsg.v46n11p417
- 34 Viswanathan V, Gupta A, Devarajan A, Kumpatla S, Shukla S, Agarwal S, et al. Early screening for foot problems in people with diabetes is the need of the hour: ‘Save the Feet and Keep Walking Campaign’ in India. BMJ Open Diab Res Care. 2024;12(4):e004064. doi: 10.1136/bmjdrc-2024-004064
- 35 Feter J, Feter N, Umpierre D. Racial health disparities: a population-based analysis of physical activity and diabetes-related complications in Brazil. Public Health. 2024;233:15-21. doi: 10.1016/j.puhe.2024.04.038
- 36 Robinson TE, Kenealy T, Garrett M, Bramley D, Drury PL, Elley CR. Ethnicity and risk of lower limb amputation in people with Type 2 diabetes: a prospective cohort study. Diabet Med. 2016;33(1):55-61. doi: 10.1111/dme.12807
- 37 Jose Teixeira Costa W, Pedrozo Campos Antunes T, Carlos de Abreu L, Lucas Souza Ramos J, Mende de Castro J, Batista Francalino da Rocha J, et al. Prevalência de pé diabético e seus fatores de risco no Estado do Espirito Santo, Brasil. jhgd. 2023;33(1):33-43. doi: 10.36311/jhgd.v33.14295
- 38 Carlesso GP, Gonçalves MHB, Moreschi Júnior D. Avaliação do conhecimento de pacientes diabéticos sobre medidas preventivas do pé diabético em Maringá (PR). J vasc bras. 2017;16(2):113-118. doi: 10.1590/1677-5449.006416
- 39 Holman N, Knighton P, OʼKeefe J, Wild SH, Brewster S, Price H, et al. Completion of annual diabetes care processes and mortality: A cohort study using the National Diabetes Audit for England and Wales. Diabetes Obesity Metabolism. 2021;23(12):2728-2740. doi: 10.1111/dom.14528
- 40 Lima LJLD, Lopes MR, Botelho Filho CADL, Cecon RS. Avaliação do autocuidado com os pés entre pacientes portadores de diabetes melito. J vasc bras. 2022;21:e20210011. doi: 10.1590/1677-5449.210011
Declarations
Funding
No financing
Conflict of interest
None
Authorship contributions
Drafting – original draft: Raydel Guerra-Chagime, Analía Ortigoza, Lucía Gerez.
Writing–review and editing: Raydel Guerra-Chagime, Analía Ortigoza, Lucía Gerez.