

Abstract
This research investigates the relationship between consumer experience and the emotional responses of technology shoppers in Tarapoto, Peru, in 2022. A correlational approach was used with a sample of 384 consumers. The results revealed a positive and significant correlation (r=0,763) between consumer experience and emotional responses. Consumer experience was found to be low (54 %), as were emotional responses (53 %). Four dimensions of consumer experience were analyzed: sensory, cognitive, lifestyle and interaction. All showed positive correlations with emotional responses, with coefficients ranging from 0,677 to 0,739. The sensory dimension was found to be low (51 %), as were cognitive (50 %), lifestyle (50 %) and interaction (52 %). The study concludes that there is a significant relationship between consumer experience and emotional responses in the context of technology purchases in Tarapoto. It is recommended that measures be implemented to improve the consumer experience, including the evaluation of sensory preferences, optimization of the consumer's mental experience, consideration of the customer's lifestyle, and improved interaction with customer service personnel. These actions could lead to more positive emotional responses, increased customer satisfaction and loyalty.
Keywords
Consumer Experience, Emotional Responses, Consumers, Technology Items
INTRODUCTION
Contemporary society, according to Olivar (1), poses a challenge for organizations and their marketing strategies, as these must be oriented toward generating favorable experiences in users so that their emotional responses lead to greater purchasing behavior, satisfaction, loyalty, and customer retention. According to the findings of Kim (2), prioritizing the consumer experience evidently makes consumers 89 % more connected with the organization, since positive experiences are created that reinforce users' loyalty and customer retention behaviors.
On the other hand, as indicated by Manthiou et al.(3), customers tend to experience a wide range of emotions during all interactions with a company when they search for, choose, and use its services and products. Consequently, the marketing strategy should aim to generate a favorable space for them, with the goal of creating customer satisfaction with the lived experience, since satisfaction is a function of positive and negative emotions and has the greatest impact on customers' repurchase intention, at 89%. As indicated by Anad (4), this, in turn, also generates positive emotions such as gratitude and happiness and promotes positive word of mouth.(5,6,7,8,9)
On the other hand, a study in Brazil by Alves (5) shows that the user experience is related to emotions with a significance equal to 0.000, which has an impact on the intention of the behavior and their satisfaction, creating a favorable emotional response after perceiving that their experience as consumers has been positive. In a study carried out in Ecuador by Iriarte et al.(6), it was evident that 77.8% of the employees indicated that they were satisfied with the perceived experience, which causes them to tend to recommend the organization to their family and friends, in addition to wanting to purchase the services again.(10,11,12,13,14)
In one study conducted in Peru by Valenzuela et al.(7), it was evidenced that approaching users generates favorable experiences in 87 %, where it is necessary to address customer safety and communication, and to orient the service toward better service quality and problem solving, which makes it possible to generate positive emotional responses in users. This agrees with what was proposed by Fernandez et al.(8), who evidenced that evoking positive and distinctive experiences in service delivery allows obtaining customer loyalty; consequently, organizations should focus on improving the courtesy, creativity, attention, and safety provided to the customer.(15,16,17,18,19,20)
In another study conducted in Huancayo by Ordoñez (9), it was evidenced that the designed sensory marketing strategy enables the creation of a positive stimulus in users, positively affecting their senses and emotions, which translates into a 57% increase in purchasing behavior. This generates differentiation among businesses, turning the organization into a market leader because it seeks to create positive experiences for consumers, and this impacts user satisfaction and their degree of loyalty; in turn, this positively influences word of mouth.(21,22,23,24,25)
Finally, regarding the local issue in the city of Tarapoto, through daily observation and conversations with various consumers of technology companies in this locality, it was possible to identify that these companies do not consider their clients' emotions when designing and offering their products or services; that is, their differentiation strategies do not generate a positive experience; most use the same colors for their brands; no attempt is made to create personalized service for the client; when communicating with them, the language used tends to be technical and does not connect with users' needs.(26,27,28,29,30)
This has led individuals to not identify with the brand, as they may not feel satisfied with the purchase experience, given that they report that when the language is too technical, they feel anxious, and this causes them to seek another alternative; in turn, this affects their confidence to acquire or buy the product; consequently, this does not allow for a positive emotional response; therefore, the present study is intended to be developed, and its purpose focuses on determining the relationship between consumer experience and the emotional responses of consumers of technological items in the city of Tarapoto, 2022.(31,32,33,34,35)
Conducting this research will make it possible to understand the problem to be addressed, thereby providing relevant and pertinent information for organizations and brands in the city of Tarapoto, as it will allow them to take actions that may affect their service provision; if this study is not conducted, consumers may not perceive organizations as sufficiently safe or trustworthy to meet their needs and make their purchases, which could also affect their market positioning.(36,37,38,39,40)
What is the relationship between consumer experience and the emotional responses of consumers of technological products in the city of Tarapoto, 2022?
Objective
To determine the relationship between consumer experience and the emotional responses of consumers of technological products in the city of Tarapoto, 2022.
METHODS
Scope and conditions of the research
Political location
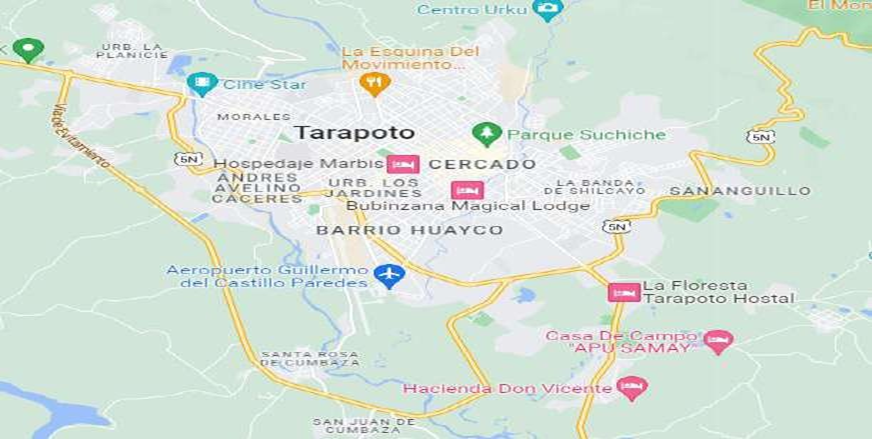
The research was conducted in the city of Tarapoto, located in the department of San Martin, in the northern region of the country, specifically in the high jungle, with Moyobamba as its capital city.
Geographic location
Tarapoto is positioned as the economic capital of the province of San Martin and is composed of three districts: Morales, Tarapoto, and Banda de Shilcayo.
Execution period
The research was conducted in 2022.
Authorizations and permissions:
No permissions were available.
Environmental control and biosafety protocols:
There was a lack of environmental control and biosafety protocols.
Application of international ethical principles:
To address this issue, ethical principles were consistently adhered to, including respect for intellectual property rights, ensuring due recognition of other authors' ideas through appropriate citations. In addition, respect for the autonomy of the participants was observed; they were not pressured to join the study but were instead offered the possibility of voluntary participation. At the same time, equal treatment was provided, ensuring that each family member was treated with due respect without discrimination.
Variable system
Independent Variable: consumer experience
Empirical variable 1: sensory dimension, visual incentives, and aesthetic pleasure
Empirical variable 2: cognitive dimension, customer thinking, and ideas and expectations
Empirical variable 3: lifestyle dimension, common values, and shared beliefs.
Empirical variable 4: interaction dimension, connection with the customer, communication with the customer, and shared beliefs.
Dependent variable: Emotional responses
Empirical variable 1: conscious responses, expression of happiness, sensation of satisfaction, and feeling of pleasure.
Empirical variable 2: unconscious responses, person with high anxiety, fear from past experiences, and insecurity in purchasing a product.
Abstract variable | Concrete variable | Recording medium | Unit of measure |
|---|---|---|---|
Sensory dimension | Customer thinking Ideas and expectations | Questionnaire | Ordinal |
Abstract variable | Abstract variable | Abstract variable | Abstract variable |
|---|---|---|---|
Cognitive dimension | Customer thinking Ideas and expectations | Questionnaire | Ordinal |
Abstract variable | Abstract variable | Abstract variable | Abstract variable |
|---|---|---|---|
Lifestyle dimension | Common values Shared beliefs | Cognitive dimension | Cognitive dimension |
Abstract variable | Abstract variable | Abstract variable | Abstract variable |
|---|---|---|---|
Interaction dimension | Connection with the customer Communication with the customer Shared beliefs | Cognitive dimension | Cognitive dimension |
Research Procedures
Type and level of research
The study conducted is of an applied nature. Furthermore, the research approach is at the correlational level, with the purpose of examining the interrelationships among the variables (Arias and Covinos, 2021). In accordance with the above, the study aims to collect data and determine whether the variables are related.
Population and sample
Population: It is defined as a group of people who share similar attributes and are considered relevant to the analysis in question (Hernández and Mendoza, 2018). Thus, the population will be composed of all consumers of Tarapoto. To determine the sample proportion, a method for an unknown population was used, and based on this, participants were randomly selected for their corresponding participation.
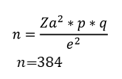
Where:
N = Sample size
Z = Statistical parameter associated with the confidence level
e = Maximum allowable estimation error
p = Probability that the investigated case occurs.
q = (1-p) Probability that the investigated case does not occur.
Sample: It is a subset that reflects the population and allows data to be extracted for analysis and generalization, as it has similar key orientations for the study. Accordingly, the sample consisted of 384 consumers from Tarapoto.
INCLUSION CRITERIA
Consumers of any age and sex.
Consumers located in the city of Tarapoto.
Consumers of technological products.
EXCLUSION CRITERIA
Consumers who refuse to be part of the study.
Consumers who do not agree to be part of the study.
Consumers who do not complete the questionnaires.
Informed consent was obtained from the participants, who were informed about the study and its benefits. Questionnaires were administered to collect information and create a database in Excel, which facilitated the generation of descriptive results with frequency tables. The data were transferred to the SPSS program version 26 to perform a normality analysis using the Kolmogorov-Smirnov test. A normal distribution was found, which allowed the Pearson test to be applied to evaluate relationships.
It is important to note that the Pearson correlation coefficient was measured based on the following information:
0.01 to 0.19 = Very low positive correlation
0.2 to 0.39 = Low positive correlation
0.4 to 0.69 = Moderate positive correlation
0.7 to 0.89 = High positive correlation
0.9 to 0.99 = Very high positive correlation
= Large and perfect positive correlation
RESULTS
Overall result
The general objective is to determine the relationship between consumer experience and the emotional responses of consumers of technological products in the city of Tarapoto, 2022. Accordingly, the Pearson correlation test was performed to determine the relationship between consumer experience and consumers' emotional responses.
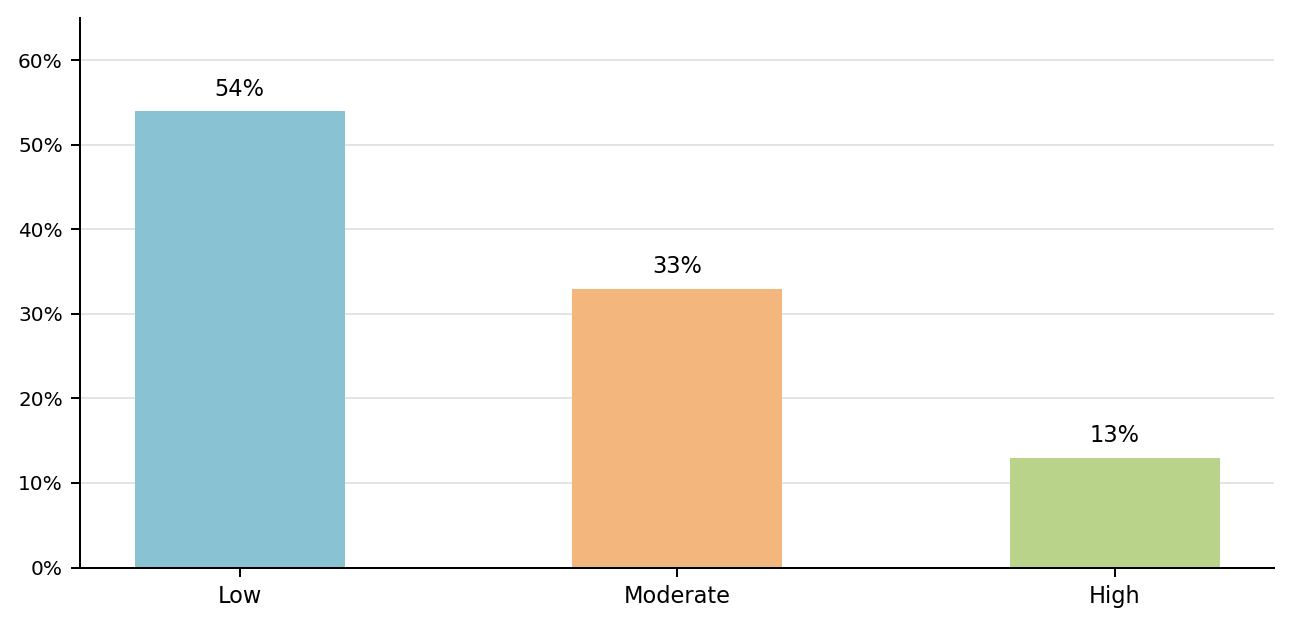
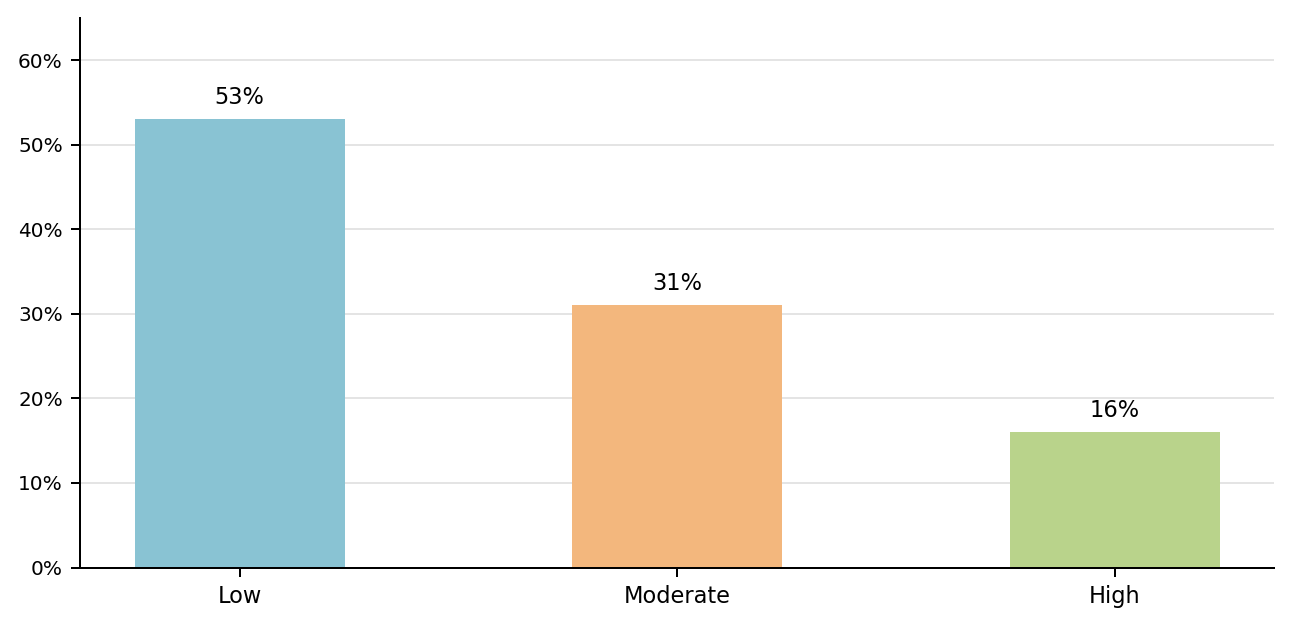
Table 5. General correlation test
Consumer experience | Emotional responses | ||
|---|---|---|---|
Consumer experience | Pearson correlation | 1 | 0.763** |
[empty cell] | Sig. (bilateral) | [empty cell] | 0,000 |
[empty cell] | N | 384 | 384 |
Emotional responses | Pearson correlation | 0.763** | 1 |
[empty cell] | Sig. (bilateral) | 0,000 | [empty cell] |
[empty cell] | N | 384 | 384 |
Interpretation
According to the data presented in Table 5, an important correlation between the variables is reported, since the significance value is high. The result obtained is 0.000, with a correlation of 0.763, which conclusively demonstrates that there is a positive and significant correlation between consumer experience and the emotional responses of consumers of technological products in the city of Tarapoto, 2022.
The consumer experience variable is at a low level in 54%, with 33 out of 100 at a regular level, and only 13% at a high level; likewise, in Figure 3, the emotional responses variable is at a high level in 53%, 31% is at a regular level, and 16% is at a high level.
Specific result 1
Specific objective 1: to determine the relationship between the sensory dimension and the emotional responses of consumers of technological products in the city of Tarapoto, 2022.
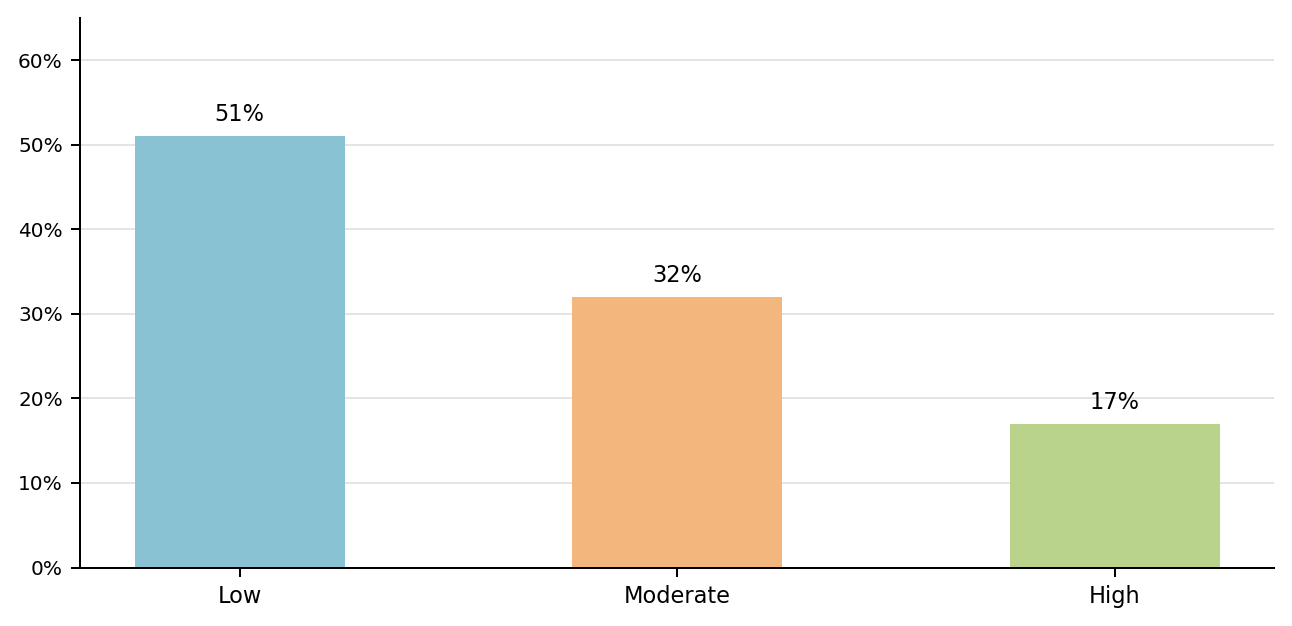
Table 6. Specific correlation test 1
Sensory dimension | Emotional responses | ||
|---|---|---|---|
Sensory dimension | Pearson correlation | 1 | 0.722** |
[empty cell] | Sig. (bilateral) | [empty cell] | 0.000 |
[empty cell] | N | 384 | 384 |
Emotional responses | Pearson correlation | 0.722** | 1 |
[empty cell] | Sig. (bilateral) | 0.000 | [empty cell] |
[empty cell] | N | 384 | 384 |
Interpretation
A significant correlation was found between the sensory dimension and emotional responses based on the presented results, due to the significance value obtained. The result obtained from the study is 0.000, with a coefficient value of 0.722, clearly demonstrating a positive and significant relationship between the sensory dimension and the emotional responses of consumers of technological products in the city of Tarapoto, 2022.
The sensory dimension is at a low level in 51%, at a regular level in 32%, and only 17% is at a high level.
Specific result 2
Specific objective 2: to determine the relationship between the cognitive dimension and the emotional responses of consumers of technological products in the city of Tarapoto, 2022.
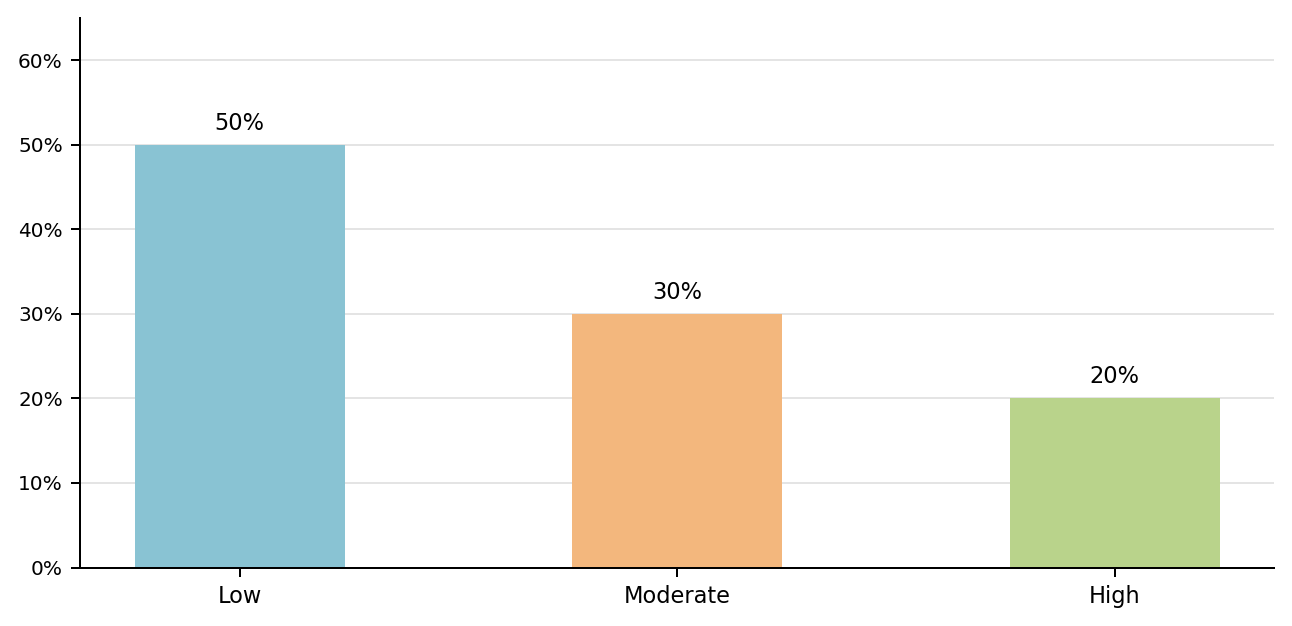
Table 7. Specific correlation test 2
Cognitive dimension | Emotional responses | ||
|---|---|---|---|
Cognitive dimension | Pearson correlation | 1 | 0.677** |
[empty cell] | Sig. (bilateral) | [empty cell] | 0.000 |
[empty cell] | N | 384 | 384 |
Emotional responses | Pearson correlation | 0.677** | 1 |
[empty cell] | Sig. (bilateral) | 0.000 | [empty cell] |
[empty cell] | N | 384 | 384 |
Interpretation
The data presented clearly indicate an important connection between the cognitive dimension and emotional responses, since the value obtained provides evidence of this significant relationship. The result obtained is 0.000, with a coefficient value of 0.677, conclusively demonstrating a positive and significant relationship between the cognitive dimension and the emotional responses of consumers of technological products in the city of Tarapoto, 2022.
The cognitive dimension is at a low level in 50 out of 100; on the other hand, 30% report that it is at a regular level, and only 20% is at a low level.
Specific result 3
Specific objective 3: to determine the relationship between the lifestyle dimension and the emotional responses of consumers of technological products in the city of Tarapoto, 2022.
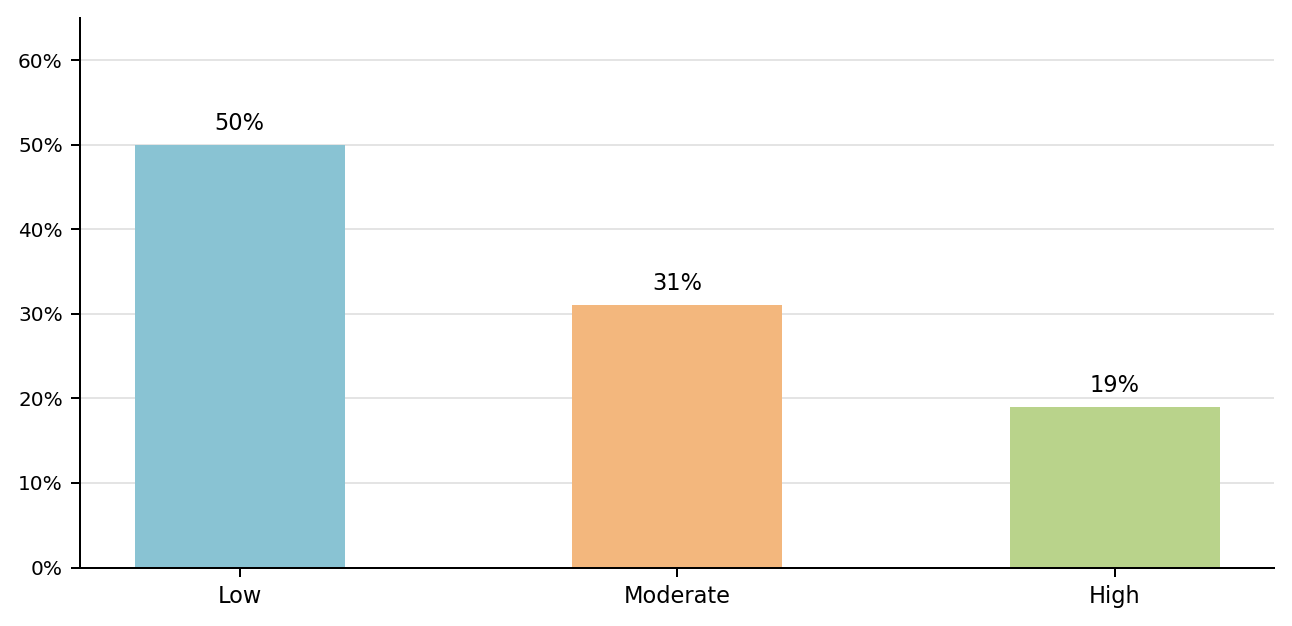
Table 8. Specific correlation test 3
Lifestyle dimension | Emotional responses | ||
|---|---|---|---|
Lifestyle dimension | Pearson correlation | 1 | 0.705** |
[empty cell] | Sig. (bilateral) | [empty cell] | 0,000 |
[empty cell] | N | 384 | 384 |
Emotional responses | Pearson correlation | 0.705** | 1 |
[empty cell] | Sig. (bilateral) | 0,000 | [empty cell] |
[empty cell] | N | 384 | 384 |
Interpretation
The data given in Table 8 clearly show a statistically relevant correlation between the lifestyle dimension and emotional responses, as indicated by the significance value. The result obtained shows a value of 0.000, with a coefficient of 0.705, which conclusively indicates a positive and significant relationship between the lifestyle dimension and the emotional responses of consumers of technological products in the city of Tarapoto, 2022.
The lifestyle dimension is at a low level in 50%, whereas it is at a regular level in 31%, and only 19% is at a high level.
Specific result 4
Specific objective 4: to determine the relationship between the interaction dimension and the emotional responses of consumers of technological products in the city of Tarapoto, 2022.
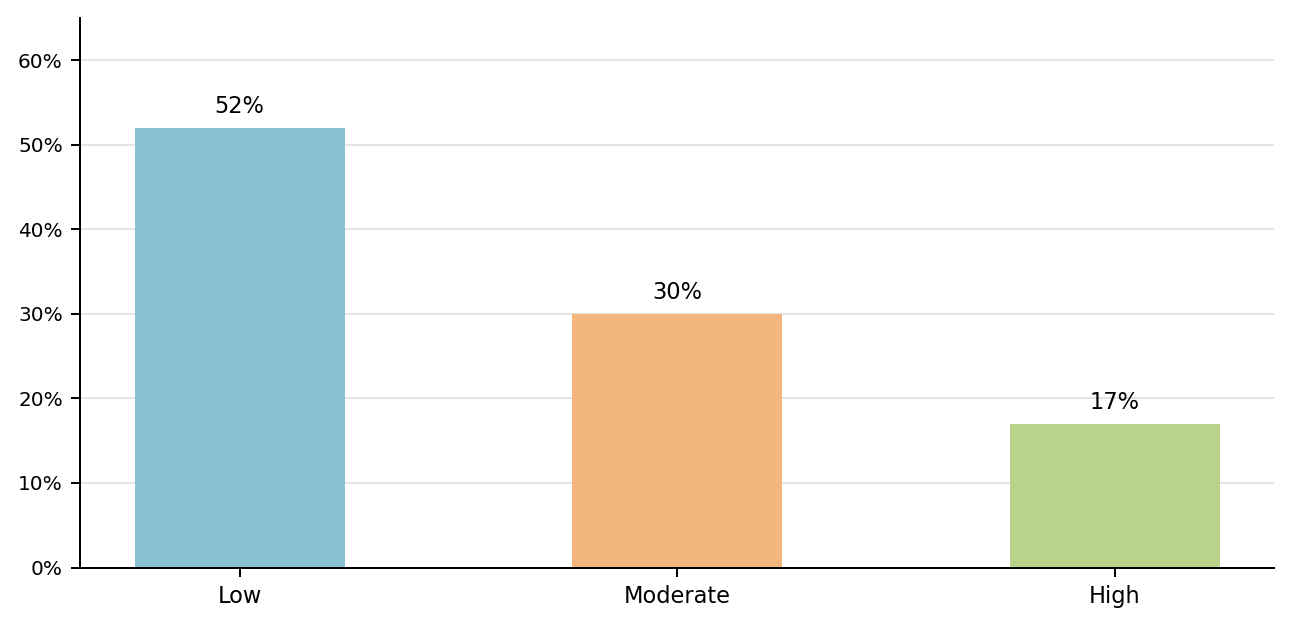
Table 9. Specific correlation test 4.
Interaction dimension | Emotional responses | ||
|---|---|---|---|
Interaction dimension | Pearson correlation | 1 | 0.739** |
[empty cell] | Sig. (bilateral) | [empty cell] | 0,000 |
[empty cell] | N | 384 | 384 |
Emotional responses | Pearson correlation | 0.739** | 1 |
[empty cell] | Sig. (bilateral) | 0,000 | [empty cell] |
[empty cell] | N | 384 | 384 |
Interpretation
The findings presented in Table 9 conclusively indicate an important association between the interaction dimension and the emotional responses variable, since the value obtained is significant. The result shows a value of 0.000, with a correlation coefficient of 0.739, indicating a positive and significant relationship between the interaction dimension and the emotional responses of consumers of technological products in the city of Tarapoto, 2022.
Figure 7 shows that the interaction dimension is at a low level for 52%, at a regular level for 30%, and at a high level for 17%.
DISCUSSION
Next, the data and findings that emerged in the current research are analyzed and discussed, comparing them with the findings of previous researchers.
Regarding the results obtained for the general objective, it is necessary to emphasize that the relationship between the study variables is moderate, yielding 0.763; this indicates acceptance of the research hypothesis. When compared with Vallejo et al. (10), their research concluded that the experience perceived by the client involves a perception of his or her emotional response and of how he or she perceives the organization (41,42,43,44,45).
Regarding the results obtained where the relationship between the interaction dimension and the emotional responses variable is measured, a direct, significant, and high relationship is shown, since the correlation coefficient is 0.739; this demonstrates acceptance of the hypothesis. These results are compared with Cárdenas (11), a study that concluded that customer service has a positive effect on the degree of customer loyalty, with a p value equal to 0.000 and an r = 0.833; in this sense, the better the customer service, the more the emotional response translates into loyalty, since if good interaction with customers is achieved, this can generate greater satisfaction and consumer loyalty toward the brand, as well as corporate reputation (46,47,48,49).
CONCLUSIONS
Consumer experience is significantly related to the emotional responses of consumers of technology products in the city of Tarapoto, 2022. Regarding the consumer experience variable, customers stated that it is at a low level with 54%, while the emotional responses variable is at the same level as the previous variable, but at 53%.
It is confirmed that the sensory dimension influences consumers' emotional responses, and the proposed hypothesis is accepted. This demonstrates that the dimension is at 51%.
A strong and favorable association between buyers' cognitive perception and emotional reactions is confirmed, supporting the proposed theory and indicating a low level of 50% in their behavior.
It is concluded that the lifestyle dimension and emotional responses have a positive and high relationship; therefore, the proposed research hypothesis is accepted. Regarding this dimension, its behavior is at a low level with 50%.
Consequently, a direct and positive correlation was found between interaction and the emotional responses of technology consumers in Tarapoto in 2022, with a correlation of 52%.
RECOMMENDATIONS
It is recommended that instruments be implemented to measure satisfaction with the consumer experience in order to maintain the high level, since good satisfaction will mean that consumers do not wish to switch to other companies that offer the same thing; ultimately, this generates customer satisfaction and loyalty, which can last a long time as long as there are no repeated purchase failures; moreover, it has a direct effect on customer loyalty, and a positive experience also has a favorable effect on the creation of customer commitment.
It is recommended to evaluate and optimize sensory preferences and to design products and services that meet their needs, since a good sensory experience can increase the perception of product quality, which can lead consumers to be willing to pay more for products.
It is recommended that the consumer's mental experience be influenced through advertising, prior experiences, and brand perception, since consumers may use different criteria to evaluate the value and benefits of a product, and companies must strive to understand them in order to design products and services that meet their needs.
It is recommended to evaluate the relationship involving consumer lifestyle, since consumers have different lifestyles; organizations must emphasize understanding them in order to design products and services that fit their needs.
It is recommended that personnel be constantly trained in customer service, including aspects such as accessibility, service quality, personalized attention, and problem-solving, since consumers expect a high level of service when interacting with a company, from the moment they seek information until post-sale; furthermore, service quality and customer service can be considered key factors in consumer satisfaction and loyalty toward the brand, to which organizations must pay special attention.
References
- 1 Olivar N. El neuromarketing: fundamentos, técnicas, ventajas y limitaciones. Rev Acad Negoc. 2022;9(1):13-28. https://revistas.udec.cl/index.php/ran/article/view/9595/9360
- 2 Kim Y, Sullivan P. Emotional branding speaks to consumers' heart: the case of fashion brands. Fashion Text. 2019;6(2). https://fashionandtextiles.springeropen.com/articles/10.1186/s40691-018-0164-y
- 3 Manthiou A, Hickman E, Klaus P. Beyond good and bad: challenging the suggested role of emotions in customer experience (CX) research. J Retail Consum Serv. 2020;57. https://www.sciencedirect.com/science/article/pii/S0969698920310973
- 4 Anad I, Gaur S. Consequences of consumers' emotional responses to government's green initiatives: insights from a scenario-based experimental study. Manag Environ Qual. 2019;30(1). https://www.emerald.com/insight/content/doi/10.1108/MEQ-02-2018-0045/full/html
- 5 Alves C, Barcellos R. Hospitalidad, emociones y experiencias en los servicios turísticos. Estud Perspect Tur. 2019;28(2). http://www.scielo.org.ar/scielo.php?pid=S1851-17322019000200003&script=sci_arttext&tlng=es
- 6 Iriarte E, Hidalgo M, Lemoine F, Carvajal G. Estrategias del marketing experiencial para revolucionar el posicionamiento de empresas hoteleras. Anuario Fac Cienc Econ Empres. 2020;2:154-163. https://anuarioeco.uo.edu.cu/index.php/aeco/article/view/5161/4652
- 7 Valenzuela B, Cordova J, Schmitt B. Experiencia del cliente y emociones: conociendo su aplicación en soluciones digitales de taxis. CLADEA Conf. 2020. https://www.researchgate.net/publication/347535363_Experiencia_del_Cliente_y_Emociones_Conociendo_su_aplicacion_en_soluciones_digitales_de_taxis
- 8 Fernández V, Baldarraga J, Parades S. Marketing experiencial y lealtad de clientes de una cadena de tiendas retail ubicada en Lima. Rev Espiritu Emprendedor TES. 2020. https://www.espirituemprendedortes.com/index.php/revista/article/view/173/200
- 9 Ordoñez J, Ordoñez S, Ledesma M. Marketing sensorial y su relación con la calidad de atención al cliente en una empresa familiar. Ciencia Latina Rev Cient Multidiscip. 2023;7(1):9277-9289. https://ciencialatina.org/index.php/cienciala/article/view/5120
- 10 Vallejo A, Lagunez M, Vasquez S. Experiencia del cliente, confianza y lealtad de los millennials en el sector bancario de la ciudad de Cuenca-Ecuador. Rev Cienc Adm Econ. 2021;11(22):287-300. https://doi.org/10.17163/ret.n22.2021.06
- 11 Cárdenas J, Chota M. La atención al cliente y su influencia en la fidelización de los clientes en la Sede Central de la Farmacia San José, en el distrito de Tarapoto, año 2017. Tarapoto: Universidad Nacional San Martín; 2019. https://repositorio.unsm.edu.pe/bitstream/11458/3928/4/ADMINISTRACIÓN%20-%20Jerika%20Jimena%20Cárdenas%20Macedo%20%26%20Magaly%20Chota%20Alegría.pdf
- 12 Alsharif AA, Salleh N, Baharun R, Yusoff M. Consumer behaviour through neuromarketing approach. J Contemp Issues Bus Gov. 2021;27(3). doi:10.47750/cibg.2021.27.03.048
- 13 Ameen N, Tarhini A, Reppel A, Anad A. Customer experiences in the age of artificial intelligence. Comput Human Behav. 2021;114. https://www.sciencedirect.com/science/article/pii/S0747563220302983
- 14 Andervazh L, Albonaiemi E, Zarbazoo M. Effect of using social media on word of mouth advertising for tourism industry. Utopía Prax Latinoam. 2020;25(6). doi:10.5281/zenodo.3987605
- 15 Arias J, Covinos M. Diseño y metodología de la investigación. 1ª ed. Perú: Enfoques Consulting EIRL; 2021.
- 16 Baimyrzaeva M. Beginners' guide for applied research process: what is it, and why and how to do it? Occasional Paper. 2018;(4). https://www.ucentralasia.org/Content/Downloads/UCA-IPPA-OP4-Beginners%20Guide%20for%20Applied%20Research%20Process-Eng.pdf
- 17 Basias N, Pollalis Y. Quantitative and qualitative research in business & technology: justifying a suitable research methodology. Rev Integr Bus Econ Res. 2018;7:91-105. https://sibresearch.org/uploads/3/4/0/9/34097180/riber_7-s1_sp_h17-083_91-105.pdf
- 18 Becker L, Jaakkola E. Customer experience: fundamental premises and implications for research. J Acad Mark Sci. 2020;48:630–648. doi:10.1007/s11747-019-00718-x
- 19 Bettiga D, Bianchi A, Lamberti L, Noci G. Consumers' emotional responses to functional and hedonic products: a neuroscience research. Front Psychol. 2020;11. doi:10.3389/fpsyg.2020.559779
- 20 Cardello A, Meiselman H. Contextual influences on consumer responses to food products. En: Methods in consumer research. Duxford: Woodhead Publishing; 2018. p. 3-67.
- 21 Cortez M. Influencia del branding emocional en la fidelización de clientes de la generación Y de una entidad financiera en Lima. Lima: Universidad San Ignacio de Loyola; 2021. https://repositorio.usil.edu.pe/server/api/core/bitstreams/c599de58-8df0-4642-87ce-0db6812884bd/content
- 22 Duygun A, Şen E. Evaluation of consumer purchasing behaviors in the COVID-19 pandemic period in the context of Maslow's hierarchy of needs. Teorisi ve Uygulamaları Dergisi. 2020;6(1):45-68. https://www.betadergi.com/patu/yonetim/icerik/makaleler/71-published.pdf
- 23 Fatmawati I, Fauzan N. Building customer trust through corporate social responsibility: the effects of corporate reputation and word of mouth. J Asian Finance Econ Bus. 2021;8(3).
- 24 Gallart V, Callarisa L, Sánchez J. Influencia del compromiso y de la experiencia del consumidor en la creación de valor de marca del comercio detallista. GCG LALP Georgetown Univ. 2021;26(2). doi:10.3232/GCG.2022.V16.N2.04
- 25 Gupta S. Global customer engagement. J Int Mark. 2018;26(1):4-29. doi:10.1509/jim.17.0091
- 26 Havíř D. A comparison of the approaches to customer experience analysis. Econ Bus. 2017;31(1):82–93. https://content.sciendo.com/downloadpdf/journals/eb/31/1/article-p82.pdf
- 27 Hernández R, Mendoza C. Metodología de la investigación: las rutas cuantitativa, cualitativa y mixta. México D.F.: McGraw Hill Education; 2018.
- 28 Jain S, Khurana N, Tanwar D. An empirical study on role of consumer's need hierarchy in choice of cognitive biases to be used in marketing. Int J Bus Manag Invention. 2019;8(8). https://www.ijbmi.org/papers/Vol (8)8/Series-1/J0808016874.pdf
- 29 Jaiswal S, Singh A. Influence of the determinants of online customer experience on online customer satisfaction. Paradigm. 2020;24(1):41-55. https://doi.org/10.1177/0971890720914121
- 30 Japutra A, Utami A, Molinillo S, Ekaputra I. Influence of customer application experience and value in use on loyalty toward retailers. J Retail Consum Serv. 2020;102390. https://doi.org/10.1016/j.jretconser.2020.102390
- 31 Kim S, Hong J. The effects of contexts on consumer emotions and acceptance of a domestic food and an unfamiliar ethnic food: a cross-cultural comparison between Chinese and Korean consumers. Food Sci Biotechnol. 2020;29(12):1705-1718. https://www.ncbi.nlm.nih.gov/pmc/articles/PMC7708593/
- 32 Mazza J, De Lamonica O, Almeida E, Andrade J. Factors affecting satisfaction. Rev Gestao. 2020;27(3):211-228. https://www.emerald.com/insight/content/doi/10.1108/REGE-02-2018-0037/full/pdf
- 33 Merdiaty N, Aldrin N. Effect of brand experience on customer engagement through quality services of online sellers to students in Bekasi. Front Psychol. 2022;12:801439. https://www.frontiersin.org/articles/10.3389/fpsyg.2021.801439/full
- 34 Montag C, Sindermann C, Lester D, Davis K. Linking individual differences in satisfaction with each of Maslow's needs to the Big Five personality traits and Panksepp's primary emotional systems. Heliyon. 2020;6(7):e04325. https://www.ncbi.nlm.nih.gov/pmc/articles/PMC7387820/
- 35 Naini N, Santoso S, Andriani T, Nurfadillah U. The effect of product quality, service quality, customer satisfaction on customer loyalty. J Consum Sci. 2022;7(1):34-50. https://doi.org/10.29244/jcs.7.1.34-50
- 36 Nguyen D, Pham V, Tran D, Pham D. Impact of service quality, customer satisfaction, and switching costs on customer loyalty. J Asian Finance Econ Bus. 2020;7(8):395-405. https://doi.org/10.13106/jafeb.2020.vol7.no8.395
- 37 Palma X, Arteaga R, Ponce J. El marketing sensorial y su influencia en el comportamiento de compra de los consumidores de la ciudad de Manta, Ecuador. Dominio Cienc. 2018;4(145). https://www.dominiodelasciencias.com/ojs/index.php/es/article/download/828/html
- 38 Patel M, Patel N. Exploring research methodology: review article. Int J Res Rev. 2019;6(3):48-55. https://www.academia.edu/download/63543152/IJRR001120200605-115829-bxlrli.pdf
- 39 Punniyamoorthy R, Arulmoli R. Brand connecting with people in the aspect of emotional advertising towards societal benefits and awareness. Int J Innov Technol Explor Eng. 2019;8(7). https://www.ijitee.org/wp-content/uploads/papers/v8i7c2/G10670587C219.pdf
- 40 Reyna S. Influencia del marketing emocional en el comportamiento de los consumidores. Universidad Privada Antenor Orrego. 2021. https://hdl.handle.net/20.500.12759/7454
- 41 Sánchez M. Influencia del nuevo modelo de atención "Imagine" en la satisfacción de los clientes del Banco Continental sede Tarapoto, durante el año 2018. Universidad Nacional de San Martín. 2019. https://repositorio.unsm.edu.pe/handle/11458/3782
- 42 Santamaría C. Marketing emocional y lealtad del cliente en el restaurante-pollería La Concha Acústica Lambayeque-2018. Universidad Señor del Sipán. 2019. https://repositorio.uss.edu.pe/bitstream/handle/20.500.12802/6047/Santamar%C3%ADa%20Farro%20Christian%20David.pdf
- 43 Schreiner M, Fischer T, Riedl R. Impact of content characteristics and emotion on behavioral engagement in social media: literature review and research agenda. Electron Commer Res. 2021;21:329-345. https://link.springer.com/article/10.1007/s10660-019-09353-8
- 44 Setiawan K, Ardini G. The role of positive emotions to increase the effect of store atmosphere and discount on impulse buying. Eur J Bus Manag Res. 2022;7(1). http://dx.doi.org/10.24018/ejbmr.2022.7.1.1236
- 45 Shanahan T, Tran T, Taylor E. Getting to know you: social media personalization as a means of enhancing brand loyalty and perceived quality. J Retail Consum Serv. 2019;47:57-65. https://www.sciencedirect.com/science/article/abs/pii/S0969698918300055
- 46 To T, Du Kim D, Bui L, Pham H. Factors affecting customer satisfaction when buying on Facebook in Vietnam. J Asian Finance Econ Bus. 2020;7(10):267-273. https://doi.org/10.13106/jafeb.2020.vol7.no10.267
- 47 Ushiñahua M. Marketing de servicio y su relación con el comportamiento del consumidor de los restaurantes, bares y cantinas del distrito de Tarapoto en el año 2017. Universidad Nacional de San Martín. 2019. https://repositorio.unsm.edu.pe/handle/11458/3792
- 48 Wang M, Sun L, Hou J. How emotional interaction affects purchase intention in social commerce: the role of perceived usefulness and product type. Psychol Res Behav Manag. 2021;14:467-481. https://www.dovepress.com/how-emotional-interaction-affects-purchaseintention-in-social-commerc-peer-reviewed-fulltext-article-PRBM
- 49 Zablocki A, Makri K, Houston M. Emotions within online reviews and their influence on product attitudes in Austria, USA and Thailand. J Interact Mark. 2022;46(1). https://journals.sagepub.com/doi/abs/10.1016/j.intmar
Declarations
Funding
None.
Conflict of interest
The authors declare that there is no conflict of interest.
Authorship contributions
Conceptualization: Estefani Alexandra Chavez Flores, Caroll Eugenia Valles Navarro, Lady Diana Arévalo Alva.
Data curation: Estefani Alexandra Chavez Flores, Caroll Eugenia Valles Navarro, Lady Diana Arévalo Alva.
Formal analysis: Estefani Alexandra Chavez Flores, Caroll Eugenia Valles Navarro, Lady Diana Arévalo Alva.
Writing – original draft: Estefani Alexandra Chavez Flores, Caroll Eugenia Valles Navarro, Lady Diana Arévalo Alva.
Writing – review and editing: Estefani Alexandra Chavez Flores, Caroll Eugenia Valles Navarro, Lady Diana Arévalo Alva.