

Abstract
Introduction: Amblyopia, as a neurological disease, is the result of abnormal stimulation of the brain during a critical period of visual development. This is the main etiology of reduced spatial vision during childhood, historically caused by strabismus, depravation, and anisometropia. Objective: the objective of this research was the diagnosis and management of amblyopia in school children in Aragua, Venezuela in 2024. Method: a cross-sectional descriptive study was carried out with a sample of 69 primary school students, with an average age of 8 years. Socio-demographic data, history of visual pathologies, use of optical correction, clinical typicity, warning signs and visual acuity were collected using optotypes and the JAEGER near vision card. In addition, monocular therapeutic techniques were applied to children with amblyopia. Results: showed that 81 % of the students denied having a history of visual pathologies, while 15 % reported myopia and 4 % hyperopia. 91 % did not use optical correction. Regarding clinical typicity, 87 % did not present signs or symptoms of amblyopia, and 90 % showed no warning signs. The visual acuity assessment revealed that 83 % of the students had a visual acuity of 20/20 in both eyes, and 90 % had a close visual acuity of 1+ in both eyes. After refractive correction, 9 % reached 20/20 in both eyes, and after treatment, 91,30 % did not require additional follow-up. The applied monocular therapeutic techniques showed a significant improvement in the visual acuity of the amblyopic eye. Conclusion: it is concluded that most of the students presented a normal visual acuity after treatment, which indicates the effectiveness of the monocular therapeutic techniques applied. The low prevalence of optical correction uses and the lack of signs and symptoms in most students suggest a need for greater awareness and education about visual pathologies in the school population.
Keywords
Amblyopia, Visual Acuity, School-Aged Children
INTRODUCTION
Visual acuity (VA) is the ability to discern between two points that are close in space and separated from each other by a given angle, i.e., it is the ability of humans to perceive details or the point of best visual specificity at a given distance.(1) Amblyopia is an easily detectable condition that can be treated during visual development. Amblyopia is a condition that is easy to detect, can be treated during visual development, and, if left untreated, can increase the risk of blindness, with its consequences and complications in all areas of life.
Amblyopia is one of the leading causes of decreased visual acuity in children and is generally asymptomatic.(2) Reports presented by the World Health Organisation have ratified the increase in visual pathologies, and it is essential to highlight that in middle and low-income countries, access to ophthalmological care has been limited, leading to a rise in the number of people with visual impairment.(3,4)
The visual pathway has an innate development as the years go by, making the central nervous system perceptive to visual stimuli. Due to this, the structural and functional changes caused by abnormal visual development must be corrected while this pathway still has plasticity, i.e., before the age of 8 to 10 years; hence, the importance of an early diagnosis of amblyopia, as this will generate a significant gap so that this pathology can be reversed through the application of specialized treatments. Several international studies propose as conventional treatment the application of monocular techniques that promote stimulation of the ‘lazy eye’ using physical and pharmacological occlusion with an adhesive eye patch and atropine drops in the eye with the best visual acuity.(5,6)
School-age children with vision problems, which are not adequately treated, can affect their ability to learn, personality, and adaptation to school. In children, it causes pathological effects, which is why early intervention is necessary, as it not only represents this physical problem but also because of the difficulties it presents in the environment around them, the consequences of which can have repercussions not only on their social environment but also on their school and family. It is a condition that is easy to detect and can be treated during visual development, and if it is not treated, there is a greater risk of blindness. Parents, relatives, teachers, and school staff do not have any information on visual pathologies that can help the child's health.(7)
Studies confirm that amblyopia can affect 2 to 3 out of every 100 children, whose number would be reduced if they received timely treatment. The prevalence of this pathology globally is between 2 and 4 %, being one of the most essential aetiologies in reducing visual acuity in children and young people. Patients are predominantly between 6 and 9 years of age, male, and without a family history of ocular pathology; the most affected visual acuity was moderate amblyopia, which is associated with compound myopic astigmatism as the most frequent refractive defect.(3)
Updated literature also shows that visual acuity can improve in the amblyopic eye after 16 weeks of treatment and maintains that conventional therapies continue to meet the therapeutic goal.(8)
In Venezuela today, traditional methods are still used for monocular therapeutic management of amblyopia. There are no specific guidelines for the management of this pathology, which is why the objective of this research is to generate an amblyopic protocol for the diagnosis and management of amblyopia in schoolchildren in Aragua, Venezuela, in the year 2024.
METHOD
The present study was framed in the biomedical, clinical, observational, analytical, prospective, field, and longitudinal models. Qualified and structured information was obtained on amblyopia and its evolution after the implementation of therapeutic techniques.
The population consisted of students from 1st to 4th grade of a private educational unit in Aragua, Girardot Municipality, who presented changes in the subjective visual acuity of amblyopia.
A sample was selected through a non-probabilistic purposive sampling, including those students and representatives who voluntarily consented to participate in the study, male or female, aged 2-10 years, with or without clinical and subjective visual acuity of amblyopia, with or without previous history of visual pathologies, with or without the use of optical correction therapy. Exclusion criteria were considered to be all those under six and over 10 years of age, demonstrating visual acuity within normal parameters.
The data were analyzed using descriptive statistical techniques using frequency tables in Microsoft Excel 2016 and statistical packages EPI INFO Version 7.5.2.0 and SPPS Version 15. Descriptive statistical methods were used, using frequency tables and Percentages (%) with a confidence interval of 95 %.
RESULTS
Of the sample studied, it was found that the predominant age of the children was 7 years old, represented by 21 (30 %) of school age, CI= 19,92 - 42,69, the vast majority of whom were female, 36 (52 %), CI= 39,80 - 64,35, and 25 (36 %) of whom were in the second grade, CI= 24,99 - 48,69. It is important to note that the average age was 8 years, SD= 1,34, being a heterogeneous sample, the most repeated age was 7 years, the minimum age of the sample studied was 6 years, and the maximum was 10 years (table 1).
Descriptive for age | Descriptive for age | Descriptive for age | Descriptive for age | Descriptive for age | Descriptive for age |
|---|---|---|---|---|---|
X̅ | DE | M | MIN | [empty cell] | MAX |
8 | 1,34 | 7 | 6 | [empty cell] | 10 |
Variables | f(a) | fr(%) | fr(%) | IC 95 % | IC 95 % |
Variables | n= 69 | fr(%) | fr(%) | IC 95 % | IC 95 % |
Age/years | [empty cell] | [empty cell] | [empty cell] | [empty cell] | [empty cell] |
6 | 13 | 19,00 | 19,00 | 10,43 – 30,06 | 10,43 – 30,06 |
7 | 21 | 30,00 | 30,00 | 19,92 – 42,69 | 19,92 – 42,69 |
8 | 14 | 20,00 | 20,00 | 11,56 – 31,69 | 11,56 – 31,69 |
9 | 10 | 15,00 | 15,00 | 7,17 – 25,04 | 7,17 – 25,04 |
10 | 11 | 16,00 | 16,00 | 8,24 – 26,74 | 8,24 – 26,74 |
Sex | [empty cell] | [empty cell] | [empty cell] | [empty cell] | [empty cell] |
Female | 36 | 52,00 | 52,00 | 39,80 – 64,35 | 39,80 – 64,35 |
Male | 33 | 38,00 | 38,00 | 35,65 - 60,20 | 35,65 - 60,20 |
Educational level | [empty cell] | [empty cell] | [empty cell] | [empty cell] | [empty cell] |
1er. Grade | 21 | 30,00 | 30,00 | 19,92 – 42,69 | 19,92 – 42,69 |
2do. Grade | 25 | 36,00 | 36,00 | 24,99 – 48,69 | 24,99 – 48,69 |
3er. Grade | 8 | 12,00 | 12,00 | 5,14 - 21,57 | 5,14 - 21,57 |
4to. Grade | 15 | 22,00 | 22,00 | 12,71 – 33,31 | 12,71 – 33,31 |
Note: 95 % CI= Confidence Interval at 95 % probability, X̅= Mean age, M= Mode, SD= Standard deviation, Min= Min, Max= Max, f(a)= Absolute frequency, f® %= Relative frequency, f® %= Relative frequency. | Note: 95 % CI= Confidence Interval at 95 % probability, X̅= Mean age, M= Mode, SD= Standard deviation, Min= Min, Max= Max, f(a)= Absolute frequency, f® %= Relative frequency, f® %= Relative frequency. | Note: 95 % CI= Confidence Interval at 95 % probability, X̅= Mean age, M= Mode, SD= Standard deviation, Min= Min, Max= Max, f(a)= Absolute frequency, f® %= Relative frequency, f® %= Relative frequency. | Note: 95 % CI= Confidence Interval at 95 % probability, X̅= Mean age, M= Mode, SD= Standard deviation, Min= Min, Max= Max, f(a)= Absolute frequency, f® %= Relative frequency, f® %= Relative frequency. | Note: 95 % CI= Confidence Interval at 95 % probability, X̅= Mean age, M= Mode, SD= Standard deviation, Min= Min, Max= Max, f(a)= Absolute frequency, f® %= Relative frequency, f® %= Relative frequency. | Note: 95 % CI= Confidence Interval at 95 % probability, X̅= Mean age, M= Mode, SD= Standard deviation, Min= Min, Max= Max, f(a)= Absolute frequency, f® %= Relative frequency, f® %= Relative frequency. |
Regarding the history of visual pathology, the majority of students had no significant history. Of the 69 participants, only three students (4,00 %, 95 % CI: 0,91 - 12,18) reported a history of farsightedness, while 10 students (15,00 %, 95 % CI: 6,14 - 23,32) had a history of myopia. The vast majority, 56 students (81,00 %, 95 % CI: 69,94 - 89,57), denied having any previous visual pathology.
About the use of optical correction, many students were found not to use any correction. Specifically, 63 students (91,00 %, 95 % CI: 82,03 - 96,74) did not use optical correction, while only six students (9,00 %, 95 % CI: 3,26 - 17,97) reported using any optical correction (table 2).
Variables | f(a) n= 69 | fr(%) | fr(%) | IC 95 % | IC 95 % |
|---|---|---|---|---|---|
Visual pathological history | [empty cell] | [empty cell] | [empty cell] | Li - Ls | Li - Ls |
Farsightedness | 3 | 4,00 | 4,00 | 0,91 12,18 | 0,91 12,18 |
Myopia | 10 | 15,00 | 15,00 | 6,14 23,32 | 6,14 23,32 |
Deny | 56 | 81,00 | 81,00 | 69,94 89,57 | 69,94 89,57 |
Use of optical correction | [empty cell] | [empty cell] | [empty cell] | [empty cell] | [empty cell] |
No | 63 | 63 | 91,00 | 91,00 | 82,03 96,74 |
yes | 6 | 6 | 9,00 | 9,00 | 3,26 17,97 |
In terms of clinical typicality, it was observed that most students did not present signs and symptoms of amblyopia. Of the 69 participants, only two students (3,00 %, 95 % CI: 0,35 - 10,08) reported asthenopia, four students (6,00 %, 95 % CI: 1,60 - 14,18) presented with headaches, and three students (4,00 %, 95 % CI: 0,91 - 12,18) showed signs of deprivation. The vast majority, 60 students (87,00 %, 95 % CI 76,68 - 93,86), had no signs or symptoms of amblyopia.
About warning signs, it was found that:
1 student (2,00 %, 95 % CI: 0,04 - 7,81) had an unspecified alarm sign.
2 students (3,00 %, 95 % CI 0,35 - 10,08) had myopia.
4 students (5,00 %, 95 % CI: 1,60 - 14,18) reported blurred vision.
Most students, 62 (90,00 %, 95 % CI: 80,21 - 95,82), had no alarm signs (table 3).
Variables | f(a) n= 69 | fr(%) | IC 95 % |
|---|---|---|---|
Clinical typicality | [empty cell] | [empty cell] | [empty cell] |
Asthenopia | 2 | 3,00 | 0,35 - 10,08 |
Headache | 4 | 6,00 | 1,60 – 14,18 |
Deprivation | 3 | 4,00 | 0,91 - 12,18 |
No signs and symptoms of amblyopia | 60 | 87,00 | 76,68 – 93,86 |
Alarm signs | [empty cell] | [empty cell] | [empty cell] |
Not specified | 1 | 2,00 | 0,04 – 7,81 |
Myopia | 2 | 3,00 | 0,35 - 10,08 |
Blurred vision | 4 | 5,00 | 1,60 – 14,18 |
No signs | 62 | 90,00 | 80,21 - 95,82 |
Visual acuity assessment using optotypes revealed that most students had normal visual acuity. Of the 69 participants, 57 students (83,00 %, 95 % CI 71,59 - 90,68) showed a visual acuity 20/20 in both eyes (OD and OI).
For other measures of visual acuity, the following results were observed: 20/25: 1 student (1,50 %, 95 % CI: 0,04 - 7,81) in the right eye (OD) and two students (3,00 %, 95 % CI: 0,35 - 10,08) in the left eye (OI). 20/30: 2 students (3,00 %, 95 % CI: 0,35 - 10,08) in OD and one student (1,50 %, 95 % CI: 0,04 - 7,81) in OI. 20/40: 3 students (4,00 %, 95 % CI: 0,91 - 12,18) in OD and two students (3,00 %, 95 % CI: 0,35 - 10,08) in OI. 20/50: 3 students (4,00 %, 95 % CI: 0,91 - 12,18) in both eyes (OD and OI). 20/60: 1 student (1,50 %, 95 % CI 0,04 - 7,81) in both eyes (OD and OI). 20/100: 1 student (1,50 %, 95 % CI 0,04 - 7,81) in both eyes (OD and OI). 20/400: 1 student (1,50 %, 95 % CI 0,04 - 7,81) in both eyes (OD and OI).
These results indicated that, although most students had normal visual acuity, there were 12 cases (17 %) with varying degrees of decreased visual acuity (table 4).
Visual acuity | Optotypes | Optotypes | IC 95 % |
|---|---|---|---|
Visual acuity | OD fa (%) n=69 | OI fa (%) n=69 | IC 95 % |
20/20 | 57(83,00) | 57(83,00) | 71,59 – 90,68 |
20/25 | 1(1,50) | 2 (3,00) | 0,04 – 7,81 0,35 – 10,08 |
20/30 | 2(3,00) | 1(1,50) | 0,35 – 10,08 0,04 – 7,81 |
20/40 | 3(4,00) | 2(3,00) | 0,91 – 12,18 0,35 – 10,08 |
20/50 | 3(4,00) | 3(4,00) | 0,91 – 12,18 |
20/60 | 1(1,50) | 1(1,50) | 0,04 – 7,81 |
20/100 | 1(1,50) | 1(1,50) | 0,04 – 7,81 |
20/400 | 1(1,50) | 1(1,50) | 0,04 – 7,81 |
Note: f(a)= Absolute Frequency, f® %= Relative Frequency, 95 % CI= Confidence Interval at 95 % Probability | Note: f(a)= Absolute Frequency, f® %= Relative Frequency, 95 % CI= Confidence Interval at 95 % Probability | Note: f(a)= Absolute Frequency, f® %= Relative Frequency, 95 % CI= Confidence Interval at 95 % Probability | Note: f(a)= Absolute Frequency, f® %= Relative Frequency, 95 % CI= Confidence Interval at 95 % Probability |
Visual acuity assessment using the JAEGER near vision chart showed that most students had normal near visual acuity. Of the 69 participants, 60 students (90,00 %, 95 % CI 71,59 - 90,68) achieved a visual acuity 1+ in both eyes (OD and OI).
For other measures of near visual acuity, the following results were observed:
1: 1 student (1,50 %, 95 % CI: 0,04 - 7,81) in both eyes (OD and OI).
16: 1 student (1,50 %, 95 % CI: 0,04 - 7,81) in OD and none in OI.
2: 5 students (7,00 %, 95 % CI 2,39 - 16,11) in both eyes (OD and OI).
3: 1 student (1,50 %, 95 % CI 0,04 - 7,81) in both eyes (OD and OI).
4: No student in OD and one student (1,50 %, 95 % CI 0,04 - 7,81) in OI.
5: 1 student (1,50 %, 95 % CI 0,04 - 7,81) in both eyes (OD and OI).
These results recorded that, although the majority of the students had normal near visual acuity, 9 cases, 10 %, had varying degrees of decreased near visual acuity (table 4.1).
Table 4.1. Visual acuity using the JAEGER near vision primer
Visual acuity | Visual acuity | Close-up vision booklet JAEGER | Close-up vision booklet JAEGER | IC 95 % | IC 95 % |
|---|---|---|---|---|---|
Visual acuity | Visual acuity | OD fa (%) n=69 | OI fa (%) n=69 | IC 95 % | IC 95 % |
1+ | 60(90,00) | 60(90,00) | 60(90,00) | 60(90,00) | 71,59 – 90,68 |
1 | 1(1,50) | 1(1,50) | 1(1,50) | 1(1,50) | 0,04 – 7,81 |
16 | 1(1,50) | 1(1,50) | 0(0,00) | 0(0,00) | 0,04 – 7,81 |
2 | 5(7,00) | 5(7,00) | 5(7,00) | 5(7,00) | 2,39 – 16,11 |
3 | 1(1,50) | 1(1,50) | 1(1,50) | 1(1,50) | 0,04 – 7,81 |
4 | 0(0,00) | 0(0,00) | 1(1,50) | 1(1,50) | 0,04 – 7,81 |
5 | 1(1,50) | 1(1,50) | 1(1,50) | 1(1,50) | 0,04 – 7,81 |
Note: f(a)= Absolute Frequency, f® %= Relative Frequency, 95 % CI= Confidence Interval at 95 % Probability. | Note: f(a)= Absolute Frequency, f® %= Relative Frequency, 95 % CI= Confidence Interval at 95 % Probability. | Note: f(a)= Absolute Frequency, f® %= Relative Frequency, 95 % CI= Confidence Interval at 95 % Probability. | Note: f(a)= Absolute Frequency, f® %= Relative Frequency, 95 % CI= Confidence Interval at 95 % Probability. | Note: f(a)= Absolute Frequency, f® %= Relative Frequency, 95 % CI= Confidence Interval at 95 % Probability. | Note: f(a)= Absolute Frequency, f® %= Relative Frequency, 95 % CI= Confidence Interval at 95 % Probability. |
The assessment of refracted and best-corrected visual acuity in the study population showed that most students did not require additional correction. Of the 69 participants, six students (9,00 %, 95 % CI: 3,26 - 17,97) achieved a visual acuity of 20/20 in both eyes (OD and OI) after correction. For other measures of corrected visual acuity, the following results were observed:
20/25: 1 student (1,50 %, 95 % CI: 0,04 - 7,81) in both eyes (OD and OI). 20/40: 1 student (1,50 %, 95 % CI: 0,04 - 7,81) in both eyes (OD and OI).20/50: 2 students (3,00 %, 95 % CI: 0,35 - 10,08) in OD and none in OI.20/60: 1 student (1,50 %, 95 % CI: 0,04 - 7,81) in both eyes (OD and OI). 20/150: No student in OD and one student (1,50 %, 95 % CI: 0,04 - 7,81) in OI. 20/200: No student in OD and one student (1,50 %, 95 % CI: 0,04 - 7,81) in OI. Not applicable: 57 students (83,00 %, 95 % CI 71,59 - 90,68) in both eyes (OD and OI). Does not attend the second phase: 1 student (1,50 %, 95 % CI: 0,04 - 7,81) in both eyes (OD and OI). These results indicate that, although most students did not require additional correction, some cases with varying degrees of decreased visual acuity were corrected.
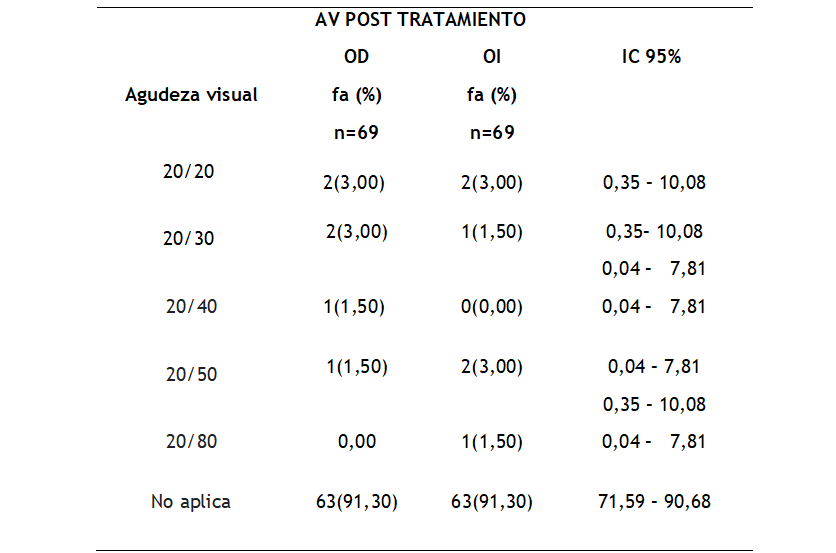
Post-treatment visual acuity assessment showed that most students did not require further follow-up. Of the 69 participants, two students (3,00 %, 95 % CI: 0,35 - 10,08) achieved a visual acuity of 20/20 in both eyes (OD and OI) after treatment.
For other post-treatment visual acuity measurements, the following results were observed: 20/30: 2 students (3,00 %, 95 % CI: 0,35 - 10,08) in OD and one student (1,50 %, 95 % CI: 0,04 - 7,81) in OI.40: 1 student (1,50 %, 95 % CI: 0,04 - 7,81) in OD and none in OI.20/50: 1 student (1,50 %, 95 % CI: 0,04 - 7,81) in OD and two students (3,00 %, 95 % CI: 0,35 - 10,08) in OI.20/80: No student in OD and one student (1,50 %, 95 % CI: 0,04 - 7,81) in OI.20/80: No student in OD and one student (1,50 %, 95 % CI: 0,04 - 7,81) in OI.20/80: No student in OD and one student (1,50 %, 95 % CI: 0,04 - 7,81) in OI. Not applicable: 63 students (91,30 %, 95 % CI 71,59 - 90,68) in both eyes (OD and OI). These results reported that, although most students did not require further follow-up, some cases with varying degrees of decreased visual acuity were treated (figure 1)
f(a)= Absolute frequency, f® %= Relative frequency, 95 % CI= Confidence Interval at 95 % probability.
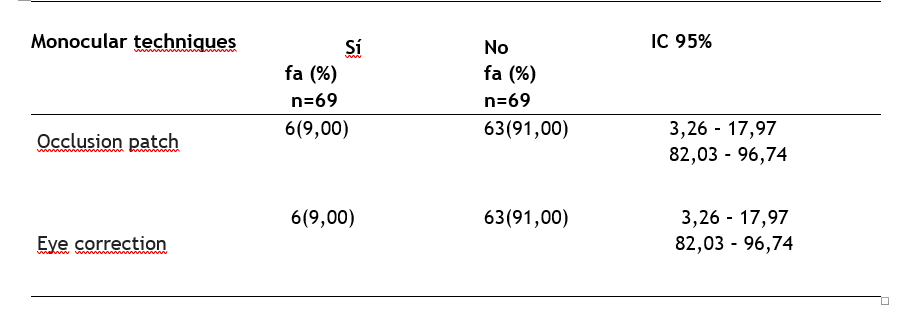
The study applied various monocular therapeutic techniques to children with amblyopia. These techniques included occlusive patching, optical penalisation, and specific visual exercises, with the aim of improving visual acuity in the affected eye.
The frequency and effectiveness of each technique were evaluated based on the patient's response and the observed improvement in visual acuity. The results indicated that most of the children responded positively to the therapies applied, showing a significant improvement in the amblyopic eye's visual acuity (figure 2).
DISCUSSION
The results obtained regarding the socio-demographic data according to age, sex, and educational level are consistent with those shown by Khazaeni (9) and Merchant (10) because, despite the difference in geographical context, the mean and predominant age are in the same statistical range. This is also linked to the fact that visual development is complete by the age of 8, which explains diagnoses at school age.
Likewise, regarding the history of visual pathologies, the findings of this study confirm that amblyopia is usually asymptomatic in the early stages. Therefore, it is common for patients to report having no symptoms at all, as stated in the study by Birch (11) and León et al.(12)
Regarding the use of optical correction, according to the findings of a high number of untreated children who could probably be developing amblyopia, these are congruent with the results of the study by Paliz et al.(13) About clinical typicality, it was observed that the majority of students did not present signs and symptoms of amblyopia. These data coincide with those observed in the study by Capetillo et al.(14) where the majority did not show evident signs and symptoms of amblyopia.
About the assessment of visual acuity using optotypes, the findings can be compared with those shown by Vignolo et al.(15) who express that the guarantee of this type of assessment to individually differentiate visual ability or the presence of mild or moderate visual disturbances is useful, similarly, about the application of various monocular therapeutic techniques to children with amblyopia and the results obtained. These agree with the study by Paliz et al.(13) and Khazaeni.(9)
CONCLUSIONS
Most of the students had improved visual acuity post-treatment, indicating the effectiveness of the monocular therapeutic techniques. The low prevalence of the use of optical correction and the lack of signs and symptoms in most of the students suggest a need for greater awareness and education about visual pathologies in the school population. Therefore, it is important to consider implementing a protocol for the diagnosis and management of amblyopia in schoolchildren in Aragua, Venezuela, which would impact improving visual health and preventing blindness.
References
- 1 Kniestedt C, Stamper RL. Visual acuity and its measurement. Ophthalmol Clin North Am. 2003;16:155-70.
- 2 Repka MX, Beck RW, Holmes JM, Birch EE, Chandler DL, Cotter SA, et al. A randomized trial of patching regimens for treatment of moderate amblyopia in children. Arch Ophthalmol. 2003 May;121(5):603-11. doi: https://10.1001/archopht.121.5.603.. PMID: 12742836.
- 3 Barrera OL, Jerez EM. Ambliopía. Caracterización clínico-epidemiológica. Multimed. 2019 Oct;23(6):1191.
- 4 Organización Mundial de la Salud. Al menos 2200 millones de personas tienen deficiencia visual o ceguera; de estos casos, más de 1000 millones podrían haberse evitado o aún no han sido tratados [Internet]. 2019. Available from: https://www.who.int/es/news/item/08-10-2019-who-launches-first-world-report-on-vision.
- 5 Teusa M, Noval S. Valoración oftalmológica del niño normal. Medidas preventivas. Signos de alarma. Servicio de Oftalmología. Hospital Universitario Príncipe de Asturias. 2009.
- 6 Wang J, Malik A, et al. Intense versus standard regimens of intermittent occlusion therapy for unilateral moderate amblyopia in children: study protocol for a randomized controlled trial. Salus University Pennsylvania College of Optometry. 2020.
- 7 Heiting G. Problemas de visión en niños en edad escolar [Internet]. Todo sobre visión. Available from: https://www.allaboutvision.com/es/vision-infantil/problemas-de-vision-en-ninos-en-edad-escolar/.
- 8 Tailor V, Ludden S, Bossi M, Bunce C, Greenwood JA, Dahlmann-Noor A. Binocular versus standard occlusion or blurring treatment for unilateral amblyopia in children aged three to eight years. Cochrane Database Syst Rev. 2022 Feb 15;2(2):CD011347. doi: https://10.1002/14651858.CD011347.pub3..
- 9 Khazaeni L. Ambliopía. Loma Linda University School of Medicine. Manual MSD Versión para Profesionales. 2024.
- 10 Merchante M. Ambliopía y estrabismo. Pediatr Integral. 2018;XXII (1):32-44.
- 11 Birch EE. Amblyopia and binocular vision. Prog Retin Eye Res. 2013 Mar;33:67-84. Epub 2012 Nov 29. PMID: 23201436; PMCID: PMC3577063. doi: https://10.1016/j.preteyeres.2012.11.001..
- 12 León T, De la Torre N, Cordero D, Reyes I, Lozano Y, Monteagudo M. Facultad de Tecnología de la Salud. Volumen 12 Número 4 (2021): OCT-DIC. ISSN: 2218-6719 RNPS: 2252.
- 13 Paliz Sánchez CR, Delgado Cruz MV, Flores Valero MF. Estrategias farmacológicas para la corrección de la ambliopía. UCT. 2024 Jun;28(123):82-93. Available from: http://ve.scielo.org/scielo.php?script=sci_arttext&pid=S1316-48212024000200082&lng=es. Epub 2024 Oct 1.
- 14 Capetillo Biart O, Triana Casado I, Martínez Legón ZC, Roche Caso S, Broche Hernández A. Frecuencia de la ambliopía en escolares. Rev. Cubana Pediatr. 2011 Dec;83(4):372-81. Available from: http://scielo.sld.cu/scielo.php?script=sci_arttext&pid=S0034-75312011000400005&lng=es.
- 15 Vignolo M, Cibilis J, Gerometta R, Cibils M. Agudeza visual en estudiantes universitarios de la Universidad Nacional del Nordeste. Rev. Investig Científica Tecnológica. 2025;8(2):6-14. Available from: https://revista.serrana.edu.py/rict/article/view/416.
Declarations
Funding
The authors received no funding for this research.
Conflict of interest
None. AUTHORSHIP CONTRIBUTION Conceptualisation: Patricia Acosta, Nibia Osorio, Carmen Puebla, Hayskell Falcón, Yuraima García. Data curation: Patricia Acosta, Nibia Osorio, Carmen Puebla, Hayskell Falcón, Yuraima García. Formal analysis: Patricia Acosta, Nibia Osorio, Carmen Puebla, Hayskell Falcón, Yuraima García. Research: Patricia Acosta, Nibia Osorio, Carmen Puebla, Hayskell Falcón, Yuraima García. Methodology: Patricia Acosta, Nibia Osorio, Carmen Puebla, Hayskell Falcón, Yuraima García. Project management: Patricia Acosta, Nibia Osorio, Carmen Puebla, Hayskell Falcón, Yuraima García. Software: Patricia Acosta, Nibia Osorio, Carmen Puebla, Hayskell Falcón, Yuraima García. Supervision: Patricia Acosta, Nibia Osorio, Carmen Puebla, Hayskell Falcón, Yuraima García. Validation: Patricia Acosta, Nibia Osorio, Carmen Puebla, Hayskell Falcón, Yuraima García. Visualisation: Patricia Acosta, Nibia Osorio, Carmen Puebla, Hayskell Falcón, Yuraima García. Writing - original draft: Patricia Acosta, Nibia Osorio, Carmen Puebla, Hayskell Falcón, Yuraima García. Writing - proofreading and editing: Patricia Acosta, Nibia Osorio, Carmen Puebla, Hayskell Falcón, Yuraima García.
Authorship contributions
Drafting – original draft: Patricia Acosta, Nibia Osorio, Carmen Puebla, Hayskell Falcón, Yuraima García.
Writing–review and editing: Patricia Acosta, Nibia Osorio, Carmen Puebla, Hayskell Falcón, Yuraima García.