
Abstract
Introduction: Hypertension control remains low in Latin America, and smartphone apps are proposed for self-management. What users of commercial blood pressure apps write in the region, and whether apps with gamification differ, was unknown. Methods: Cross-sectional study of public Apple App Store data from Mexico, Colombia, Brazil, Argentina and Chile. Eligible apps were found with the iTunes Search API, and written reviews dated 2013-2025 were coded manually by theme. Proportions carry Wilson intervals, and links with 1-2 star ratings were estimated with logistic models clustered by app, with a sensitivity analysis without the most reviewed app. Results: Of 239 eligible apps, 18 had written reviews, 130 in total. The most reviewed app held 36.2% of them. Ratings were polarised: 50.0% gave one star and 36.2% five stars. Positive usefulness appeared in 35.4% of reviews, cost and billing in 21.5% and unmet measurement claims in 16.9%. Reminders appeared once. Gamification was detected in 8 apps, none with reviews, so the contrast could not be estimated. Conclusions: Written feedback is scarce, concentrated in few apps and dominated by complaints about billing, failures and measurement claims. The role of gamification cannot be assessed with this source.
Keywords
hypertension, mobile applications, self-management, gamification, Latin America
INTRODUCTION
Hypertension affects more adults in Latin America than clinical services can control. Pooled estimates show that the number of people aged 30 to 79 years with hypertension doubled worldwide between 1990 and 2019,(1) and population surveys in six Latin American countries found a prevalence of 44.0% with control in only 37.6% of treated patients.(2) In the Southern Cone, awareness, treatment and control were low in a general population sample,(3) and regional programmes have long identified hypertension assessment as a priority of cardiovascular prevention,(4) and disparities in prevalence and control between regions are documented worldwide.(5) Self-management supported by mobile phones is one response. Meta-analyses of trials report larger reductions in systolic and diastolic blood pressure with mobile health self-management than with control conditions,(6,7) although a randomised trial in low-resource urban settings of Argentina, Guatemala and Peru found no net change in blood pressure after text messages and counselling calls.(8)
The pattern expected in app stores is different from the pattern expected in trials. Commercial blood pressure apps are numerous, usually offer a single function, and rarely document expert input: a systematic search of two stores identified 184 apps with a mean quality score of about 2.6 out of 5,(9) 186 apps were found in the United Kingdom stores, most with only one function,(10) and 73 apps in the Chinese market covered on average 37.4% of a usefulness item set.(11) In Brazil, a narrative review of Google Play found 267 hypertension apps, many classified as entertainment, and noted that users tended to believe the information they delivered.(12) Studies that mined user reviews of hypertension apps in China and the United States, and of mental health or weight-loss apps elsewhere, show that written feedback centres on usability, cost and functioning.(13-15) Few apps are expected to use gamification, since a review of top-rated health apps found game elements in 4% of 1680 apps,(16) and evidence that gamification changes health behaviour is mixed and of moderate quality.(17) A skewed distribution of reviews across apps, polarised ratings and a small gamified subset were therefore the expected pattern.
Evidence from Latin American app stores is scarce. In a sample of patients with chronic disease in La Paz and El Alto, most owned a mobile phone,(18) regulatory frameworks for health apps are lacking in countries such as Peru,(19) and barriers to the use of mobile health in developing countries have been reviewed.(20) No study has described what users in Mexico, Colombia, Brazil, Argentina and Chile write about blood pressure apps. This study aimed to describe the written reviews of blood pressure self-management apps in five Latin American App Store storefronts, to estimate the frequency of themes related to usefulness, measurement, reminders, cost and adherence, and to compare reviews of apps with gamification or behaviour-change features with those of the remaining apps.
METHODS
Design and reporting
A cross-sectional descriptive study of public app store data was designed, reported following the STROBE items that apply to observational secondary data. The unit of exposure was the app, the unit of observation was the written review, and the analysis restricted to reviews dated 2013-2025. The central group comprised all eligible blood pressure apps, and gamification or behaviour-change features were defined as a secondary contrast. The protocol was written before the full analysis was run. Two changes were made after inspecting preliminary output: the eligibility rule was tightened to exclude apps whose title named another primary measure and apps first released in 2026, and the keyword-based theme coding was replaced by manual coding because the lexicon misclassified negated phrases.
Data sources and eligibility
Data came from two public Apple interfaces that require no login: the iTunes Search API and the customer review feeds in JSON format of each storefront. Searches were made in the storefronts of Mexico, Colombia, Brazil, Argentina and Chile with Spanish, Portuguese and English terms for blood pressure, hypertension and blood pressure monitors, each returning up to 200 apps. The queries returned 706 distinct apps. An app was eligible when it belonged to the genres Health and Fitness, Medical, Lifestyle, Utilities, Education or Productivity (679 apps), had been first released by 2025 (474), was not named as a calculator, neonatal or paediatric tool (471), named blood pressure or hypertension in its title or in the first 200 characters of its description without a different primary measure such as heart rate or glucose in the title (249), and described tracking, logging, monitoring or reading functions (239). The final set comprised 239 apps.
The review feed of each eligible app was queried in each of the five storefronts, up to ten pages of the most recent written reviews per app and storefront (1,195 feeds). Feeds that returned an access refusal or no content (375 refusals) were treated as having no written reviews available. Review dates were taken from the update field, and reviews dated before 2013 or after 2025 were excluded. Author names and profile links were discarded at loading, and no review text is quoted verbatim. The data correspond to the snapshot available from the public API.
Apps listed in more than one storefront were counted once in the catalogue and once per storefront in the storefront rows. No sample size was calculated, because the study took every eligible app and every written review available through the public feeds, and the precision of each estimate is reported through its interval.
Gamification and behaviour-change features
Apps were classified from their title and store description with a keyword lexicon in English, Spanish and Portuguese. Gamification terms included badges, streaks, rewards, leaderboards, medals, trophies, challenges and levels. Behaviour-change terms included goal setting, personalised coaching, advice or feedback, multi-day programmes and habit building. The matched text of every flagged app was read, and two false positives, a generic use of the word challenge and an award notice, were set to not gamified. The classification reflects what the store description announces and not what the app does.
The themes were defined as follows. Positive usefulness covered statements that the app helped, was practical or was recommended, and perceived uselessness covered statements that it served no purpose. Measurement not delivered as advertised covered reviews stating that the app did not take blood pressure, stored only typed values or failed to produce a reading, and reading accuracy or consistency covered doubts about the correctness or repeatability of readings. Logging, charts, export and synchronisation covered history, graphs, reports, PDF export, backup and links with health platforms or watches. Cost, subscription and billing covered price, charges, free trials, cancellation and refunds, advertising covered in-app ads, and reminders and alerts covered notifications. Routine or sustained use covered statements of daily or long-term use, technical failure covered crashes, apps that did not open, lost data and failures after updates, and usability and language covered ease of use, interface and interface language. The language of each review was assigned with a stop-word heuristic and is used only for description.
RESULTS
The store searches returned 706 apps, and 239 met the eligibility rule. Releases from 2023 to 2025 accounted for 149 of them, 96.2% were free to download, and 239 apps came from 235 distinct developer names. Health and Fitness held 57.3% of the catalogue and Medical 30.5%. Written reviews dated 2013-2025 existed for 18 apps (7.5%), and 221 apps had none.
The yearly volume of reviews climbed to a peak of 26 reviews (20.0%) in 2025 (Figure 1). The seven years of 2013-2019 held 41 reviews, the three years of 2020-2022 held 39 and the three years of 2023-2025 held 50, and every year of the window had at least one review. Colombia contributed 36.2% of the 130 reviews, Brazil 26.9%, Argentina 20.0%, Chile 10.0% and Mexico 6.9% (Table 1).
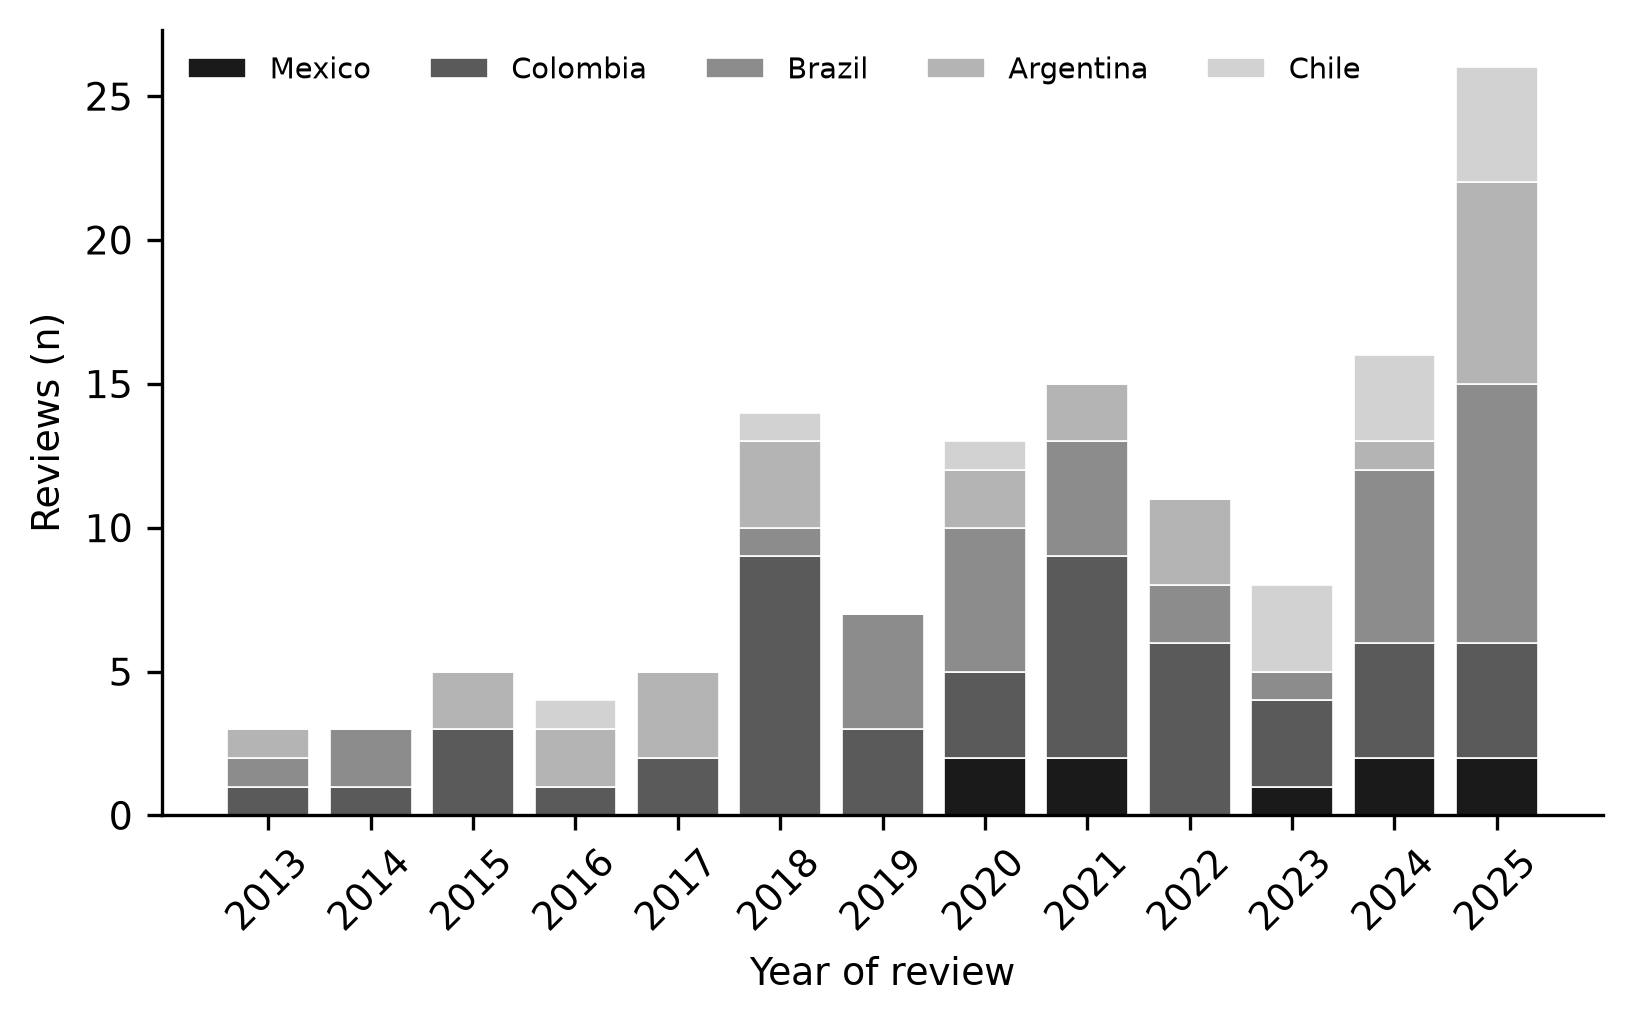
Figure 1. Written reviews of blood pressure apps by year of review and storefront.
Storefront | Apps with reviews | Reviews | Mean rating (SD) | 1-2 stars (%) | 5 stars (%) | Spanish or Portuguese text (%) |
|---|---|---|---|---|---|---|
Mexico | 6 | 9 | 3.11 (1.83) | 44.4 | 33.3 | 66.7 |
Colombia | 6 | 47 | 2.19 (1.74) | 70.2 | 23.4 | 95.7 |
Brazil | 6 | 35 | 2.77 (1.85) | 48.6 | 34.3 | 82.9 |
Argentina | 4 | 26 | 3.35 (1.94) | 38.5 | 53.8 | 84.6 |
Chile | 3 | 13 | 3.31 (1.97) | 38.5 | 53.8 | 92.3 |
All five | 18 | 130 | 2.75 (1.87) | 53.1 | 36.2 | 87.7 |
Note: SD = standard deviation. Apps with reviews are counted within each storefront, so the row of all five storefronts counts each app once.
The distribution across apps clustered in a handful of titles (Figure 2). The most reviewed app held 36.2% of the reviews (47 reviews in 2 storefronts), the three most reviewed 58.5% and the five most reviewed 77.7%. The second and third apps held 11.5% and 10.8%. Of 18 apps with reviews, 12 had five reviews or fewer and 7 had a single one (median 2), and the Herfindahl-Hirschman index reached 1,815.
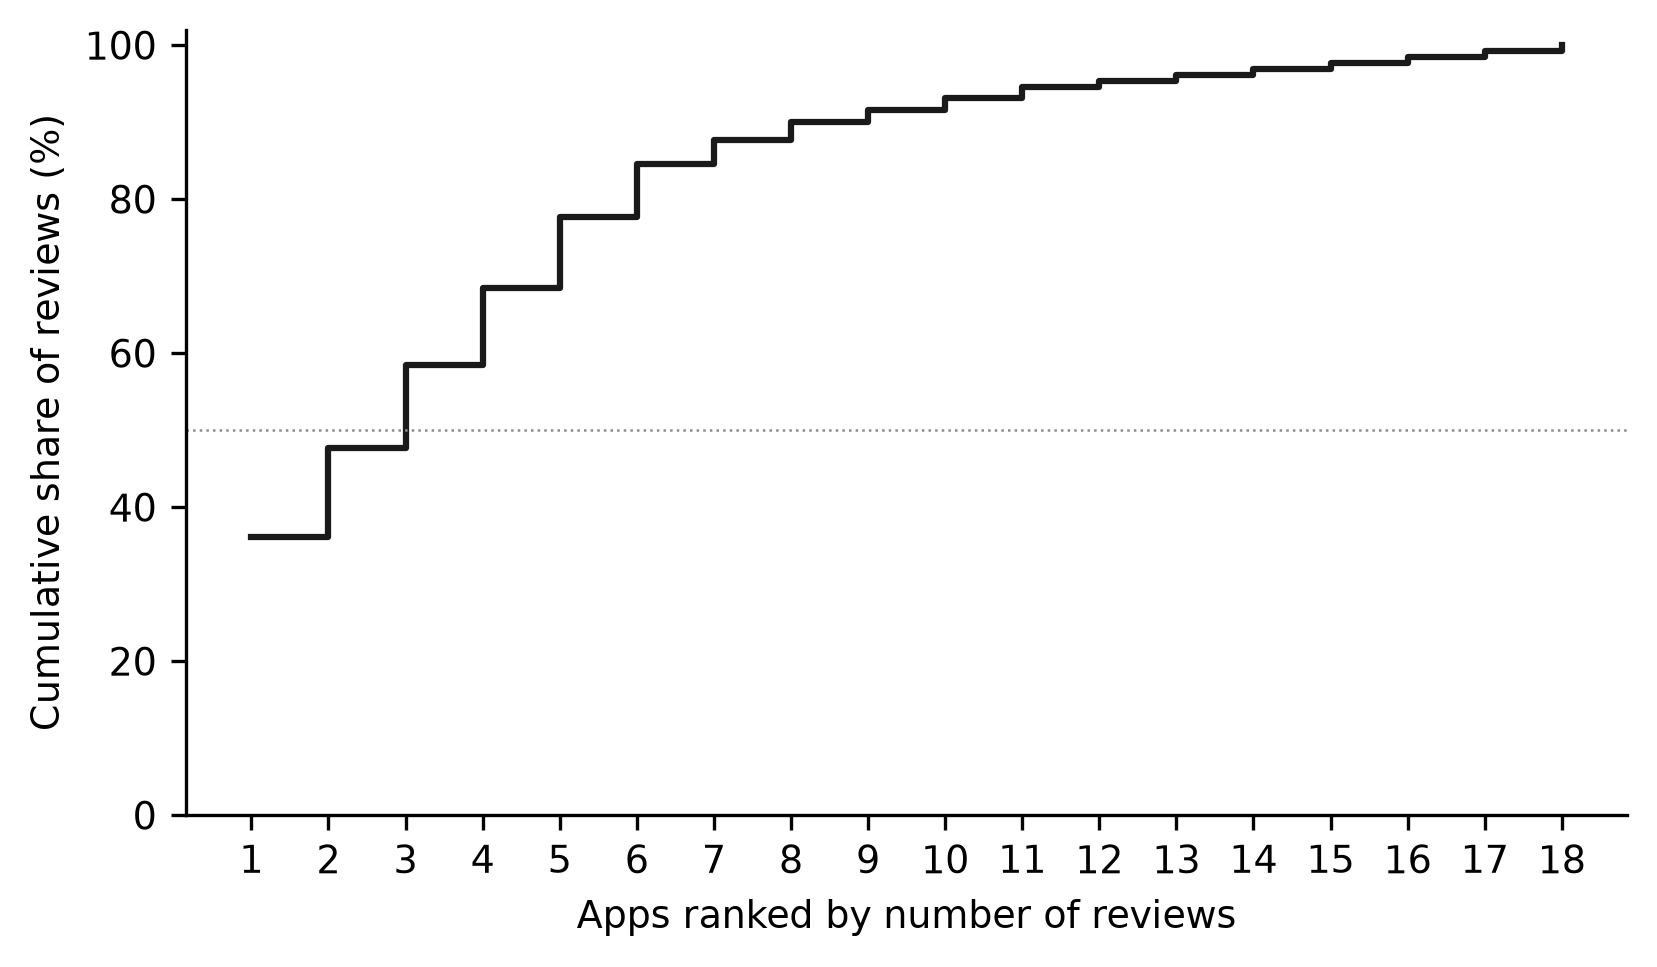
Figure 2. Cumulative share of reviews by apps ranked by number of reviews.
Note: The dotted line marks 50% of reviews.No single app held a majority of the reviews, but the most reviewed one was nevertheless set apart in a sensitivity analysis of 83 reviews from 17 apps. That app, first released in 2012 and free to download, averaged 3.06 stars against 2.58 for the rest, and 46.8% of its reviews gave 1-2 stars.
The ratings spread to both ends of the scale (Figure 3). One star was given by 50.0% of the reviews and five stars by 36.2%, and the mean was 2.75 (SD 1.87). Low ratings reached 56.6% without the most reviewed app. Colombia dropped to a mean of 2.19 with 70.2% of reviews at 1-2 stars, whereas Argentina and Chile stood at 3.35 and 3.31. These storefront differences did not reach significance (chi-square p = 0.051; Kruskal-Wallis p = 0.091).
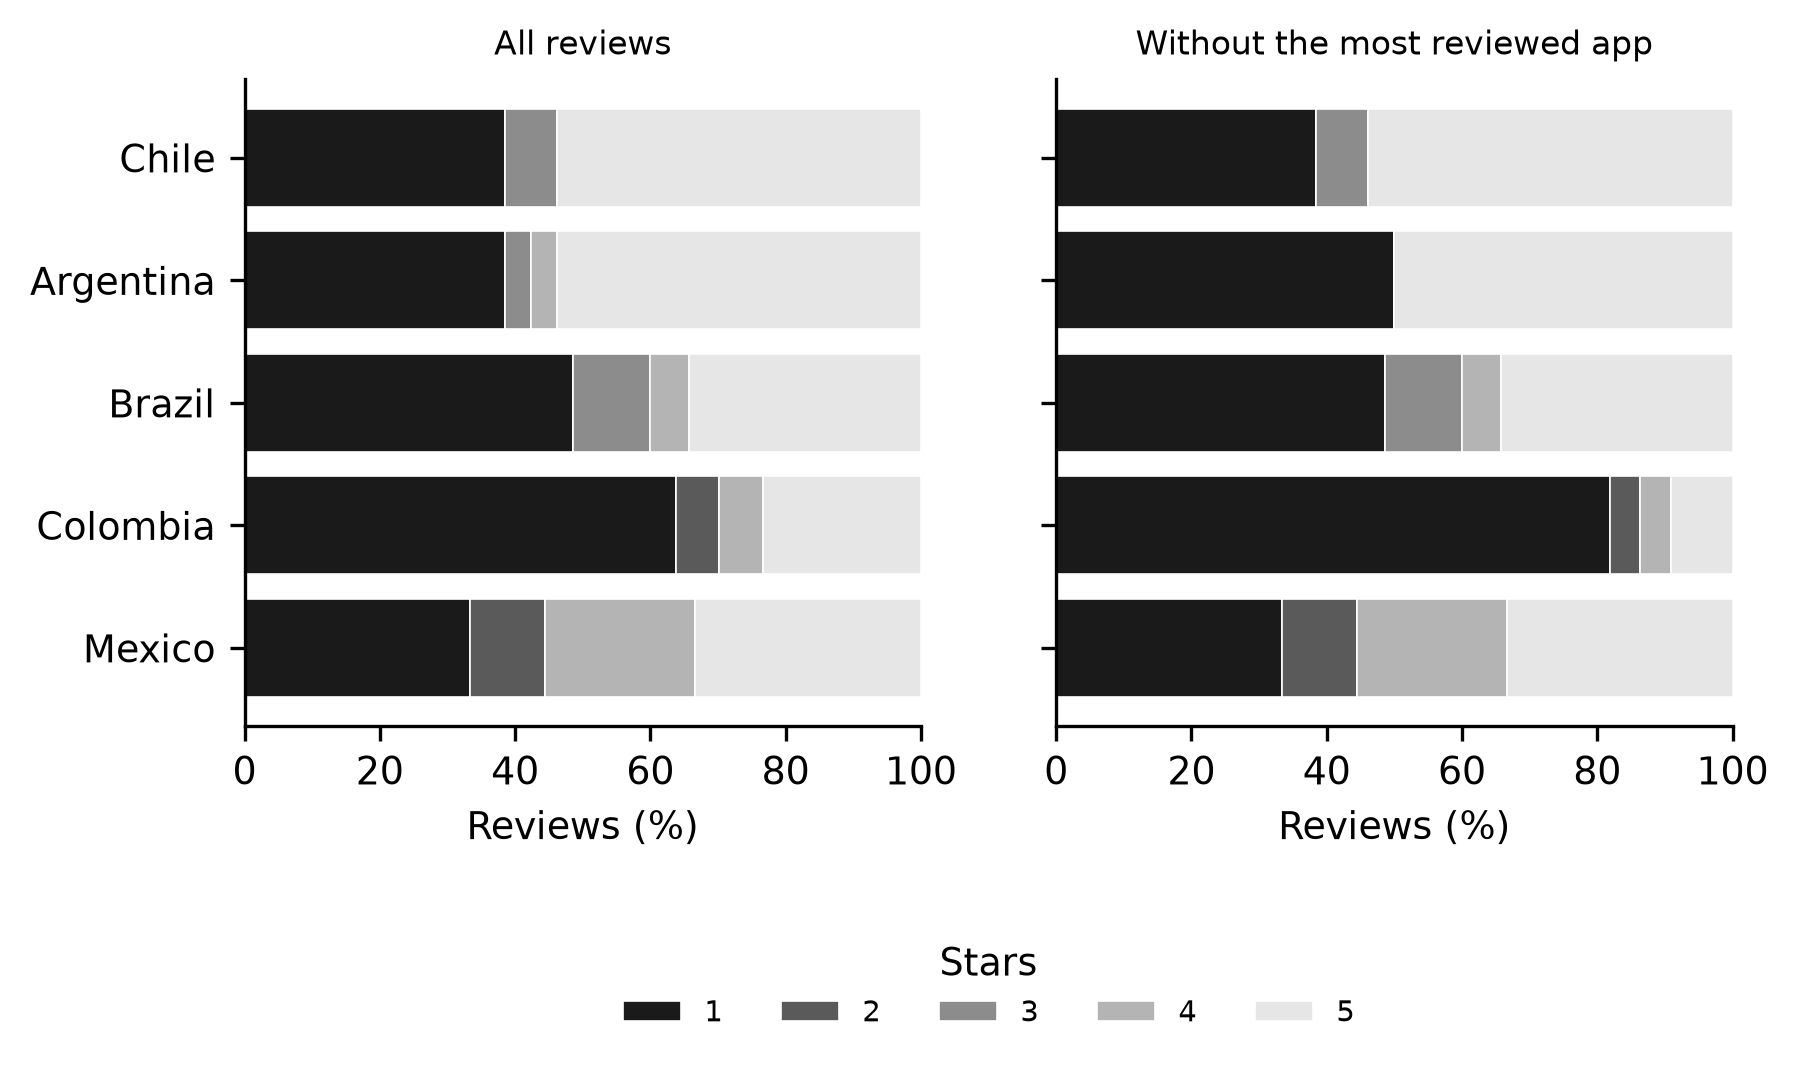
Figure 3. Distribution of star ratings by storefront.
Note: Left panel, all reviews; right panel, without the most reviewed app.The mean rating coincided with no clear time pattern: it stood at 2.68, 2.56 and 2.96 in the three periods (Spearman rho = −0.25, p = 0.404). The 18 reviews written about the 3 paid apps averaged 2.28 stars, against 2.83 for free apps.
Positive usefulness was the theme with the highest frequency, present in 35.4% of reviews (46 reviews, 10 apps; Figure 4). Cost, subscription and billing followed with 21.5%, logging, charts, export and synchronisation with 20.0%, and measurement not delivered as advertised with 16.9%. Technical failure appeared in 15.4%, usability and language in 13.8% and perceived uselessness in 10.8%. Removing the most reviewed app left positive usefulness and billing as the two most frequent themes (Table 2).
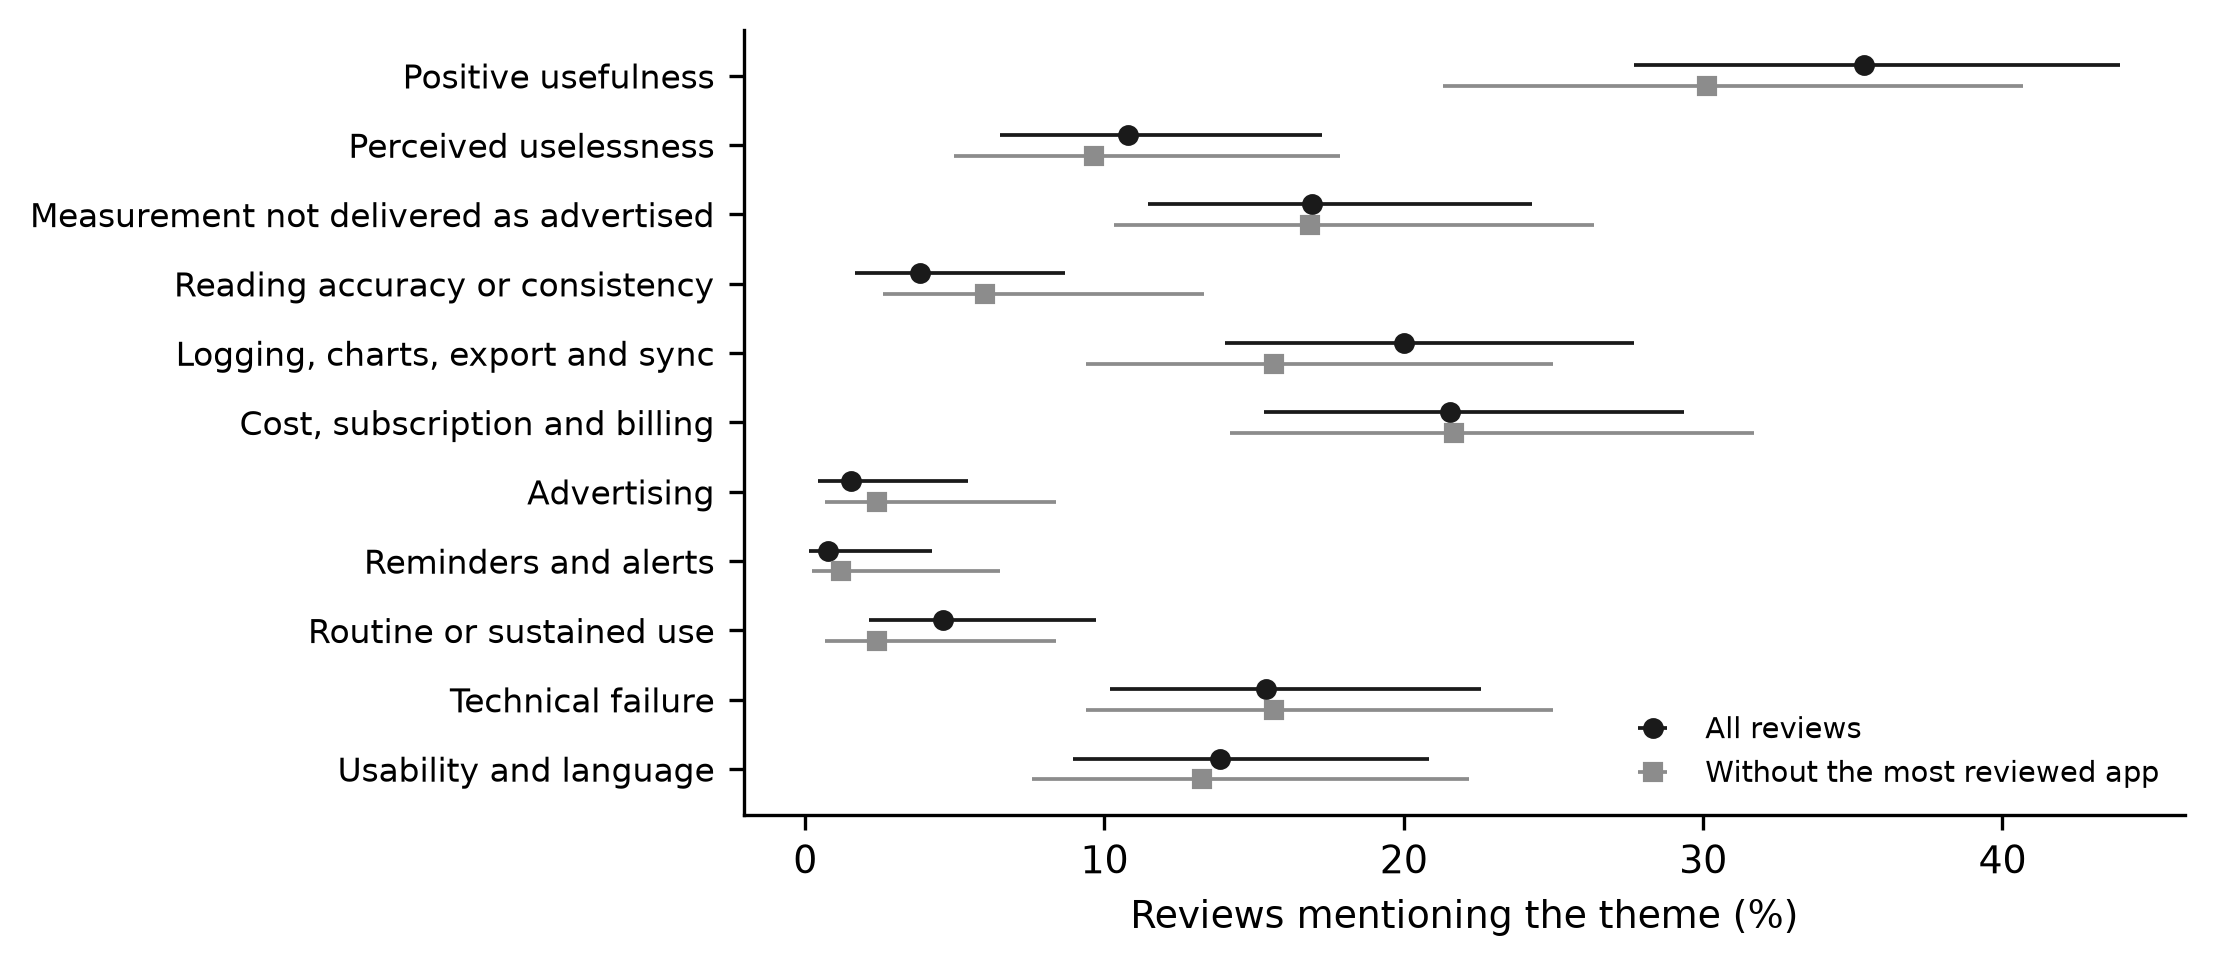
Figure 4. Percentage of reviews carrying each theme.
Note: Horizontal lines are 95% Wilson confidence intervals; themes could co-occur in one review.Theme | Reviews (n) | All reviews (%) | 95% CI | Without top app (%) | 1-2 stars if mentioned (%) | 1-2 stars if not (%) | OR for 1-2 stars (95% CI) | Holm p |
|---|---|---|---|---|---|---|---|---|
Positive usefulness | 46 | 35.4 | 27.7-43.9 | 30.1 | 0.0 | 82.1 | NE | p = 1.000 |
Perceived uselessness | 14 | 10.8 | 6.5-17.3 | 9.6 | 92.9 | 48.3 | 11.72 (1.38-99.87) | p = 0.170 |
Measurement not delivered as advertised | 22 | 16.9 | 11.4-24.3 | 16.9 | 90.9 | 45.4 | 9.94 (3.68-26.84) | p < 0.001 |
Reading accuracy or consistency | 5 | 3.8 | 1.7-8.7 | 6.0 | 60.0 | 52.8 | 1.14 (0.27-4.75) | p = 1.000 |
Logging, charts, export and sync | 26 | 20.0 | 14.0-27.7 | 15.7 | 23.1 | 60.6 | 0.22 (0.11-0.44) | p < 0.001 |
Cost, subscription and billing | 28 | 21.5 | 15.3-29.4 | 21.7 | 82.1 | 45.1 | 5.28 (2.02-13.81) | p = 0.006 |
Advertising | 2 | 1.5 | 0.4-5.4 | 2.4 | 100.0 | 52.3 | NE | p = 1.000 |
Reminders and alerts | 1 | 0.8 | 0.1-4.2 | 1.2 | 0.0 | 53.5 | NE | p = 1.000 |
Routine or sustained use | 6 | 4.6 | 2.1-9.7 | 2.4 | 0.0 | 55.6 | NE | p = 1.000 |
Technical failure | 20 | 15.4 | 10.2-22.6 | 15.7 | 90.0 | 46.4 | 9.15 (1.87-44.77) | p = 0.050 |
Usability and language | 18 | 13.8 | 8.9-20.8 | 13.3 | 44.4 | 54.5 | 0.80 (0.43-1.47) | p = 1.000 |
Note: CI = confidence interval (Wilson); OR = odds ratio from a logistic model with errors clustered by app and exchangeable correlation; Holm p = p value adjusted over 11 themes; NE = not estimable because a cell had no reviews. Without top app = percentage after removing the most reviewed app. Reviews could carry more than one theme.
The review texts were short. The median length was 9 words, and 30.8% of the reviews had fewer than five words. Spanish accounted for 65.4% of the texts, Portuguese for 22.3%, English for 3.1% and other or undetermined language for 9.2%, while 50.6% of the eligible apps listed Spanish or Portuguese among their interface languages. No specific theme was coded in 10.0% of the reviews. In Colombia, billing appeared in 21.3% of reviews, measurement complaints in 21.3% and technical failure in 21.3%.
Four themes had few mentions. Routine or sustained use appeared in 6 reviews (4.6%), reading accuracy or consistency in 5 (3.8%), advertising in 2 and reminders or alerts in 1. No review that praised usefulness gave 1-2 stars, whereas 90.9% of reviews on measurement not delivered, 90.0% on technical failure and 82.1% on billing did. The odds of a low rating were 9.9 times higher with measurement complaints (95% CI 3.7-26.8), 9.1 times higher with technical failure and 5.3 times higher with billing complaints, whereas reviews on logging features had odds of 0.22 times those of other reviews. In Colombia, 61.7% of reviews carried a billing, measurement, failure or uselessness complaint.
The sensitivity analysis without the most reviewed app left the pattern in place. Positive usefulness fell to 30.1%, logging and export to 15.7%, billing stayed at 21.7% and measurement not delivered at 16.9%. The odds ratios for a low rating stayed above one for measurement complaints (4.4, 95% CI 1.3-15.4) and technical failure (3.0, 95% CI 1.5-5.9), and the billing estimate lost precision (4.1, 95% CI 0.9-19.0). Reviews in Spanish averaged 2.68 stars (85 reviews) and in Portuguese 2.62 stars (29 reviews).
The contrast with gamified and behaviour-change apps could not be estimated at review level. The lexicon flagged 8 of 239 apps for gamification (0 with a written review; 95% CI of coverage 0.0%-32.4%) and 17 for behaviour-change features, 23 in total. Only 2 of those 23 apps (8.7%) had written reviews, against 16 of 216 (7.4%) among the rest (Fisher p = 0.687), and the two reviews of the featured apps preclude any comparison of ratings or themes.
DISCUSSION
The main finding is the thinness of written feedback relative to the size of the catalogue. Only 7.5% of eligible apps had a written review in these five storefronts, and the reviews that exist clustered in a few titles and in complaints. Published analyses of user reviews of hypertension apps worked with much larger corpora, including 116,686 reviews of 261 apps in China and the United States( 13) and 13,549 reviews of mental health apps,( 14) and even small qualitative designs sampled 569 reviews of weight-tracking apps.( 15) The difference has three plausible origins. The review feed exposes only recent written reviews, app users differ across countries in their likelihood of downloading medical apps and of rating apps, as a survey of 4,824 users in more than 15 countries that included Brazil and Mexico documented.( 21) The catalogue itself was young and fragmented, with 149 of 239 apps released in the last three years of the window and almost as many developers as apps, which leaves little time for any single app to accumulate reviews.
The most reviewed app was released in 2012, which gave it the longest time to accumulate reviews, and the sensitivity analysis showed that the main patterns did not depend on it. Percentages of themes moved by no more than about five points when it was removed, and the share of low ratings rose from 53.1% to 56.6%. The reviews give no basis for ranking apps, because ratings were not related to any feature in earlier work either: a regression on 151 hypertension apps found little evidence that specific features predicted download counts or ratings,(22) and the number of behaviour change techniques did not correlate with ratings of gamified health apps.(16) When a feature was associated with ratings, the features that saved time, allowed data export and gave instructions helped, whereas the tracker function alone detracted.(23) The present data agree on the weight of logging and export, which were the only functional theme linked to better ratings, with a lower odds of a low rating among reviews that mentioned them.
The polarisation of ratings follows from what users complain about. A total of 49.2% of the reviews carried a billing, measurement, failure or uselessness complaint, and these themes were strongly tied to 1-2 star ratings, whereas praise for usefulness never coincided with a low rating. Cost matters in app stores in general: users from some countries are more sensitive to price than others,(21) and cost was among the features associated with ratings in one regression of health apps(23) but pricing was unrelated to quality scores in a Dutch search.(9) The billing complaints appear to concern the mismatch between a free listing and an opaque subscription, with reviewers describing charges they did not expect, cancellations they could not complete and refunds that were denied. This is an interpretation of coded text and not a tested mechanism. The higher share of low ratings in Colombia may reflect which apps happened to be reviewed there, because only 6 apps contributed reviews there; the storefront difference was not significant and should not be taken as a country effect.
Measurement claims deserve separate attention. Reviewers in Colombia, Brazil, Argentina and Chile wrote that the app did not take blood pressure, only stored typed values, or promised a reading that it could not deliver. This is not a user misunderstanding alone. Apps that estimate pressure from a fingertip on a phone camera are marketed widely, yet a clinical test of a camera-based app reported that just 38.1% of 2,895 paired readings fell within 5 mmHg of a reference device,(24) validation studies of another smartphone algorithm were run against reference measurements under formal protocols,(25,26) and a recent meta-analysis noted that many apps lack validation for both blood pressure lowering and measurement accuracy.(7) Brazilian reviewers of Google Play made a related point about the credibility of information, since users tended to believe the content delivered.(12) Complaints about accuracy itself were few here, probably because users who cannot obtain a reading do not reach the question of its accuracy.
Technical failure, usability and language complaints complete the picture and match reviews in other health domains, where poor usability was the commonest reason for abandoning apps( 14) and reviews of medication adherence apps have also been used to explore what users experience.(27,28) For a chronic condition, the loss of a diary is more than an inconvenience, and the reviews on failures included records that could not be saved or that disappeared. The privacy side of this problem lies outside what reviews reveal, but earlier work found that only 30.5% of the 600 most commonly used health apps had a privacy policy,( 29) that privacy assessments of health apps use varied components,( 30) and that Chinese hypertension apps offered less data protection when developed in the mainland.( 11)
The scarcity of reminders and adherence content is the clearest mismatch with the research literature. Reminders and alerts appeared in one review and routine use in 6 of 130, although self-monitoring dominates the functions of hypertension apps while goal setting through reminders, communication with professionals and data export are less common,(31) and engagement with interactive and tailored apps has been linked to better blood pressure outcomes.(32) Users in other settings abandon apps after a short initial use,(33) and dropout limits what mobile health can achieve.(34,35) Our users did not write about those matters, which suggests that the app store review is a poor channel for adherence evidence. Adherence in Latin American hypertensive patients has been studied through other instruments, such as a scale based on the health belief model to measure drug adherence in hypertensive patients,(36) a clinical trial of telephone follow-up with text messages in Colombia,(37) and a prototype motivational app for treatment adherence in Brazil.(38) A Brazilian article describes a free self-monitoring solution with gamification endorsed by medical societies,(39) and none of the apps in our reviews fits that description.
Praise needs careful reading. Positive usefulness never coincided with a low rating and often came with logging or export features, which agrees with a regression in which data export and clear instructions contributed to ratings.( 23) Yet the reviews cannot show that the apps lower blood pressure. A meta-analysis of app-based interventions reported a systolic reduction of 2.76 mmHg at six months, with larger early effects in hypertensive participants that faded later,(7) another review pooled a reduction of 1.45 mmHg,(40) and the Latin American trial of text messages and counselling found no net change in blood pressure.(8) The concept of prescribable apps, defined as available apps with proven effect, was proposed because that evidence is seldom attached to commercial products.(41) A satisfied user and a clinically effective app are therefore different outcomes, and the store review captures only the first.
The method of reading reviews also shapes what is found. Earlier work coded reviews with machine learning and thematic analysis,( 42) annotated sentiment manually for a single health app( 43) or paired a content analysis of apps with a content analysis of their reviews.( 27) Manual coding of 130 short reviews, as done here, allows negated phrases to be handled, which a keyword lexicon could not do in our preliminary output, but it cannot be scaled and was done by one coder. The choice of a manual approach responded to the small volume and does not replace topic models in larger corpora.
The price of apps is a related matter. A content analysis of paid health and fitness apps used developer descriptions to characterise what buyers are offered,(44) and our 3 paid apps with 18 reviews averaged 2.28 stars against 2.83 for free apps. With so few apps this difference is anecdotal, and the billing complaints concerned subscriptions and in-app charges more than purchase prices. Evidence on behaviour change frames what users might expect from an app, since syntheses of apps and health behaviour (45) and of their behavioural functionality (46) describe varied behavioural content, and a usability study of a commercial hypertension app in the Gulf region combined task testing with a four-week real-world use.(47) A trial of a blood pressure management app targeted treatment adherence directly,(48) and the reviews we read contained none of that language.
The gamification contrast could not be answered. Gamification terms appeared in 8 of 239 apps (0 reviewed), and the share is close to the 4% found among top-rated health apps in an international review.(16) Other reviews describe gamified health apps in volume, with archetypes of gamification in 143 apps,(49) an average of 1.4 game techniques per diabetes app(50) and a scoping review of 11 studies in which gamification was used alone in nine and adherence was generally improved or sustained.(51) A review of personal health management makes gamification part of the field,(52) and behaviour-change techniques have been linked to engagement.(53) For hypertension apps in Latin American stores, these designs are rare in the catalogue and absent from the reviews. The finding does not show that gamification is ineffective, only that the public review record cannot evaluate it here.
The catalogue composition adds context. Most eligible apps sat in Health and Fitness rather than Medical, which parallels the finding that a large share of hypertension apps in a Brazilian store review belonged to entertainment and general categories,( 12) and apps with a single function predominated elsewhere.( 10) Apps first released in 2023 or later made up most of the catalogue, and a young catalogue gives most apps little time to be exposed to users. Spanish and Portuguese reviews were similar in mean rating, which gives no sign of a language effect in these data and is compatible with the view that the complaint profile belongs to the apps and their business models. The Portuguese-language evidence from Brazil on apps for hypertension is also still mostly about prototypes and usability, as in the motivational app prototype for people with hypertension,( 38) and not about commercial store behaviour.
Developers of blood pressure apps in Spanish and Portuguese should state clearly whether the app measures pressure or only records it, show subscription terms before payment, and offer export and synchronisation, the functions that reviewers who were satisfied mentioned. Regulators can use the complaint profile as a signal in the regulatory gap described for Peru,(19) and clinicians recommending apps should favour those with a documented prescribable status(41) and take into account the barriers to mobile health in developing countries.(20) Because most patients with chronic disease in a Bolivian sample owned a mobile phone(18) and text messages for a hypertension prevention programme have undergone multi-country validation,(54) the opportunity for self-management support exists; what the reviews show is a market that, for now, delivers it unevenly.
CONCLUSIONS
Written feedback on blood pressure self-management apps in five Latin American App Store storefronts was scarce and concentrated in few apps. Users wrote mainly about usefulness, billing, measurement claims and technical failures, and almost nothing about reminders or adherence. The comparison between apps with and without gamification or behaviour-change features could not be made with these data.
References
- 1 Zhou B, Carrillo-Larco RM, Danaei G, Riley LM, Paciorek CJ, Stevens GA, et al. Worldwide trends in hypertension prevalence and progress in treatment and control from 1990 to 2019: a pooled analysis of 1201 population-representative studies with 104 million participants. The Lancet. 2021;398(10304):957-980. doi: 10.1016/s0140-6736(21)01330-1
- 2 Lamelas P, Diaz R, Orlandini A, Avezum A, Oliveira G, Mattos A, et al. Prevalence, awareness, treatment and control of hypertension in rural and urban communities in Latin American countries. Journal of Hypertension. 2019;37(9):1813-1821. doi: 10.1097/hjh.0000000000002108
- 3 Rubinstein AL, Irazola VE, Calandrelli M, Chen CS, Gutierrez L, Lanas F, et al. Prevalence, Awareness, Treatment, and Control of Hypertension in the Southern Cone of Latin America. American Journal of Hypertension. 2016;29(12):1343-1352. doi: 10.1093/ajh/hpw092
- 4 Ordunez P, Martinez R, Niebylski ML, Campbell NR. Hypertension Prevention and Control in Latin America and the Caribbean. J of Clinical Hypertension. 2015;17(7):499-502. doi: 10.1111/jch.12518
- 5 Mills KT, Bundy JD, Kelly TN, Reed JE, Kearney PM, Reynolds K, et al. Global Disparities of Hypertension Prevalence and Control. Circulation. 2016;134(6):441-450. doi: 10.1161/circulationaha.115.018912
- 6 Li R, Liang N, Bu F, Hesketh T. The Effectiveness of Self-Management of Hypertension in Adults Using Mobile Health: Systematic Review and Meta-Analysis. JMIR Mhealth Uhealth. 2020;8(3):e17776. doi: 10.2196/17776
- 7 Abe M, Hirata T, Morito N, Kawashima M, Yoshida S, Takami Y, et al. Smartphone application-based intervention to lower blood pressure: a systematic review and meta-analysis. Hypertens Res. 2025;48(2):492-505. doi: 10.1038/s41440-024-01939-6
- 8 Rubinstein A, Miranda JJ, Beratarrechea A, Diez-Canseco F, Kanter R, Gutierrez L, et al. Effectiveness of an mHealth intervention to improve the cardiometabolic profile of people with prehypertension in low-resource urban settings in Latin America: a randomised controlled trial. The Lancet Diabetes & Endocrinology. 2016;4(1):52-63. doi: 10.1016/s2213-8587(15)00381-2
- 9 Jamaladin H, van de Belt TH, Luijpers LC, de Graaff FR, Bredie SJ, Roeleveld N, et al. Mobile Apps for Blood Pressure Monitoring: Systematic Search in App Stores and Content Analysis. JMIR Mhealth Uhealth. 2018;6(11):e187. doi: 10.2196/mhealth.9888
- 10 Alessa T, Hawley MS, Hock ES, de Witte L. Smartphone Apps to Support Self-Management of Hypertension: Review and Content Analysis. JMIR Mhealth Uhealth. 2019;7(5):e13645. doi: 10.2196/13645
- 11 Liang J, He X, Jia Y, Zhu W, Lei J. Chinese Mobile Health APPs for Hypertension Management: A Systematic Evaluation of Usefulness. Journal of Healthcare Engineering. 2018;2018:1-14. doi: 10.1155/2018/7328274
- 12 Silveira LK, Carvalho LO, Rosa LFF, Paraizo CMS, Dázio EMR, Fava SMCL. Aplicativos móveis sobre hipertensão arterial sistêmica: revisão narrativa. BJD. 2020;6(2):7413-7422. doi: 10.34117/bjdv6n2-153
- 13 He Y, Zhu W, Wang T, Chen H, Xin J, Liu Y, et al. Mining User Reviews From Hypertension Management Mobile Health Apps to Explore Factors Influencing User Satisfaction and Their Asymmetry: Comparative Study. JMIR Mhealth Uhealth. 2024;12(1):e55199. doi: 10.2196/55199
- 14 Alqahtani F, Orji R. Insights from user reviews to improve mental health apps. Health Informatics J. 2020;26(3):2042-2066. doi: 10.1177/1460458219896492
- 15 Frie K, Hartmann-Boyce J, Jebb S, Albury C, Nourse R, Aveyard P. Insights From Google Play Store User Reviews for the Development of Weight Loss Apps: Mixed-Method Analysis. JMIR Mhealth Uhealth. 2017;5(12):e203. doi: 10.2196/mhealth.8791
- 16 Edwards EA, Lumsden J, Rivas C, Steed L, Edwards LA, Thiyagarajan A, et al. Gamification for health promotion: systematic review of behaviour change techniques in smartphone apps. BMJ Open. 2016;6(10):e012447. doi: 10.1136/bmjopen-2016-012447
- 17 Johnson D, Deterding S, Kuhn KA, Staneva A, Stoyanov S, Hides L. Gamification for health and wellbeing: A systematic review of the literature. Internet Interventions. 2016;6:89-106. doi: 10.1016/j.invent.2016.10.002
- 18 Kamis K, Janevic MR, Marinec N, Jantz R, Valverde H, Piette JD. A study of mobile phone use among patients with noncommunicable diseases in La Paz, Bolivia: implications for mHealth research and development. Global Health. 2015;11(1):30. doi: 10.1186/s12992-015-0115-y
- 19 Rojas Mezarina L, Silva-Valencia J, Escobar-Agreda S, Espinoza Herrera DH, Egoavil MS, Maceda Kuljich M, et al. Need for the Development of a Specific Regulatory Framework for Evaluation of Mobile Health Apps in Peru: Systematic Search on App Stores and Content Analysis. JMIR Mhealth Uhealth. 2020;8(7):e16753. doi: 10.2196/16753
- 20 Kruse C, Betancourt J, Ortiz S, Valdes Luna SM, Bamrah IK, Segovia N. Barriers to the Use of Mobile Health in Improving Health Outcomes in Developing Countries: Systematic Review. J Med Internet Res. 2019;21(10):e13263. doi: 10.2196/13263
- 21 Lim SL, Bentley PJ, Kanakam N, Ishikawa F, Honiden S. Investigating Country Differences in Mobile App User Behavior and Challenges for Software Engineering. IIEEE Trans Software Eng. 2015;41(1):40-64. doi: 10.1109/tse.2014.2360674
- 22 Hui CY, Creamer E, Pinnock H, McKinstry B. Apps to Support Self-Management for People With Hypertension: Content Analysis. JMIR Mhealth Uhealth. 2019;7(6):e13257. doi: 10.2196/13257
- 23 Mendiola MF, Kalnicki M, Lindenauer S. Valuable Features in Mobile Health Apps for Patients and Consumers: Content Analysis of Apps and User Ratings. JMIR mHealth uHealth. 2015;3(2):e40. doi: 10.2196/mhealth.4283
- 24 Dörr M, Weber S, Birkemeyer R, Leonardi L, Winterhalder C, Raichle CJ, et al. iPhone App compared with standard blood pressure measurement –The iPARR trial. American Heart Journal. 2021;233:102-108. doi: 10.1016/j.ahj.2020.12.003
- 25 Schoettker P, Degott J, Hofmann G, Proença M, Bonnier G, Lemkaddem A, et al. Blood pressure measurements with the OptiBP smartphone app validated against reference auscultatory measurements. Sci Rep. 2020;10(1):17827. doi: 10.1038/s41598-020-74955-4
- 26 Degott J, Ghajarzadeh-Wurzner A, Hofmann G, Proença M, Bonnier G, Lemkaddem A, et al. Smartphone based blood pressure measurement: accuracy of the OptiBP mobile application according to the AAMI/ESH/ISO universal validation protocol. Blood Press Monit. 2021;26(6):441-448. doi: 10.1097/mbp.0000000000000556
- 27 Park JYE, Li J, Howren A, Tsao NW, De Vera M. Mobile Phone Apps Targeting Medication Adherence: Quality Assessment and Content Analysis of User Reviews. JMIR Mhealth Uhealth. 2019;7(1):e11919. doi: 10.2196/11919
- 28 Anderson K, Burford O, Emmerton L. Mobile Health Apps to Facilitate Self-Care: A Qualitative Study of User Experiences. PLoS ONE. 2016;11(5):e0156164. doi: 10.1371/journal.pone.0156164
- 29 Sunyaev A, Dehling T, Taylor PL, Mandl KD. Availability and quality of mobile health app privacy policies. Journal of the American Medical Informatics Association. 2015;22(e1):e28-e33. doi: 10.1136/amiajnl-2013-002605
- 30 Benjumea J, Ropero J, Rivera-Romero O, Dorronzoro-Zubiete E, Carrasco A. Privacy Assessment in Mobile Health Apps: Scoping Review. JMIR Mhealth Uhealth. 2020;8(7):e18868. doi: 10.2196/18868
- 31 Motta-Yanac E, Riley V, Ellis N, Gidlow C. Unlocking the Potential of mHealth: Integrating Behaviour Change Techniques in Hypertension App Design. Int J Environ Res Public Health. 2025;22(10):1487. doi: 10.3390/ijerph22101487
- 32 Cao W, Milks MW, Liu X, Gregory ME, Addison D, Zhang P, et al. mHealth Interventions for Self-management of Hypertension: Framework and Systematic Review on Engagement, Interactivity, and Tailoring. JMIR Mhealth Uhealth. 2022;10(3):e29415. doi: 10.2196/29415
- 33 Peng W, Kanthawala S, Yuan S, Hussain SA. A qualitative study of user perceptions of mobile health apps. BMC Public Health. 2016;16(1):1158. doi: 10.1186/s12889-016-3808-0
- 34 Amagai S, Pila S, Kaat AJ, Nowinski CJ, Gershon RC. Challenges in Participant Engagement and Retention Using Mobile Health Apps: Literature Review. J Med Internet Res. 2022;24(4):e35120. doi: 10.2196/35120
- 35 Jakob R, Harperink S, Rudolf AM, Fleisch E, Haug S, Mair JL, et al. Factors Influencing Adherence to mHealth Apps for Prevention or Management of Noncommunicable Diseases: Systematic Review. J Med Internet Res. 2022;24(5):e35371. doi: 10.2196/35371
- 36 Linares Cánovas LP, Herrera Miranda GL, Linares Cánovas LB, Malagón Silva B, Sánchez Muñoz WI, López Ortiz G. The development and validation in hypertensive patients of the Health Belief Model for pharmacological adherence (HBM-FA) scale. South Health and Policy. 2025;4:229. doi: 10.56294/shp2025229
- 37 Díaz Rueda E, Ortiz Suarez C. Tecnologías de la información y comunicación en hipertensión arterial: ensayo clínico controlado. Rev cienc cuidad. 2018;15(2):151-163. doi: 10.22463/17949831.1409
- 38 Almeida TDCF, Sousa MMD, Gouveia BDLA, Almeida AAM, Oliveira SHDS. Protótipo de aplicativo móvel motivacional para pessoas com hipertensão arterial sistêmica. Acta Paulista de Enfermagem. 2021;34:eAPE001055. doi: 10.37689/acta-ape/2021ao001055
- 39 Instituto Dante Pazzanese de Cardiologia. São Paulo, SP, Brasil, Pavanello R, Cardiologia Clínica do Hospital do Coração. São Paulo, SP, Brasil, Albuquerque S, Laboratório Servier do Brasil. Rio de Janeiro, RJ, Brasil., Festa de Vasconcellos J, et al. HIPERTENSÃO E TECNOLOGIA: USO DE SOLUÇÃO DIGITAL E SEU IMPACTO NO ENGAJAMENTO DE PACIENTES E DESFECHOS CLÍNICOS. Rev Bras Hipertens. 2023;30(4):96-101. doi: 10.47870/1519-7522/2023300496-101
- 40 Motta-Yanac E, Riley V, Ellis NJ, Mankoo A, Gidlow CJ. The digital prescription: A systematic review and meta-analysis of smartphone apps for blood pressure control. International Journal of Medical Informatics. 2025;195:105755. doi: 10.1016/j.ijmedinf.2024.105755
- 41 Byambasuren O, Sanders S, Beller E, Glasziou P. Prescribable mHealth apps identified from an overview of systematic reviews. npj Digital Med. 2018;1(1):12. doi: 10.1038/s41746-018-0021-9
- 42 Oyebode O, Alqahtani F, Orji R. Using Machine Learning and Thematic Analysis Methods to Evaluate Mental Health Apps Based on User Reviews. IEEE Access. 2020;8:111141-111158. doi: 10.1109/access.2020.3002176
- 43 Varghese L, Pai RR, Savitha G, Girisha S, Chetty N. Manual annotation based sentiment analysis of user feedback in health and wellness app reviews. Sci Rep. 2025;15(1):44766. doi: 10.1038/s41598-025-28799-5
- 44 West JH, Hall PC, Hanson CL, Barnes MD, Giraud-Carrier C, Barrett J. There’s an App for That: Content Analysis of Paid Health and Fitness Apps. J Med Internet Res. 2012;14(3):e72. doi: 10.2196/jmir.1977
- 45 Zhao J, Freeman B, Li M. Can Mobile Phone Apps Influence People’s Health Behavior Change? An Evidence Review. J Med Internet Res. 2016;18(11):e287. doi: 10.2196/jmir.5692
- 46 Payne HE, Lister C, West JH, Bernhardt JM. Behavioral Functionality of Mobile Apps in Health Interventions: A Systematic Review of the Literature. JMIR mHealth uHealth. 2015;3(1):e20. doi: 10.2196/mhealth.3335
- 47 Alessa T, S Hawley M, Alsulamy N, de Witte L. Using a Commercially Available App for the Self-Management of Hypertension: Acceptance and Usability Study in Saudi Arabia. JMIR Mhealth Uhealth. 2021;9(2):e24177. doi: 10.2196/24177
- 48 Bozorgi A, Hosseini H, Eftekhar H, Majdzadeh R, Yoonessi A, Ramezankhani A, et al. The effect of the mobile “blood pressure management application” on hypertension self-management enhancement: a randomized controlled trial. Trials. 2021;22(1):413. doi: 10.1186/s13063-021-05270-0
- 49 Schmidt-Kraepelin M, Toussaint PA, Thiebes S, Hamari J, Sunyaev A. Archetypes of Gamification: Analysis of mHealth Apps. JMIR Mhealth Uhealth. 2020;8(10):e19280. doi: 10.2196/19280
- 50 Priesterroth L, Grammes J, Holtz K, Reinwarth A, Kubiak T. Gamification and Behavior Change Techniques in Diabetes Self-Management Apps. J Diabetes Sci Technol. 2019;13(5):954-958. doi: 10.1177/1932296818822998
- 51 Tran S, Smith L, El-Den S, Carter S. The Use of Gamification and Incentives in Mobile Health Apps to Improve Medication Adherence: Scoping Review. JMIR Mhealth Uhealth. 2022;10(2):e30671. doi: 10.2196/30671
- 52 Auza-Santiváñez JC, Carías Díaz JA, Vedia Cruz OA, Robles-Nina SM, Sánchez Escalante C, Apaza Huanca B. Gamification in personal health management: a focus on mobile apps. Gamification and Augmented Reality. 2024;2:31. doi: 10.56294/gr202431
- 53 Milne-Ives M, Homer SR, Andrade J, Meinert E. Potential associations between behavior change techniques and engagement with mobile health apps: a systematic review. Front Psychol. 2023;14:1227443. doi: 10.3389/fpsyg.2023.1227443
- 54 Diez-Canseco F, Zavala-Loayza JA, Beratarrechea A, Kanter R, Ramirez-Zea M, Rubinstein A, et al. Design and Multi-Country Validation of Text Messages for an mHealth Intervention for Primary Prevention of Progression to Hypertension in Latin America. JMIR mHealth uHealth. 2015;3(1):e19. doi: 10.2196/mhealth.3874
Declarations
Funding
No financing
Conflict of interest
None
Authorship contributions
Drafting – original draft: Libardo Ramón Polanía, María del Pilar Vargas Escamilla.
Writing–review and editing: Libardo Ramón Polanía, María del Pilar Vargas Escamilla.