
Abstract
Introduction: Gamification is widely tested in mobility interventions, but little is known about how often commercial urban mobility apps declare game elements in Latin America, or whether declaring them relates to user ratings. Methods: Cross-sectional content analysis of listings returned by the public iTunes Search API for six Latin American storefronts. Apps released in 2013-2025 were classified by mobility mode, and declared points, badges, rankings, challenges and rewards were coded by dictionary screen and AI adjudication, pending author verification. Proportions were compared with permutation, Fisher and clustered logistic models; ratings were compared in apps with at least 5 ratings. Results: Of 615 eligible apps, 8 (1.3%; 95% CI 0.7-2.5%) declared at least one element, most often rewards (7 apps). Prevalence differed by mode (permutation p = 0.003) because of carpooling (4 of 52 apps; odds ratio 11.7 versus other modes, 95% CI 2.8-48.0). It did not differ across storefronts (Wald p = 0.655). Among 328 apps with at least 5 ratings, the mean rating difference for gamified apps was 0.19 (95% CI −0.79 to 1.02; p = 0.727), and the number of elements was not associated with ratings (rho = 0.03). Conclusions: Declared gamification was rare in the listings analysed and concentrated in carpooling apps, with no detectable regional or rating differences. The few gamified apps limit precision, and the rating estimates are compatible with differences of up to about one point in either direction.
Keywords
gamification, mobile applications, urban mobility, Latin America, consumer ratings
INTRODUCTION
Gamification is defined as the use of game design elements in contexts that are not games, with the aim of supporting motivation and engagement.(1,2) A scoping review of 280 research papers identified 15 game elements, among which points, badges and leaderboards were the most prevalent.(3) Elements are not interchangeable, since experimental work shows that different design elements produce different effects on motivation,(2) and taxonomies have been proposed to describe them in a consistent way.(4)
In transport and mobility, gamification has been used mainly to change travel behaviour. A systematic review of 49 papers found heterogeneity in objectives, methods and observed evidence, and no consensus on the effects of gamification in the field.(5) A mapping of the transport literature reported that goals and challenges, together with points, were the elements most commonly used.(6) Field studies and prototypes have combined tracking, feedback, challenges, rewards and rankings to promote sustainable modes, for example in smartphone apps for commuter cycling,(7,8) multimodal travel,(9-12) walking and public transport,(13-16) school travel(17) and urban lifestyles.(18) Reviews of persuasive technology and of mobility apps classify the strategies used in this field.(19,20)
Most of this evidence comes from interventions designed and deployed by researchers. Much less is known about what commercial apps already offer to their users. App stores allow such questions to be studied, because every listing declares the features of an app and displays a public rating. Content analyses of store listings have described gamification in health and fitness apps,(21,22) smoking cessation apps,(23) oral hygiene apps(24) and hypertension self-management apps,(25) and have related app features to user ratings.(26,27) Store data are also regional by construction, because users in different countries differ in how they select, price and rate apps.(28) To our knowledge, no equivalent description exists for urban mobility apps in Latin America, a region where public transport, ride-hailing and bike-sharing coexist and where the use of mobility apps is conditioned by digital inequality.(29-32)
Regional studies of mobility services in Latin America have examined ride-hailing adoption and its relation with public transit( 33-35) and satisfaction with bike-sharing,( 36) but they do not describe the app layer through which these services are used. Declared gamification could differ by mobility mode, because modes differ in how often users return to the app, and by country, because markets differ in competition and regulation. It could also be associated with higher ratings if game elements increase satisfaction and engagement,(37,38) although evidence from physical activity apps is mixed.( 39,40)
User ratings are the usual outcome in these analyses, because they are public, comparable across apps and used as a proxy of perceived value, although their validity as a measure of satisfaction is debated.( 22,26,41) The objective was to estimate the prevalence of declared gamification elements in urban mobility app listings of six Latin American App Store storefronts and to examine its variation by mobility mode and storefront and its association with user ratings. Four hypotheses were formulated. H1: the proportion of apps declaring gamification differs across mobility modes. H2: the proportion differs across storefronts. H3: apps declaring gamification have a different mean user rating from apps that do not. H4: the number of declared elements is associated with the mean rating.
METHODS
This was a cross-sectional content analysis of public app listings, reported in line with the STROBE items applicable to descriptive cross-sectional studies. The unit of analysis was the app, identified by its store identifier. For the comparison between storefronts, the unit was the listing, that is, an app in a given storefront. No human participants were involved and no personal data of users were collected; the data are metadata published by developers and aggregate ratings displayed by the store.
Listings were obtained from the public iTunes Search API( 42) for the storefronts of Brazil, Mexico, Colombia, Argentina, Chile and Peru, selected as six large storefronts of the region. The snapshot available from the public API was downloaded programmatically, without a login. For each storefront, 41 search terms in Spanish, Portuguese and English were submitted with the software entity and a limit of 200 results, giving 246 queries. Terms covered public transport (for example transporte público, horários de ônibus, metro), cycling and bike-sharing (bicicleta, ciclovía, ecobici), walking (caminar, caminhada), carpooling (carpool, carona, viajes compartidos), ride-hailing and taxi (taxi, mototaxi, ride hailing) and micromobility (monopatín, patinete, movilidad urbana). Because the API returns at most 200 results per query, the corpus is a search-based sample of listings and not a census of each storefront.
The 41 terms were grouped into six families, with 9 terms for public transport, 8 for cycling and bike-sharing, 5 for walking, 4 for carpooling, 7 for ride-hailing and taxi and 8 for micromobility and related urban mobility topics. Each term was queried separately in each storefront, and responses were stored without modification. Records of the same app returned by several queries within a storefront were merged, and the terms that returned each record were kept. Apps were identified by the store identifier, so that the same app listed in several storefronts could be linked. The release date reported by the API defined the release year, and the price and rating fields were those displayed in the storefront.
Listings were retained when the app was first released between 2013 and 2025, when its primary category was travel, navigation, utilities, lifestyle, business, productivity, social networking or maps, and when its name and description contained vocabulary of at least one mobility mode. A regional filter kept listings with evidence of a Latin American service area (a country or city name, a regional web domain) or, in its absence, a description in Spanish or Portuguese without references to places outside the region.
Mobility mode was assigned from a dictionary of terms in Spanish, Portuguese and English applied to the name (weighted three times) and to the first 400 characters of the description, and the mode with the highest score was retained. Modes were public transit, ride-hailing and taxi, cycling and bike-sharing, walking and carpooling. Two apps whose mode was clearly mis-assigned by the dictionary were reassigned to ride-hailing after reading.
Declared gamification was defined as a listing statement that the app offers points, badges or achievements, rankings, challenges, or rewards linked to use (loyalty points, cashback, prizes or redeemable virtual coins). Generic mentions, such as a company mission, price tiers or discount coupons without a use-linked reward, were not counted. Because coding was done by a single AI coder without a second human coder, inter-coder agreement could not be estimated, and the coding is pending verification by the authors. An app was classified as gamified when it declared at least one element, and the number of elements (0 to 5) was recorded.
Other variables were release year (grouped as 2013-2016, 2017-2020 and 2021-2025), price (free or paid), the number of storefronts in which the app was listed, the average user rating and the number of ratings. For apps listed in several storefronts, the rating and rating count of the storefront with the largest count were used. Gamification was coded at the app level and assigned to all its listings.
No formal sample size calculation was made, because the number of apps was determined by the listings returned by the searches and by the eligibility criteria. Precision is therefore reported through confidence intervals, and the number of gamified apps, which determines the precision of every comparison, is stated with each result.
The search script, the dictionaries, the exclusion list with reasons and the adjudication of gamification candidates were kept as files, and the analysis script was run twice from the stored responses to confirm that all metrics were identical. Candidate texts for gamification and the list of excluded apps are available to the authors for verification. No retrieval dates are reported, because the data describe the snapshot available from the public API.
For the comparison of modes, the variable was the proportion of apps declaring any element, estimated with Wilson 95% confidence intervals. Independence between mode and gamification was tested with the Pearson statistic and a Monte Carlo permutation test (20000 permutations, fixed seed), because expected counts were small. Each mode was compared with all other modes with a sample odds ratio, a Woolf interval (0.5 added to empty cells) and Fisher exact p. Modes with fewer than 5 apps were described but not tested. The decision criterion was a permutation p below 0.05.
For the comparison of storefronts, the variable was the proportion of listings declaring any element. A logistic generalized estimating equation with independence working correlation and standard errors robust to clustering by app estimated odds ratios against Brazil, and a joint Wald test of the five coefficients was the decision criterion. A permutation test across apps, keeping each app's set of storefronts, was run as a check.
For ratings, the variable was the average user rating of apps with at least 5 ratings. The difference in means between gamified and other apps was reported with a percentile bootstrap interval (5000 resamples) and a permutation p, and an adjusted difference was estimated by linear regression with HC3 errors including the base-10 logarithm of the rating count. The model initially planned, with mode, release cohort and price, could not be estimated with so few gamified apps and was replaced by this parsimonious model. Thresholds of at least 1 and at least 25 ratings were used as sensitivity analyses. For the number of elements, Spearman correlation with a bootstrap interval and a permutation p was used. Four hypotheses were tested without correction for multiplicity, and all p values are exploratory. Analyses were done in Python with pandas, SciPy and statsmodels, with fixed seeds, and were reproducible across two runs.
RESULTS
The searches returned 23,217 listings of 7,325 distinct apps. Restricting to the release window left 17,211 listings, the category filter 11,018, the mode filter 7,180 and the regional filter 2,856. The eligibility review excluded 327 of 942 apps, because their service area was outside Latin America (158), they were not urban mobility services (101), they sold intercity tickets (36), they were driver-side apps (25) or they were delivery, air or freight apps (7). The final sample comprised 615 apps and 1,766 listings (Table 1).
Mode | Apps (n) | Released 2021-2025, n (%) | Free of charge, n (%) | Listed in more than one storefront, n (%) | With at least 5 ratings, n (%) | Rating count, median [P25-P75] |
|---|---|---|---|---|---|---|
Public transit | 224 | 134 (59.8) | 223 (99.6) | 92 (41.1) | 172 (76.8) | 77 [5-411] |
Ride-hailing and taxi | 271 | 144 (53.1) | 271 (100.0) | 115 (42.4) | 104 (38.4) | 2 [0-10] |
Cycling and bike-sharing | 67 | 39 (58.2) | 65 (97.0) | 55 (82.1) | 31 (46.3) | 4 [0-44] |
Walking | 1 | 1 (100.0) | 1 (100.0) | 0 (0.0) | 0 (0.0) | 0 [0-0] |
Carpooling | 52 | 41 (78.8) | 52 (100.0) | 25 (48.1) | 21 (40.4) | 3 [0-13] |
All apps | 615 | 359 (58.4) | 612 (99.5) | 287 (46.7) | 328 (53.3) | 6 [0-94] |
Note: Unit: app (one record per app identifier). P25-P75 = interquartile range. Rating count is the highest count among the storefronts where the app was listed. Source: Elaboration of the authors from the snapshot of app listings available from the public iTunes Search API (storefronts BR, MX, CO, AR, CL, PE; apps first released 2013-2025).
Ride-hailing and taxi apps were the most numerous mode (271 apps), followed by public transit (224), cycling and bike-sharing (67) and carpooling (52). Only 1 app was classified as walking. Release years ranged from 2013 to 2025, 99.5% of apps were free, 46.7% were listed in more than one storefront and 28.3% had no ratings.
By release period, 1 gamified apps were first released in 2013-2016, 1 in 2017-2020 and 6 in 2021-2025. Their listings covered carpooling, public transit, ride-hailing and cycling apps, and none was a walking app. The number of listings by storefront was 405 in Brazil, 267 in Mexico, 269 in Colombia, 275 in Argentina, 263 in Chile and 287 in Peru. Apps with at least 5 ratings numbered 328, and the remaining apps had too few ratings for an average to be informative. Among the 8 gamified apps, 5 met this rating threshold.
H1. Mobility mode
Declared gamification was found in 8 of 615 apps (1.3%; 95% CI, 0.7-2.5%). Rewards were the most frequent element (7 apps), and points (2), badges (1), rankings (1) and challenges (1) were each declared by two apps or fewer (Table 2). Gamified apps declared one element in 5 cases, two in 2 and three in 1.
Mode | Apps (n) | Points, n | Badges, n | Rankings, n | Challenges, n | Rewards, n | Any element, n (%) | 95% CI | Odds ratio vs. other modes (95% CI) | Exact p |
|---|---|---|---|---|---|---|---|---|---|---|
Public transit | 224 | 0 | 0 | 1 | 1 | 2 | 2 (0.9) | 0.2-3.2 | 0.58 (0.12-2.89) | 0.717 |
Ride-hailing and taxi | 271 | 0 | 0 | 0 | 0 | 1 | 1 (0.4) | 0.1-2.1 | 0.18 (0.02-1.46) | 0.084 |
Cycling and bike-sharing | 67 | 1 | 0 | 0 | 0 | 0 | 1 (1.5) | 0.3-8.0 | 1.17 (0.14-9.67) | 0.605 |
Walking | 1 | 0 | 0 | 0 | 0 | 0 | 0 (0.0) | 0.0-79.3 | Not estimated (n < 5) | |
Carpooling | 52 | 1 | 1 | 0 | 0 | 4 | 4 (7.7) | 3.0-18.2 | 11.65 (2.82-48.03) | 0.002 |
All apps | 615 | 2 | 1 | 1 | 1 | 7 | 8 (1.3) | 0.7-2.5 |
Note: An app can declare more than one element, so element counts do not add up to the number of apps declaring any element. CI = confidence interval (Wilson). Odds ratios compare each mode with all other modes (Woolf interval, 0.5 added to empty cells; exact Fisher p). The odds ratio was not estimated for modes with fewer than 5 apps. Source: Elaboration of the authors from the snapshot of app listings available from the public iTunes Search API (storefronts BR, MX, CO, AR, CL, PE; apps first released 2013-2025).
The proportion differed across the four modes with at least 5 apps (Pearson chi-square = 18.66, 3 degrees of freedom; permutation p = 0.003). Carpooling had the highest proportion (7.7%; 4 of 52 apps; 95% CI, 3.0-18.2%), and the odds ratio against all other modes was 11.7 (95% CI, 2.8-48.0; Fisher p = 0.002). Public transit (0.9%), ride-hailing (0.4%) and cycling (1.5%) had lower proportions with overlapping intervals. Cramér V was 0.174, and 4 of 8 cells had expected counts below 5. By release cohort, the proportion was 1.1% in 2013-2016, 0.6% in 2017-2020 and 1.7% in 2021-2025.
H2. Storefront
Proportions by storefront ranged from 0.8% in Chile to 1.9% in Colombia (Table 3; Figure 1). Relative to Brazil (1.7%), the odds ratios ranged from 0.44 for Chile (95% CI, 0.13-1.41) to 1.08 for Colombia (95% CI, 0.67-1.74), and no interval excluded 1. The joint Wald statistic was 3.29 on 5 degrees of freedom (p = 0.655). The permutation test across apps gave p = 0.221. A total of 287 apps appeared in more than one storefront.
Storefront | Listings (n) | Any element, n (%) | 95% CI | Odds ratio vs. Brazil (95% CI) | p |
|---|---|---|---|---|---|
Brazil | 405 | 7 (1.7) | 0.8-3.5 | Reference | |
Mexico | 267 | 4 (1.5) | 0.6-3.8 | 0.86 (0.45-1.66) | 0.661 |
Colombia | 269 | 5 (1.9) | 0.8-4.3 | 1.08 (0.67-1.74) | 0.762 |
Argentina | 275 | 3 (1.1) | 0.4-3.2 | 0.63 (0.27-1.48) | 0.288 |
Chile | 263 | 2 (0.8) | 0.2-2.7 | 0.44 (0.13-1.41) | 0.166 |
Peru | 287 | 4 (1.4) | 0.5-3.5 | 0.80 (0.35-1.85) | 0.608 |
Note: Unit: listing (an app listed in several storefronts contributes one listing to each). Odds ratios from a logistic generalized estimating equation with independence working correlation and standard errors robust to clustering by app. CI = confidence interval. Source: Elaboration of the authors from the snapshot of app listings available from the public iTunes Search API (storefronts BR, MX, CO, AR, CL, PE; apps first released 2013-2025).
H3. Declared gamification and rating
Ratings were available for 328 apps with at least 5 ratings (53.3% of apps), of which 5 declared gamification (Table 4). The mean rating was 4.01 in gamified apps and 3.82 in the others. The unadjusted difference was 0.19 (95% CI, −0.79 to 1.02; permutation p = 0.727), and the difference adjusted for rating count was 0.33 (95% CI, −0.83 to 1.49) (Table 5).
Group | Apps (n) | Rating, mean (SD) | Rating, median [P25-P75] |
|---|---|---|---|
Gamification declared | 5 | 4.01 (1.16) | 4.64 [3.44-4.74] |
No gamification declared | 323 | 3.82 (1.10) | 4.32 [3.00-4.70] |
Note: SD = standard deviation; P25-P75 = interquartile range. Ratings are the average user rating shown for the storefront with the highest rating count. Source: Elaboration of the authors from the snapshot of app listings available from the public iTunes Search API (storefronts BR, MX, CO, AR, CL, PE; apps first released 2013-2025).
Estimates were similar with a threshold of at least 1 rating (0.11; 95% CI, −0.73 to 0.80; 6 gamified apps) and at least 25 ratings (0.17; 95% CI, −0.58 to 0.93; 2 gamified apps). The Mann-Whitney p value at the primary threshold was 0.578. All intervals included zero and were wide relative to the 5-point scale.
Specification | Apps (n) | Gamified apps (n) | Difference in mean rating (95% CI) | Permutation p |
|---|---|---|---|---|
At least 5 ratings (primary), unadjusted | 328 | 5 | 0.19 (-0.79 to 1.02) | 0.727 |
At least 5 ratings (primary), adjusted for rating count | 328 | 5 | 0.33 (-0.83 to 1.49) | |
At least 1 rating, unadjusted | 441 | 6 | 0.11 (-0.73 to 0.80) | 0.822 |
At least 1 rating, adjusted for rating count | 441 | 6 | 0.13 (-0.79 to 1.05) | |
At least 25 ratings, unadjusted | 213 | 2 | 0.17 (-0.58 to 0.93) | 0.934 |
At least 25 ratings, adjusted for rating count | 213 | 2 | 0.35 (-1.43 to 2.13) |
Note: Intervals for unadjusted differences are percentile bootstrap intervals (5000 resamples); permutation p from 10000 label permutations. Adjusted estimates come from linear regression with heteroskedasticity-robust (HC3) errors including log10 of the rating count. Source: Elaboration of the authors from the snapshot of app listings available from the public iTunes Search API (storefronts BR, MX, CO, AR, CL, PE; apps first released 2013-2025).
H4. Number of declared elements
Among apps with at least 5 ratings, Spearman rho between the number of elements and the mean rating was 0.03 (95% CI, −0.09 to 0.14; permutation p = 0.571). Only 3 rated apps declared one element, 1 declared two and 1 declared three, so the association rested on 5 gamified apps in total.
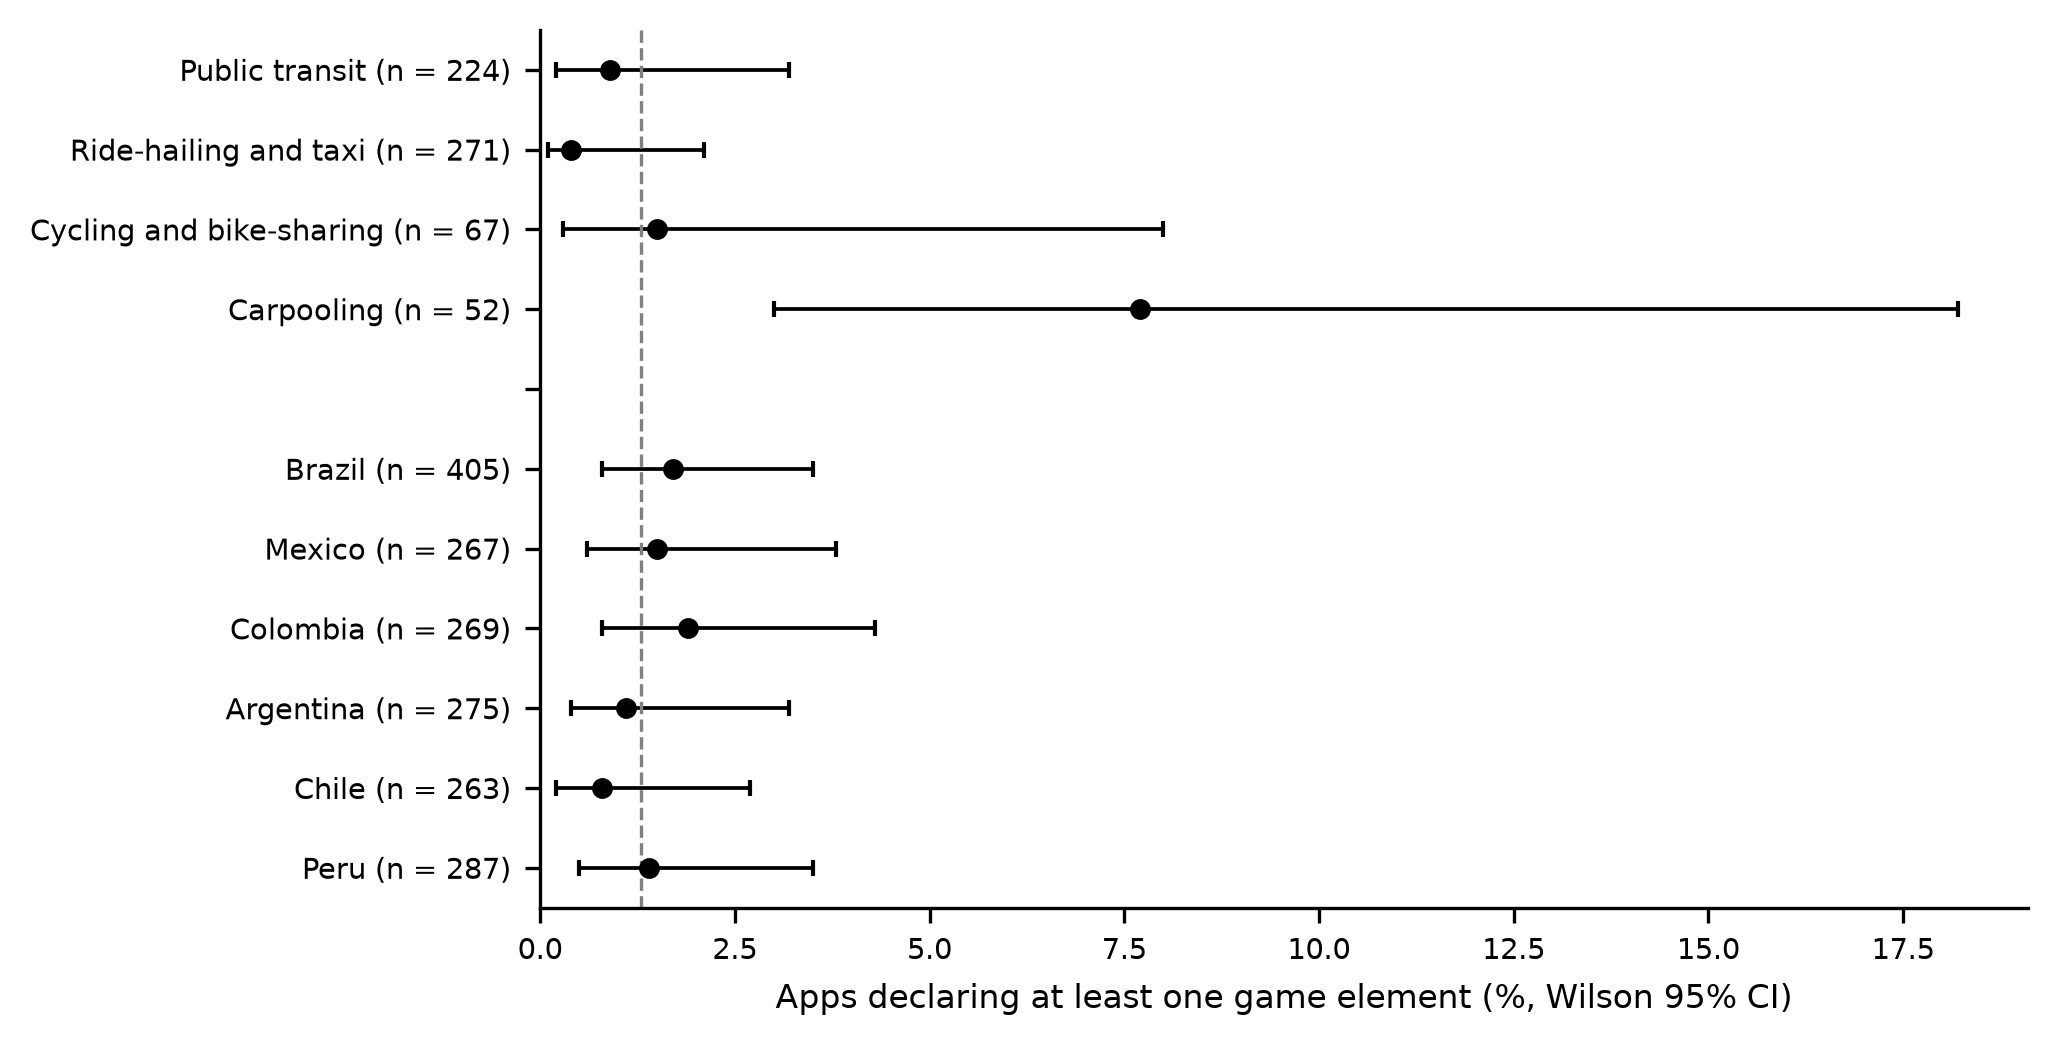
Figure 1. Proportion of apps declaring at least one game element by mobility mode and by storefront.
Note: Points are proportions with Wilson 95% confidence intervals; modes with fewer than 5 apps are not shown. The dashed line marks the overall proportion of apps. Source: Elaboration of the authors from the snapshot of app listings available from the public iTunes Search API.DISCUSSION
Few urban mobility app listings in the six storefronts declared game elements, and these were concentrated in apps for sharing vehicles rather than spread across modes. Consequently, the first hypothesis was supported by the permutation test, whereas the second, third and fourth were not supported, and the estimates for the last two were too imprecise to exclude differences of up to about one point in either direction.
Prevalence and mode
The overall prevalence of 1.3% is lower than figures from other app categories. In line with this contrast, a review of health apps found gamification in 4% of 1680 apps screened,(22) and a review of UK smoking cessation apps reported high levels of gamification in only a small minority.(23) Studies that sampled apps by searching for gamification itself, such as the one on oral hygiene apps, found most apps gamified,(24) and a review of popular health and fitness apps described gamification as widespread.(21) The comparison therefore depends on how apps are sampled and on the category. Our search terms described mobility services and not game features, so the low figure describes mobility apps in general. Listing text also understates what an app does after installation, which is a further reason to read the prevalence as a lower bound of declared features.
The kind of element differs from that in the mobility literature. A mapping of transport studies reports goals, challenges and points as the most used elements,( 6) and a general review lists points, badges and leaderboards as the most prevalent.( 3) Contrary to expectations, rewards were the commonest declared element here, mainly as loyalty credit, cashback or redeemable coins, whereas rankings, badges and challenges were each declared by a single app. This pattern fits commercial incentives better than behaviour-change designs. It is consistent with an experiment in which small financial rewards in a cycling app were more effective than smart gamification( 7) and with a study in which challenges with rewards encouraged cycling in the short term.( 8) The intervention studies of sustainable mobility( 9,10,13-15,18) were run by research teams, and the listings analysed here contained few apps with comparable designs. The one listing that described itself as gamified, with points and levels, belonged to a sustainable mobility project, in line with that research tradition.
The mode difference should be read with care. Carpooling had the highest proportion, and three of its four gamified apps were corporate or university schemes, a setting in which an organisation can fund incentives. The remaining modes had one or two gamified apps each, and the interval for cycling extended far above its point estimate. A permutation p of 0.003 with eight events is sensitive to a single app, and no adjustment for release cohort or price was possible, so the confirmation of the first hypothesis is limited to the crude association. A plausible reason for the carpooling result is that these platforms need drivers and passengers at the same time, and incentives can be used to attract and retain both sides, an explanation that this study did not test. The absence of a trend by release cohort suggests that gamified listings did not become more common in recent years.
Walking was almost absent from the sample, with a single app classified under this mode. The category filter explains part of this result, because apps for walking, running and cycling workouts are usually listed under health and fitness, which was not included, and these are the apps in which gamification has been described most often.( 21,38,40) Pedestrian navigation may be provided inside general maps and transit apps and not as a separate product, which the search terms would not capture. Consequently, the comparison of modes concerns four modes, and conclusions about walking cannot be drawn from these data.
Storefronts
The second hypothesis was not supported. The Wald test (p = 0.655) and the permutation check gave no evidence that declared gamification differs among Brazil, Mexico, Colombia, Argentina, Chile and Peru, and the intervals were compatible with differences in either direction. Survey evidence indicates that app users differ across countries in what they download, how sensitive they are to price and whether they rate apps,( 28) so differences could exist in rating behaviour more than in declared features. In our data, almost half of the apps were listed in several storefronts, and because gamification was coded at the app level, similar proportions across storefronts are partly mechanical. The independent contribution of each country would be better studied with listings that are specific to each market, such as local transit operators available in a single storefront. Regional studies of ride-hailing, transit and bike-sharing analyse cities and systems and not store listings,( 32,33,35) so city-level data could complement store-level data in future work.
Ratings
The third hypothesis was not supported, since gamified apps had a mean rating 0.19 points higher with an interval spanning about one point in each direction. Consistent with this result, a review of health apps with game elements found no correlation between the number of behaviour change techniques and user ratings, with rs = 0.23 and p = 0.07,(22) and the fourth hypothesis was likewise not supported here. Regression studies of health apps show that individual features explain a small share of the variation in ratings, for instance 9.3% across twelve features,(26) and that the store, in-app purchases and advertising relate to ratings and downloads.(27) Ratings may also be a weak indicator of satisfaction, because the sentiment of reviews and the rating given do not always agree,(41) and fake and incentivised reviews exist in app stores.(43) The large share of apps with no ratings, and the very low median rating counts in the ride-hailing and carpooling groups, add noise that a sample of five gamified apps cannot overcome.
Studies that observed higher engagement with gamified apps used surveys of app users and measured need satisfaction, not store ratings,(37,38) and evidence on walking apps suggests that the orientation of the game design, social or fun, matters more than its presence.( 40) Because the effects of gamification in physical activity are mixed( 39) and the transport evidence is heterogeneous,( 5) a null association in store ratings is not surprising.
Another reading is that other attributes drive satisfaction with mobility services in the region. Studies in Latin America relate ride-hailing use to safety, crime and perceptions of public transit(33,34) and examine satisfaction with bike-sharing in relation to road safety, security and fares.( 36) If such factors dominate, a game element would add little to what users value in the app, although our data cannot test this.
Taken together, the pattern is consistent with a market in which game elements are mostly an add-on of loyalty or institutional programmes. Whether this changes with the entry of new micromobility operators cannot be determined without repeated observations over time.
Strengths and limitations
The main strengths are an open and reproducible data source, a multilingual search across six storefronts, a documented eligibility review and sensitivity analyses for ratings. The limitations are listed below, each with the recommendation that would overcome it.
The category filter excluded health and fitness apps, so mobility-related workout apps are outside the scope of this analysis, and a study of that category would complement the present one. The sample came from a search API limited to 200 results per query, so apps ranked low for every term were not captured. Repeating the search with additional terms and with storefront top charts would allow coverage to be estimated. Only the Apple store was analysed, and Android may differ; a parallel Android extraction would show whether the findings depend on the platform. Gamification was derived from what the listing declares, which can differ from what the app does, and installing and inspecting a sample of apps would estimate the agreement between declared and actual elements.
Only 8 apps declared gamification and 5 had at least 5 ratings, so power was low and the adjusted model was limited to the rating count. Future analyses should use corpora with more gamified apps, for example by adding apps identified through their game features, and should pre-specify the adjustment variables. Ratings are snapshot averages that depend on the storefront and the age of the app, and four hypotheses were tested without correction, so all p values are exploratory. The design is cross-sectional, and no causal interpretation of ratings is warranted.
Each hypothesis can be summarised against its decision criterion. The first was confirmed in the crude analysis, with a permutation p below 0.05, but rested on a handful of apps. The second was not sustained, since the joint Wald test was far from the criterion. The third did not hold, as the interval for the rating difference included zero in every specification. The fourth was likewise not supported. Contrary to expectations, no rating advantage was seen for gamified apps, which is also what a review of gamified health apps found when relating game content to ratings,( 22) and the weak links between guideline adherence and gamification reported for smoking cessation apps point in the same direction of modest, non-decisive associations.( 23) These parallels refer to other categories, and the mobility results should be confirmed with larger corpora.
Implications
For developers of mobility apps in the region, the listings show a wide unoccupied space in game design, and the few examples are tied to loyalty schemes and institutional carpooling. For researchers, store listings are a feasible source to monitor what the market offers, provided that sampling and coding are documented. For public agencies that run transit or bike-sharing apps, the scarcity of game elements indicates that incentive designs tested in pilot studies have not yet reached standard applications, and a rating-based evaluation of such designs should wait until a larger number of cases exists.
CONCLUSIONS
The prevalence of declared gamification in urban mobility apps of six Latin American storefronts was low, with a small fraction of apps declaring at least one element and rewards as the commonest element.
The proportion of gamified apps differed across mobility modes and was highest in carpooling apps.
The six storefronts did not differ detectably in the proportion of apps declaring gamification.
User ratings of apps declaring gamification did not differ detectably from those of the other apps, and the number of elements was not associated with ratings, with estimates compatible with differences of up to about one point in either direction.
References
- 1 Huotari K, Hamari J. A definition for gamification: anchoring gamification in the service marketing literature. Electron Markets. 2017;27(1):21-31. doi: 10.1007/s12525-015-0212-z
- 2 Sailer M, Hense JU, Mayr SK, Mandl H. How gamification motivates: An experimental study of the effects of specific game design elements on psychological need satisfaction. Computers in Human Behavior. 2017;69:371-380. doi: 10.1016/j.chb.2016.12.033
- 3 Hallifax S, Altmeyer M, Kölln K, Rauschenberger M, Nacke LE. From Points to Progression: A Scoping Review of Game Elements in Gamification Research with a Content Analysis of 280 Research Papers. Proc ACM Hum-Comput Interact. 2023;7(CHI PLAY):748-768. doi: 10.1145/3611048
- 4 Toda AM, Klock ACT, Oliveira W, Palomino PT, Rodrigues L, Shi L, et al. Analysing gamification elements in educational environments using an existing Gamification taxonomy. Smart Learn Environ. 2019;6(1):16. doi: 10.1186/s40561-019-0106-1
- 5 Avril E, Picco A, Lescarret C, Lemercier C, Arguel A, Caroux L. Gamification in the Transport and Mobility Sector: A Systematic Review. Transportation Research Part F: Traffic Psychology and Behaviour. 2024;104:286-302. doi: 10.1016/j.trf.2024.06.004
- 6 Wang W, Gan H, Wang X, Lu H, Huang Y. Initiatives and challenges in using gamification in transportation: a systematic mapping. Eur Transp Res Rev. 2022;14(1):41. doi: 10.1186/s12544-022-00567-w
- 7 Máca V, Ščasný M, Zvěřinová I, Jakob M, Hrnčíř J. Incentivizing Commuter Cycling by Financial and Non-Financial Rewards. IJERPH. 2020;17(17):6033. doi: 10.3390/ijerph17176033
- 8 Huang B, Thomas T, Groenewolt B, Claasen Y, van Berkum E. Effectiveness of incentives offered by mobile phone app to encourage cycling: A long‐term study. IET Intelligent Trans Sys. 2021;15(3):406-422. doi: 10.1049/itr2.12034
- 9 Cellina F, Bucher D, Veiga Simão J, Rudel R, Raubal M. Beyond Limitations of Current Behaviour Change Apps for Sustainable Mobility: Insights from a User-Centered Design and Evaluation Process. Sustainability. 2019;11(8):2281. doi: 10.3390/su11082281
- 10 Cellina F, Bucher D, Mangili F, Veiga Simão J, Rudel R, Raubal M. A Large Scale, App-Based Behaviour Change Experiment Persuading Sustainable Mobility Patterns: Methods, Results and Lessons Learnt. Sustainability. 2019;11(9):2674. doi: 10.3390/su11092674
- 11 Wells S, Kotkanen H, Schlafli M, Gabrielli S, Masthoff J, Jylhä A, et al. Towards an Applied Gamification Model for Tracking, Managing, & Encouraging Sustainable Travel Behaviours. ICST Transactions on Ambient Systems. 2014;1(4):e2. doi: 10.4108/amsys.1.4.e2
- 12 Millonig A, Mitgutsch K. Playful Mobility Choices: Motivating informed mobility decision making by applying game mechanics. ICST Transactions on Ambient Systems. 2014;1(4):e3. doi: 10.4108/amsys.1.4.e3
- 13 Nakashima R, Sato T, Maruyama T. Gamification Approach to Smartphone-app-based Mobility Management. Transportation Research Procedia. 2017;25:2344-2355. doi: 10.1016/j.trpro.2017.05.234
- 14 Di Dio S, Massa F, Nucara A, Peri G, Rizzo G, Schillaci D. Pursuing softer urban mobility behaviors through game-based apps. Heliyon. 2020;6(5):e03930. doi: 10.1016/j.heliyon.2020.e03930
- 15 Marconi A, Ferron M, Loria E, Massa P. Play&Go, an Urban Game Promoting Behaviour Change for Sustainable Mobility. IxD&A. 2019;40(40):24-45. doi: 10.55612/s-5002-040-002
- 16 Sukmaningsih DW, Abdurachman E, Trisetyarso A, Purwandari B. Integrated Digital Nudge in Gamification for Public Transportation Applications. Information. 2025;16(7):530. doi: 10.3390/info16070530
- 17 University of Ljubljana, Faculty of Arts, Department of Geography, Ljubljana, Slovenia, Rogelj B, Resnik Planinc T, University of Ljubljana, Faculty of Arts, Department of Geography, Ljubljana, Slovenia, Repe B, University of Ljubljana, Faculty of Arts, Department of Geography, Ljubljana, Slovenia, et al. Education for sustainable mobility in Slovenia: Using gamification to influence the travel habits of children. EJG. 2024;15(2):81-93. doi: 10.48088/ejg.b.rog.15.2.081.093
- 18 Luger–Bazinger C, Hornung–Prähauser V. Innovation for Sustainable Cities: The Effects of Nudging and Gamification Methods on Urban Mobility and Sustainability Behaviour. giforum. 2021;1:251-258. doi: 10.1553/giscience2021_02_s251
- 19 Anagnostopoulou E, Bothos E, Magoutas B, Schrammel J, Mentzas G. Persuasive Technologies for Sustainable Mobility: State of the Art and Emerging Trends. Sustainability. 2018;10(7):2128. doi: 10.3390/su10072128
- 20 Casquero D, Monzon A, García M, Martínez O. Key Elements of Mobility Apps for Improving Urban Travel Patterns: A Literature Review. Future Transportation. 2022;2(1):1-23. doi: 10.3390/futuretransp2010001
- 21 Lister C, West JH, Cannon B, Sax T, Brodegard D. Just a Fad? Gamification in Health and Fitness Apps. JMIR Serious Games. 2014;2(2):e9. doi: 10.2196/games.3413
- 22 Edwards EA, Lumsden J, Rivas C, Steed L, Edwards LA, Thiyagarajan A, et al. Gamification for health promotion: systematic review of behaviour change techniques in smartphone apps. BMJ Open. 2016;6(10):e012447. doi: 10.1136/bmjopen-2016-012447
- 23 Rajani NB, Weth D, Mastellos N, Filippidis FT. Use of gamification strategies and tactics in mobile applications for smoking cessation: a review of the UK mobile app market. BMJ Open. 2019;9(6):e027883. doi: 10.1136/bmjopen-2018-027883
- 24 Fijačko N, Gosak L, Cilar L, Novšak A, Creber RM, Skok P, et al. The Effects of Gamification and Oral Self-Care on Oral Hygiene in Children: Systematic Search in App Stores and Evaluation of Apps. JMIR Mhealth Uhealth. 2020;8(7):e16365. doi: 10.2196/16365
- 25 Alessa T, Hawley MS, Hock ES, de Witte L. Smartphone Apps to Support Self-Management of Hypertension: Review and Content Analysis. JMIR Mhealth Uhealth. 2019;7(5):e13645. doi: 10.2196/13645
- 26 Mendiola MF, Kalnicki M, Lindenauer S. Valuable Features in Mobile Health Apps for Patients and Consumers: Content Analysis of Apps and User Ratings. JMIR mHealth uHealth. 2015;3(2):e40. doi: 10.2196/mhealth.4283
- 27 Biviji R, Vest JR, Dixon BE, Cullen T, Harle CA. Factors Related to User Ratings and User Downloads of Mobile Apps for Maternal and Infant Health: A Cross-Sectional Study. JMIR Mhealth Uhealth. 2020;8(1):e15663. doi: 10.2196/15663
- 28 Lim SL, Bentley PJ, Kanakam N, Ishikawa F, Honiden S. Investigating Country Differences in Mobile App User Behavior and Challenges for Software Engineering. IIEEE Trans Software Eng. 2015;41(1):40-64. doi: 10.1109/tse.2014.2360674
- 29 Aprigliano V, Barros GT, Santos MVSM, Toro C, Rojas G, Seriani S, et al. Sustainable Mobility Challenges in the Latin American Context. Sustainability. 2023;15(20):14748. doi: 10.3390/su152014748
- 30 Yañez-Pagans P, Martinez D, Mitnik OA, Scholl L, Vazquez A. Urban transport systems in Latin America and the Caribbean: lessons and challenges. Lat Am Econ Rev. 2019;28(1):15. doi: 10.1186/s40503-019-0079-z
- 31 Santos ICD, Leão NCDA, Silva EED, Silveira GB. Determinants of e-inclusion and digital inequality in the use of urban mobility applications in mobility. RSD. 2022;11(13):e184111335243. doi: 10.33448/rsd-v11i13.35243
- 32 Binatti G, Batalha Y, de Castro J, Oliveira MDS. Latin American bike sharing ecosystem overview: from data collection to implementation model portraits. urbe, Rev Bras Gest Urbana. 2022;14:e20210066. doi: 10.1590/2175-3369.014.e20210066
- 33 Oviedo D, Sabogal-Cardona O, Scholl L. Ready to ride: Security and transit-related determinants of ride-hailing adoption in Latin America. Case Studies on Transport Policy. 2025;22:101608. doi: 10.1016/j.cstp.2025.101608
- 34 de Sá ALS, Lavieri PS, Pitombo CS. Ride-hailing as a safer transport option: Evidence from frequency of use and commuting choices in Brazil. Latin American Transport Studies. 2025;3:100042. doi: 10.1016/j.latran.2025.100042
- 35 Scholl L, Bedoya F, Sabogal-Cardona O, Oviedo D. Making the links between ride-hailing and public transit ridership: Impacts in medium and large Colombian cities. Research in Transportation Business & Management. 2022;45:100901. doi: 10.1016/j.rtbm.2022.100901
- 36 Piedrahita L, Bocarejo J. Bike-Sharing System in Bogotá: Satisfaction and Loyalty in the modal choice of public bicycles. Transportation Research Procedia. 2025;92:15-23. doi: 10.1016/j.trpro.2025.12.070
- 37 Bitrián P, Buil I, Catalán S. Enhancing user engagement: The role of gamification in mobile apps. Journal of Business Research. 2021;132:170-185. doi: 10.1016/j.jbusres.2021.04.028
- 38 Bitrián P, Buil I, Catalán S. Gamification in sport apps: the determinants of users' motivation. EJMBE. 2020;29(3):365-381. doi: 10.1108/ejmbe-09-2019-0163
- 39 Mazeas A, Duclos M, Pereira B, Chalabaev A. Evaluating the Effectiveness of Gamification on Physical Activity: Systematic Review and Meta-analysis of Randomized Controlled Trials. J Med Internet Res. 2022;24(1):e26779. doi: 10.2196/26779
- 40 Tu R, Hsieh P, Feng W. Walking for fun or for “likes”? The impacts of different gamification orientations of fitness apps on consumers’ physical activities. Sport Management Review. 2019;22(5):682-693. doi: 10.1016/j.smr.2018.10.005
- 41 Hazarika B, Chen K, Razi M. Are numeric ratings true representations of reviews A study of inconsistency between reviews and ratings. IJBIS. 2021;38(1):85. doi: 10.1504/ijbis.2021.118637
- 42 Apple Inc. Search API and Lookup API (iTunes Store Search API documentation) [Internet]. 2025. Available from: https://performance-partners.apple.com/search-api
- 43 Martens D, Maalej W. Towards understanding and detecting fake reviews in app stores. Empir Software Eng. 2019;24(6):3316-3355. doi: 10.1007/s10664-019-09706-9
Declarations
Funding
No financing
Conflict of interest
None
Authorship contributions
Drafting – original draft: Carlos Alberto Gómez Cano.
Writing–review and editing: Carlos Alberto Gómez Cano.