

Abstract
Introduction: Location-based augmented reality games send players to parks and public spaces, but open and comparable data on park infrastructure in Latin America are scarce. This study described the change in park and fitness infrastructure mapped in OpenStreetMap in Latin American capital cities and its distribution by income group. Methods: Ecological, repeated cross-sectional study of 20 capital cities, each defined as a 10-km-radius disc. End-of-year snapshots from 2013 to 2025 were obtained from the ohsome API, and income groups from the World Bank. City-level changes were tested with Wilcoxon signed-rank tests, bootstrap confidence intervals and Holm adjustment, and income gradients with Kruskal-Wallis tests and Spearman correlations. Results: Mapped parks per 100 km2 rose from a median of 31.7 to 135.6 (median change 99.6, 95% CI 77.7-226.6), and all 20 cities recorded an increase. Park area share, fitness stations, playgrounds and pitches also increased. Building polygons grew faster than parks, so parks per 10,000 buildings fell. Park area share differed by income group (p = 0.014), whereas park density did not (p = 0.084). Conclusions: Mapped park infrastructure expanded in every capital, but the expansion is inseparable from mapping effort and showed only a weak, imprecise association with income. Open map history can monitor the setting for walking-based augmented reality play if it is validated against official inventories.
Keywords
urban parks, augmented reality, OpenStreetMap, Latin America, income
INTRODUCTION
Location-based augmented reality games turn streets and parks into playing fields. Pokémon GO, the best-known example, requires players to travel to different locations to capture virtual characters.(1) As map data services improve, location-based games are expected to connect more closely with elements of the physical world,(2) and Pokémon GO is credited with bringing augmented reality into mainstream location-based play.(3) Public parks are frequent settings for this play, yet a study of three parks in Kuala Lumpur concluded that existing parks were not designed for it and need spaces and facilities that suit players.(4) Whether such play increases walking remains contested: one early cohort study found a gain of about one thousand daily steps that faded within six weeks,(5) whereas a randomised comparison in college students found no step increase.(6)
The physical setting that supports walking-based play is rarely measured in Latin America. Evidence on green space and health in the region comes mainly from Brazil, Mexico, Colombia and Chile,(7) and reliable, comparable park data remain hard to obtain in Latin American cities.(8) OpenStreetMap offers an open alternative, but its completeness is uneven across places and over time,(9,10) and its edit history can be queried at scale through dedicated tools.(11) The history is therefore both a record of infrastructure and a record of mapping effort, and the two must be read together. Income is a natural axis of comparison, because reviews of cities in the Global South report that people of higher socioeconomic status are usually advantaged in the quantity of green space they can reach.(12) This study aimed to describe how park and fitness infrastructure mapped in OpenStreetMap changed in Latin American capital cities between 2013 and 2025, to compare that change with mapping intensity, and to describe its distribution by World Bank income group.
Capital cities of 20 Latin American countries formed the sample, and end-of-year snapshots of open map history supplied the data. Mapped features were the object of measurement, not built or maintained infrastructure, and the use of augmented reality games was not measured. Park density and park area share were the principal outcomes, and fitness stations, playgrounds and pitches were secondary outcomes.
METHODS
Statistical analysis
The unit of analysis was the capital city. For each indicator, the change between 2013 and 2025 was calculated within each city and summarised as a median with a 95% confidence interval from 10,000 bootstrap resamples (seed 2025). Paired changes were tested with the Wilcoxon signed-rank test, and the five p values were adjusted with the Holm procedure. Differences among income groups were tested with the Kruskal-Wallis test, and the association with the natural logarithm of GNI per capita was estimated with Spearman rank correlation and a bootstrap 95% confidence interval. Ratios of 2025 to 2013 counts were computed only to describe relative gain, because several 2013 counts were small. Because the number of cities was small, effect sizes and intervals were prioritised over significance thresholds, and the significance level was set at 0.05 for two-sided tests. Counts and densities were not modelled with parametric methods, because distributions were right-skewed and several indicators contained zeros.
Two sensitivity analyses were specified in the protocol before the results were inspected. The first repeated the main analysis with a 5-km radius. The second expressed park counts per 10,000 building polygons, which adjusts for overall mapping intensity, and correlated the change in park density with the change in building density. The protocol, the analysis script and the extracted series were stored so that every figure in this report could be regenerated, and two consecutive runs produced identical outputs. Analyses used Python with NumPy, SciPy, pandas and Matplotlib.
Design and data sources
This was an ecological, repeated cross-sectional study of the capital cities of Argentina, Bolivia, Brazil, Chile, Colombia, Costa Rica, Cuba, the Dominican Republic, Ecuador, El Salvador, Guatemala, Haiti, Honduras, Mexico, Nicaragua, Panama, Paraguay, Peru, Uruguay and Venezuela. La Paz was used for Bolivia because it is the seat of government and the capital recorded by the World Bank. Each city was defined as a disc with a 10-km radius (314.2 km2) centred on the coordinates returned by the OpenStreetMap Nominatim geocoder for the capital name and country. The radius was fixed in the protocol, and a 5-km disc was reserved for sensitivity analysis. A fixed radius was chosen because administrative boundaries in OpenStreetMap differ widely in extent and administrative level among these cities, which would make densities incomparable.
Historical data came from the ohsome API, which gives programmatic access to the OpenStreetMap History Database.(11) For each year from 2013 to 2025, the state of the map at the end of that year was queried, producing 13 snapshots per city. Income group and GNI per capita (Atlas method) came from the World Bank Open Data API.(13) Both services are open, and both were queried programmatically without a login. The OpenStreetMap data are published under the Open Database Licence by the OpenStreetMap contributors.
Variables
Parks were features tagged leisure=park of any geometry type, counted per 100 km2. Park area share was the area of park polygons, clipped to the disc, as a percentage of the disc area. Fitness stations, playgrounds and pitches were features tagged leisure=fitness_station, leisure=playground and leisure=pitch, expressed per 100 km2. Building density was the number of building polygons per km2 and served as a proxy for overall mapping intensity. Pedestrian path length was listed as a secondary outcome in the protocol but was not extracted, because the corresponding queries exceeded practical time limits of the public API, and this amendment was recorded. Walking-related annotations in OpenStreetMap have also been reported to be inconsistent across cities.(14)
Income group was the World Bank classification returned by the API and was applied to all years, so it describes the country as classified for the most recent data and not at each earlier date. GNI per capita was the 2025 value, which was unavailable for Cuba.
Data quality control
Each city-indicator series (nine indicator types in 20 cities, counting the 5-km series) was checked for completeness before analysis. All 180 series contained 13 annual values, and 0 values were missing. The geocoder returned an administrative boundary for some cities and a place node for others, so the centre is the point returned by the geocoder and may not coincide with the main square. Features tagged as parks were counted whatever their geometry, whereas area was computed for polygons only. Counts were not de-duplicated across overlapping park polygons, which can inflate density where a large park is mapped as several adjoining polygons.
Ethical aspects
The study analysed aggregated, openly available geographic data and involved no human participants and no personal data.
RESULTS
Mapped parks per 100 km2 rose from a median of 31.7 in 2013 to 135.6 in 2025 across the 20 capitals (median change 99.6, 95% CI 77.7-226.6, Holm-adjusted p <0.001; Table 1). Every city recorded an increase, so 20 of 20 cities moved in the same direction. The median city held 4.9 times its 2013 park count at the end of 2025. Park area share increased from 0.70% to 1.59%, a gain of 0.64 percentage points (95% CI 0.28-1.06, Holm-adjusted p <0.001). One city lost park area over the period. The relative gain varied widely: parks at least doubled in 16 cities, increased fivefold in 10 and tenfold in 3, and the ratio ranged from 1.7 to 14.7. Cities with higher park density in 2013 gained more (Spearman rho = 0.63, p = 0.003), so the gap widened. The 2013 and 2025 densities were strongly correlated (rho = 0.79, p <0.001). In 2025, park density ranged from 19.1 in Port-au-Prince to 1,021 in Lima, and park area share from 0.15% in Tegucigalpa to 5.32% in Santiago.
Indicator | 2013, median [IQR] | 2025, median [IQR] | Change, median (95% CI) | Cities with increase, n | Holm p |
|---|---|---|---|---|---|
Mapped parks per 100 km2 | 31.7 [11.3-79.3] | 135.6 [85.5-341.1] | 99.6 (77.7 to 226.6) | 20/20 | <0.001 |
Park area share, % | 0.70 [0.31-2.87] | 1.59 [1.00-3.56] | 0.64 (0.28 to 1.06) | 19/20 | <0.001 |
Fitness stations per 100 km2 | 0.0 [0.0-0.0] | 7.6 [1.8-19.2] | 7.6 (2.5 to 13.8) | 18/20 | <0.001 |
Playgrounds per 100 km2 | 3.7 [1.0-8.1] | 26.6 [9.4-59.9] | 23.6 (10.3 to 47.4) | 20/20 | <0.001 |
Pitches per 100 km2 | 43.8 [13.3-59.4] | 202.8 [126.7-444.2] | 150.9 (107.9 to 343.1) | 20/20 | <0.001 |
Note: Densities refer to a 10-km-radius disc (314.2 km2). IQR = interquartile range; CI = bootstrap confidence interval of the median city-level change; Holm p = Wilcoxon signed-rank p value adjusted across five indicators.
The trajectory was steep before 2019 and flat afterwards (Figure 1). By 2019 the all-city median reached 129.6 parks per 100 km2, which was 94% of the total gain. The largest single-year rise in the median occurred in 2019, at 39.0 parks per 100 km2. The high-income group ended at 322.6 parks per 100 km2, the upper-middle group at 175.1 and the lower-middle group at 75.1. In 2013 the medians had been 31.0, 65.3 and 12.4, so the high-income group started below the upper-middle group and overtook it. Median gains were 273.0, 105.7 and 53.8 parks per 100 km2, respectively.
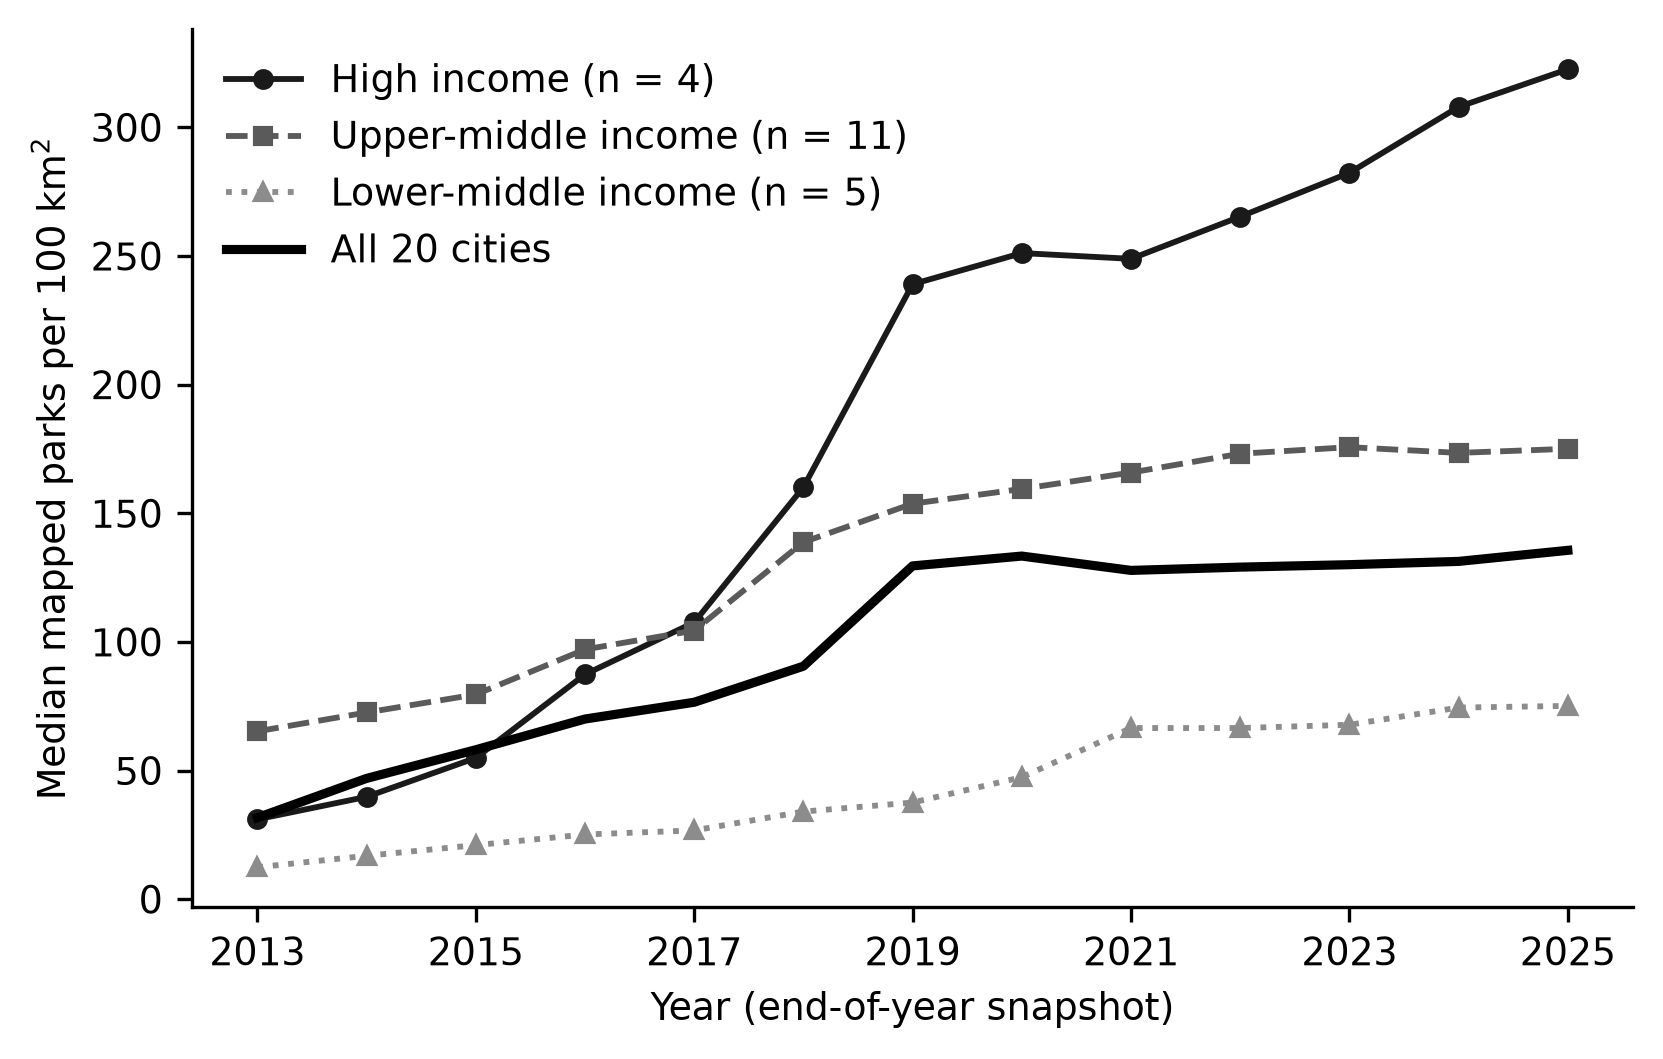
Figure 1. Median number of mapped parks per 100 km2 in 20 Latin American capital cities by World Bank income group, 2013 to 2025.
Note: End-of-year snapshots within 10 km of each city centre. The thick line is the median of all 20 cities.Fitness stations were almost absent in 2013, and 19 of 20 cities had none. The 20 cities together held 3 stations then and 874 in 2025. The median density reached 7.6 stations per 100 km2 (median change 7.6, 95% CI 2.5-13.8, Holm-adjusted p <0.001). In 2025, 2 cities still recorded no station. Playground density rose from 3.7 to 26.6 per 100 km2 (median change 23.6, 95% CI 10.3-47.4). Pitch density increased from 43.8 to 202.8 per 100 km2 (median change 150.9, 95% CI 107.9-343.1). Both increases were present in all 20 cities. The cities together held 16,086 parks covering 141 km2 in 2025, which gives a mean of 0.9 ha of mapped park polygon per mapped park.
Building polygons grew faster than parks. Their median density rose from 4.0 to 116.5 per km2, and the total count increased from 53,643 to 1,205,211. Parks per 10,000 buildings fell from a median of 1,196 to 142 (median change −1,102, 95% CI −1,513 to −364). The ratio decreased in 19 of 20 cities. The change in park density was not correlated with the change in building density (Spearman rho = 0.22, 95% CI −0.31 to 0.71, p = 0.342). The 5-km radius gave the same direction: the median change was 179.5 parks per 100 km2 (95% CI 124.8-283.3), and all 20 cities increased. The 2025 park densities of the two radii were strongly correlated (rho = 0.93). Within 5 km, fitness station density rose by a median of 9.5 per 100 km2 (95% CI 3.8-23.6), with an increase in 16 cities, and playground density rose by 36.3 (95% CI 19.1-84.0). Both changes were larger than the corresponding 10-km changes.
Park area share differed among income groups in 2025 (Kruskal-Wallis H = 8.6, 2 degrees of freedom, p = 0.014; Table 2). Its median was 3.3% in upper-middle income capitals, 1.8% in high-income capitals and 0.5% in lower-middle income capitals. Park density did not differ significantly (H = 5.0, p = 0.084), and neither did its change (p = 0.171). The rank correlation of 2025 park density with log GNI per capita was 0.47 (95% CI −0.09 to 0.86, p = 0.044, n = 19). For park area share it was 0.61 (95% CI 0.08-0.87, p = 0.006). Playground density and pitch density were correlated more weakly with income (rho = 0.43, p = 0.068, and rho = 0.23, p = 0.344). Fitness station density, which peaked in Buenos Aires at 56.7 per 100 km2, showed a weaker, non-significant correlation (rho = 0.43, 95% CI −0.07 to 0.77, p = 0.069). The gradient in park area share was already present in 2013 (rho = 0.53, p = 0.020).
Income group | Cities, n | Parks per 100 km2, median [range] | Park area share, %, median [range] | Fitness stations per 100 km2, median [range] | Change in parks per 100 km2, median [range] |
|---|---|---|---|---|---|
High | 4 | 322.6 [24.2-499.7] | 1.8 [1.1-5.3] | 6.2 [1.9-33.4] | 273.0 [13.4-445.3] |
Upper-middle | 11 | 175.1 [85.9-1020.8] | 3.3 [0.8-5.3] | 10.5 [0.3-56.7] | 105.7 [55.1-507.1] |
Lower-middle | 5 | 75.1 [19.1-335.5] | 0.5 [0.2-1.1] | 7.0 [0.0-9.2] | 53.8 [7.6-283.3] |
Note: Medians with ranges across cities. Densities refer to a 10-km-radius disc. No low-income capital was included.
The sample comprised 20 capitals: 4 high-income, 11 upper-middle income and 5 lower-middle income, and none low-income (Table 3). Park density change ranged from 7.6 per 100 km2 in Port-au-Prince to 507.1 in Lima. GNI per capita was available for 19 cities.
City | Country | Income group | GNI per capita, US$ | Parks 2013, n | Parks 2025, n | Fitness stations 2013, n | Fitness stations 2025, n | Playgrounds 2013, n | Playgrounds 2025, n |
|---|---|---|---|---|---|---|---|---|---|
Buenos Aires | Argentina | Upper-middle | 14650 | 505 | 1104 | 0 | 178 | 51 | 456 |
La Paz | Bolivia | Lower-middle | 4420 | 164 | 1054 | 0 | 26 | 11 | 252 |
Brasília | Brazil | Upper-middle | 10550 | 53 | 299 | 0 | 54 | 20 | 167 |
Santiago | Chile | High | 16960 | 289 | 1570 | 3 | 105 | 72 | 644 |
Bogotá | Colombia | Upper-middle | 7900 | 831 | 2302 | 0 | 93 | 176 | 696 |
San José | Costa Rica | High | 17930 | 161 | 1560 | 0 | 10 | 27 | 79 |
La Habana | Cuba | Upper-middle | NA | 294 | 550 | 0 | 33 | 3 | 60 |
Santo Domingo | Dominican Republic | Upper-middle | 10620 | 205 | 378 | 0 | 3 | 2 | 16 |
Quito | Ecuador | Upper-middle | 6890 | 105 | 675 | 0 | 16 | 22 | 112 |
San Salvador | El Salvador | Upper-middle | 5410 | 28 | 360 | 0 | 1 | 3 | 20 |
Ciudad de Guatemala | Guatemala | Upper-middle | 6360 | 91 | 385 | 0 | 5 | 13 | 54 |
Port-au-Prince | Haiti | Lower-middle | 2010 | 36 | 60 | 0 | 0 | 4 | 6 |
Tegucigalpa | Honduras | Lower-middle | 3270 | 18 | 264 | 0 | 0 | 1 | 8 |
Mexico City | Mexico | Upper-middle | 13730 | 236 | 1061 | 0 | 173 | 30 | 346 |
Managua | Nicaragua | Lower-middle | 2850 | 94 | 236 | 0 | 29 | 25 | 96 |
Panama City | Panama | High | 19140 | 33 | 467 | 0 | 6 | 2 | 79 |
Asunción | Paraguay | Upper-middle | 6750 | 28 | 270 | 0 | 12 | 2 | 25 |
Lima | Peru | Upper-middle | 8430 | 1614 | 3207 | 0 | 79 | 12 | 163 |
Montevideo | Uruguay | High | 24020 | 34 | 76 | 0 | 29 | 9 | 88 |
Caracas | Venezuela | Lower-middle | 3860 | 39 | 208 | 0 | 22 | 7 | 31 |
Note: GNI = gross national income, Atlas method, 2025; NA = not available in the World Bank API. Counts are features tagged leisure=park, leisure=fitness_station and leisure=playground.
DISCUSSION
The main implication is that the mapped physical setting for walking-based augmented reality play in Latin American capitals is much denser in 2025 than in 2013, although the data cannot say how much of that density is new infrastructure and how much is new mapping. Designers who place game content on open map data benefit directly from this growth, because location-based games are expected to rely increasingly on map data services and on elements of the physical world.(2) A park that exists in the map can host a point of interest, whereas a park that exists only on the ground cannot. The increase in parks, playgrounds, pitches and fitness stations in all or nearly all cities therefore describes a growing digital substrate for such games, and it is a more modest statement than a claim about built infrastructure.
The comparison with building polygons explains why the second reading is the safer one. Buildings were mapped far faster than parks, so parks per 10,000 buildings fell in almost every city. This pattern matches what the history of OpenStreetMap predicts: contributions grow unevenly in space and time, with abrupt rises caused by external data imports, mass contributions or collective mapping events.(15) Work on Brazilian cities has likewise treated the temporal pattern of contributions as heterogeneous within a city and sensitive to the size of the grid cell used to observe it.(16) Early work showed how quickly volunteers can cover a territory, with about 29% of the area of England captured in four years,(17) and a German study of building footprints found that the rate of new input was already slowing in 2012.(18) The flattening of the all-city median after 2019 in our data fits the second pattern, although we did not test it against a mechanism.
Four explanations for the rise in mapped parks deserve to be kept apart. Parks may have been created, existing parks may have been drawn for the first time, tagging may have shifted toward the leisure=park tag, and external imports or organised mapping events may have added features in bulk. Only the first is a change in infrastructure. History-based tools were built to assess the intrinsic quality of OpenStreetMap for a given region,(19) and an analysis that follows edits and contributors could separate some of these explanations. Humanitarian mapping has altered the completeness of urban building data in some regions,(9) so organised effort is a realistic candidate. Our aggregate counts cannot discriminate among the four, which is why we describe the change as one in mapped infrastructure.
Cities that started with more mapped parks gained more, and the gap between them widened. This divergence resembles the concentration of mapping capacity reported in early analyses of contributor activity: only 38% of registered members had made at least one edit, and a small share contributed productively.(20) The pattern is compatible with a cumulative process in which active local communities map more of everything, parks included, but our design cannot separate community size from real differences in park supply.
Mapping effort is also unequal across countries. A global assessment of urban building data found that completeness exceeded 80% in only a minority of urban centres, that it remained below 20% in many more, and that inequalities have receded in part because of humanitarian mapping.(9) In a developing-country capital, coverage of roads in OpenStreetMap degraded from the centre towards rural areas, and in large informal settlements OpenStreetMap exceeded the authoritative datasets.(21) Our 10-km discs mix centres and peripheries, so city-level densities average these gradients. The strong agreement between the 5-km and 10-km densities suggests that the ranking of cities was not an artefact of the radius, although it does not rule out an artefact of mapping effort. For parks specifically, a study of Brazilian capitals found better agreement between official park data and OpenStreetMap polygons than with Google Maps points combined with OpenStreetMap, although the volunteer data identified fewer parks than the official inventories.(8) That result supports the use of OpenStreetMap for parks and also warns against reading counts as complete.
Counts and areas tell different stories, and the difference matters for how the maps would be used. The total mapped park area divided by the number of mapped parks gave less than one hectare per park, whereas the median official park in Brazilian capitals covered 0.07 km2, or 7 ha, in a harmonised national dataset.(8) The OpenStreetMap tag therefore captures many small green spaces that official inventories may not list, and park density is partly a measure of how finely contributors subdivide and tag small public spaces. Park area share is the less sensitive indicator to that practice, which may explain why it showed the clearer relation with income. Tagging practice in OpenStreetMap is known to vary among contributors and cities,(22) and our design cannot separate tagging style from supply.
The income gradient was weak and depended on the outcome. Park area share differed among groups, but the order was not monotonic, because upper-middle income capitals had the highest median and high-income capitals the second highest. Park density did not differ significantly, and its correlation with GNI per capita had a confidence interval that included zero. Reviews of green space access in the Global South report that people of higher socioeconomic status are advantaged in most cases for green space quantity,(12) and a global mapping of inequity studies identifies large cities in low- and middle-income countries as particularly affected.(23) Our result is compatible with those reviews in direction for park area share but not in strength for park density. The high-income group started in 2013 below the upper-middle group and ended above it, so the higher median density of the high-income group in 2025 came from faster growth and not from a lasting head start. Three differences may explain the gap. Income was measured at country level, whereas the reviews describe neighbourhood-level socioeconomic status. Our density is a count of mapped objects, which is sensitive to how large parks are split into polygons. The sample had four, eleven and five cities per group, which leaves little power. A Latin American analysis of 371 cities found that education, street intersection density and population density were the most important drivers of park availability, and that climate had the largest influence on green space quantity.(24) That study suggests that city-level income should not be expected to explain park supply on its own. At neighbourhood scale, a Colombian study found that higher socioeconomic level was associated with accessibility and general park quality, and marginally with walking paths, whereas lower socioeconomic level was associated with sports courts.(25) Our pitch density increased in every city, which is consistent with a broad base of sports provision, but we could not stratify it within cities.
The near absence of fitness stations in 2013 needs a separate reading. It may reflect either a lack of outdoor equipment or a limited use of the tag at that time, and the data cannot separate the two. By 2025 the median city had 7.6 stations per 100 km2, and 2 cities still had none, so any statement about outdoor exercise equipment as a driver of augmented reality play would rest on very few mapped objects in many capitals.
Whether the infrastructure we mapped supports physical activity cannot be answered with these data, and the available evidence is mixed. In a multicentre study in eight Latin American countries, being within a 20-minute walk of sport facilities or children's playgrounds was associated with higher odds of moderate-to-high physical activity, while most respondents judged their neighbourhood design inadequate for walking or cycling.(26) In Tijuana, by contrast, the presence of public spaces within 400 m was associated with higher odds of low physical activity among women, and the authors suggested that other elements of the urban environment may matter more.(27) Accessibility results in four Latin American cities were also uneven: access within 15 minutes was good in three of the four cities, but longer for public spaces with vegetation.(28) Infrastructure counts such as ours are therefore a necessary condition for use and not a sufficient one. Temporary arrangements are invisible in map history, even though recreational street closures in Latin American cities have been shown to bring participants into neighbourhoods of different socioeconomic status in Bogotá and Cali.(29) The review by Rueda and colleagues, which found 19 epidemiological studies on green space and health in the region, concentrated in four countries,(7) also implies that most countries in our sample are absent from that evidence base, so local epidemiological evidence to link to their mapped parks is largely lacking.
For augmented reality games the infrastructure question is specific. A field experiment with a walking feature of Pokémon GO found that proximity to population concentrations and in-game rewards drove the popularity of routes, and that urban routes were more popular than routes in nature.(30) If that finding transfers to Latin American capitals, the dense urban park networks we describe matter more than remote green areas. Evidence on the behavioural effect is mixed. A difference-in-differences study estimated about 955 additional daily steps in the first week after installation, and the increase faded by the sixth week.(5) A meta-analysis pooled an increase of 1,446 steps per day, with substantial heterogeneity.(1) A randomised study in college students found no increase,(6) and on a greenway, players walked more slowly and spent less time in moderate-to-vigorous activity than non-players.(31) Among Mexican users, self-reported walking time increased after starting to play.(32) A systematic review in children and adolescents concluded that the effect on activity tended to be positive but came from non-randomised designs with heterogeneous measures.(33) Safety is a second design concern, because the game has been linked to distracted drivers and pedestrians.(34) The parks in our maps are the places where such risks and benefits would play out, but we have no evidence of game use in them.
Several strengths follow from the design. All data were open and retrieved programmatically, the history tools allow every number to be regenerated,(11) and history-based approaches are an established way to assess the quality of OpenStreetMap data.(19) The sample covered 20 capitals, including countries that are absent from most regional evidence, and the sensitivity analyses used a second radius and an adjustment for mapping intensity. The protocol was written before the full set of series was analysed, and no indicator was dropped after its results were seen. With 20 cities, however, the p values should be read as descriptive summaries and not as tests of a population of capitals, because the cities are the whole set of capitals and not a random sample from a larger universe.
Several limitations qualify the findings, and each suggests a next step. First, the principal limitation is that mapped features reflect both real change and mapping effort; the building-based adjustment is a crude proxy, and tagging practice for features varies among contributors.(22) Studies should pair map history with official park inventories or satellite-derived green space, as has been done for public green space in a European city,(10) and should report the share of mapped features that can be matched to an official record. Quality assessment methods for volunteered geographic information have been classified by the type of data they address,(35) and benchmarking against national datasets has been proposed for point features;(36) both would complement the history-based approach used here. Second, discs of 10 km are not municipalities, so peripheral areas and neighbouring jurisdictions are included, and the results are not statements about administrative units. Future work should repeat the analysis with harmonised official boundaries and report densities per resident, which requires population grids that we did not use. Third, income was measured at country level with the most recent classification applied to all years, and the 20 cities fall into three groups of four, eleven and five. Studies should extend the design to the hundreds of Latin American cities beyond the capitals, whose built-environment profiles are heterogeneous,(37) and should use neighbourhood-level socioeconomic indicators. Fourth, the data describe presence and not quality, safety, lighting or accessibility, and they say nothing about augmented reality game use. Studies should link the same maps with game activity or step data and with field audits of park quality. Fifth, year-end snapshots hide deletions, merges and corrections within a year, so a decrease between snapshots may reflect cleaning and not loss; annual or quarterly series with edit counts would allow these events to be identified. Sixth, capitals are not representative of other cities in their countries, and mapping activity in secondary cities may follow a different course, so the findings should not be extended to them without new data.
The unequal pattern also has an access dimension that we did not measure. A game that depends on mapped places will offer fewer destinations in cities where fewer parks and playgrounds are mapped, and our lower-middle income capitals had the lowest medians. We did not measure smartphone ownership, connectivity or safety, which would also shape who can play, so the figures describe the supply of mapped places and not the opportunity to play.
For municipal planners, who often lack a harmonised park inventory, the practical implication is that open map history can serve as a low-cost monitoring layer for parks and recreation facilities, provided it is validated against official inventories and not used as a count of record. For developers of location-based augmented reality games in Latin America, the maps show where the setting is already documented and where it is not, and the lower-middle income capitals with sparse mapped parks are the places where game design should not assume that map-based content will be well supported. A harmonised procedure to access, collect, verify and harmonise park data has been described for Brazilian capitals, and it stresses that reliable park spatial data are needed both for health research and for city officials.(8) Extending that procedure to the other capitals in this study, and combining the resulting inventories with open map history, park audits and game usage data, would turn this description of the setting into a test of whether infrastructure shapes play.
CONCLUSIONS
Mapped park density and park area share increased between 2013 and 2025 in nearly all of the 20 Latin American capitals studied, and the increase in parks was present in every city. Fitness stations, playgrounds and pitches also increased, with fitness stations rising from almost none. Park area share differed among income groups without a monotonic order, park density did not differ significantly, and the rank correlations with GNI per capita were imprecise. Building polygons were mapped faster than parks, so the growth in mapped parks cannot be read as growth in built infrastructure without validation against official inventories.
References
- 1 Khamzina M, Parab KV, An R, Bullard T, Grigsby-Toussaint DS. Impact of Pokémon Go on Physical Activity: A Systematic Review and Meta-Analysis. American Journal of Preventive Medicine. 2020;58(2):270-282. doi: 10.1016/j.amepre.2019.09.005
- 2 Laato S, Söbke H, Baer MF. Augmented future: tracing the trajectory of location-based augmented reality gaming for the next ten years. i-com. 2024;23(2):189-203. doi: 10.1515/icom-2024-0018
- 3 Alha K, Leorke D, Koskinen E, Paavilainen J. Augmented play: An analysis of augmented reality features in location-based games. Convergence: The International Journal of Research into New Media Technologies. 2023;29(2):342-361. doi: 10.1177/13548565231156495
- 4 Fadzidah Abdullah, Mohd Faredzuan Mohd Noor, Mohd Raziff Abd Razak. Future Public Parks: Integrating Facilities for Locative Augmented Reality Games. ARASET. 2023;33(1):197-207. doi: 10.37934/araset.33.1.197207
- 5 Howe KB, Suharlim C, Ueda P, Howe D, Kawachi I, Rimm EB. Gotta catch’em all! Pokémon GO and physical activity among young adults: difference in differences study. BMJ. 2016;355:i6270. doi: 10.1136/bmj.i6270
- 6 Schade SA, Mahoney JM, Spotts AV, Greenauer N, Veerabhadrappa P. Pokémon Go did not increase step count or distance travelled among college students. Hum Mov. 2020;21(2):64-70. doi: 10.5114/hm.2020.89916
- 7 Rojas-Rueda D, Vaught E, Buss D. Why a New Research Agenda on Green Spaces and Health Is Needed in Latin America: Results of a Systematic Review. IJERPH. 2021;18(11):5839. doi: 10.3390/ijerph18115839
- 8 Slovic AD, Kanai C, Marques Sales D, Carnavalli Rocha S, de Souza Andrade AC, Martins LS, et al. Spatial data collection and qualification methods for urban parks in Brazilian capitals: An innovative roadmap. PLoS ONE. 2023;18(8):e0288515. doi: 10.1371/journal.pone.0288515
- 9 Herfort B, Lautenbach S, Porto de Albuquerque J, Anderson J, Zipf A. A spatio-temporal analysis investigating completeness and inequalities of global urban building data in OpenStreetMap. Nat Commun. 2023;14(1):3985. doi: 10.1038/s41467-023-39698-6
- 10 Ludwig C, Hecht R, Lautenbach S, Schorcht M, Zipf A. Mapping Public Urban Green Spaces Based on OpenStreetMap and Sentinel-2 Imagery Using Belief Functions. IJGI. 2021;10(4):251. doi: 10.3390/ijgi10040251
- 11 Raifer M, Troilo R, Kowatsch F, Auer M, Loos L, Marx S, et al. OSHDB: a framework for spatio-temporal analysis of OpenStreetMap history data. Open geospatial data, softw stand. 2019;4(1):3. doi: 10.1186/s40965-019-0061-3
- 12 Rigolon A, Browning MHEM, Lee K, Shin S. Access to Urban Green Space in Cities of the Global South: A Systematic Literature Review. Urban Science. 2018;2(3):67. doi: 10.3390/urbansci2030067
- 13 World Bank. World Bank country classification by income and GNI per capita, Atlas method (World Bank Open Data API) [Internet]. 2025. Available from: https://api.worldbank.org/v2/country?format=json&per_page=300
- 14 National Technical University of Athens, Greece. Utilizing OpenStreetMap data to measure and compare pedestrian street lengths in 992 cities around the world. EJG. 2022;13(2):127-141. doi: 10.48088/ejg.a.bar.13.2.127.138
- 15 Elias ENN, Amorim FR, Schmidt MAR, Camboim SP. Exploring spatio-temporal patterns of OpenStreetMap (OSM) contributions in heterogeneous urban areas. Bol Ciênc Geod. 2023;29(2):e2023005. doi: 10.1590/s1982-21702023000200005
- 16 Peterlini TB, Schmidt MAR, Elias ENN, Camboim SP, Paiva CDA. Identifying Temporal Patterns of Contributions to OpenStreetMap in Brazilian Cities: The Role of Cell Size. Abstr Int Cartogr Assoc. 2023;6:1-3. doi: 10.5194/ica-abs-6-197-2023
- 17 Haklay M. How Good is Volunteered Geographical Information? A Comparative Study of OpenStreetMap and Ordnance Survey Datasets. Environ Plann B Plann Des. 2010;37(4):682-703. doi: 10.1068/b35097
- 18 Hecht R, Kunze C, Hahmann S. Measuring Completeness of Building Footprints in OpenStreetMap over Space and Time. IJGI. 2013;2(4):1066-1091. doi: 10.3390/ijgi2041066
- 19 Minghini M, Frassinelli F. OpenStreetMap history for intrinsic quality assessment: Is OSM up-to-date?. Open geospatial data, softw stand. 2019;4(1):9. doi: 10.1186/s40965-019-0067-x
- 20 Neis P, Zipf A. Analyzing the Contributor Activity of a Volunteered Geographic Information Project — The Case of OpenStreetMap. IJGI. 2012;1(2):146-165. doi: 10.3390/ijgi1020146
- 21 Mahabir R, Stefanidis A, Croitoru A, Crooks A, Agouris P. Authoritative and Volunteered Geographical Information in a Developing Country: A Comparative Case Study of Road Datasets in Nairobi, Kenya. IJGI. 2017;6(1):24. doi: 10.3390/ijgi6010024
- 22 Davidovic N, Mooney P, Stoimenov L, Minghini M. Tagging in Volunteered Geographic Information: An Analysis of Tagging Practices for Cities and Urban Regions in OpenStreetMap. IJGI. 2016;5(12):232. doi: 10.3390/ijgi5120232
- 23 Sun Y, Saha S, Tost H, Kong X, Xu C. Literature Review Reveals a Global Access Inequity to Urban Green Spaces. Sustainability. 2022;14(3):1062. doi: 10.3390/su14031062
- 24 Bakhtsiyarava M, Moran M, Ju Y, Zhou Y, Rodriguez DA, Dronova I, et al. Potential drivers of urban green space availability in Latin American cities. Nat Cities. 2024;1(12):842-852. doi: 10.1038/s44284-024-00162-1
- 25 Ramirez PC, Camargo DM, Quiroga V, Rios AP, Fermino RC, Sarmiento OL. Quality of public urban parks for physical activity practice in Bucaramanga, Colombia. Rev Bras Cineantropom Desempenho Hum. 2017;19(4):480. doi: 10.5007/1980-0037.2017v19n4p480
- 26 Barreno M, Sisa I, Yépez García MC, Shen H, Villar M, Kovalskys I, et al. Association between built environment and physical activity in Latin American countries: a multicentre cross-sectional study. BMJ Open. 2021;11(11):e046271. doi: 10.1136/bmjopen-2020-046271
- 27 Bojorquez I, Ojeda-Revah L, Diaz R. Access to public spaces and physical activity for Mexican adult women. Cad Saúde Pública. 2018;34(4):e00065217-e00065217. doi: 10.1590/0102-311x00065217
- 28 Montoya-Tangarife C, Villamizar Duarte N, Jorquera Guajardo F, Cardenas MF, Giraldo-Ospina T. Accessibility to public spaces: Boosting ecosystem services in urban areas in four Latin American cities. Front Sustain Cities. 2022;4:796122. doi: 10.3389/frsc.2022.796122
- 29 Mejia-Arbelaez C, Sarmiento OL, Mora Vega R, Flores Castillo M, Truffello R, Martínez L, et al. Social Inclusion and Physical Activity in Ciclovía Recreativa Programs in Latin America. IJERPH. 2021;18(2):655. doi: 10.3390/ijerph18020655
- 30 Laato S, Rauti S, Kordyaka B, Papangelis K, Jung S, Nummenmaa T, et al. Gamification of walking in nature: A field experiment with Pokémon GO Routes. Proc ACM Hum-Comput Interact. 2024;8(CHI PLAY):1-25. doi: 10.1145/3677075
- 31 Beach C, Billstrom G, Anderson Steeves ET, Flynn JI, Steeves JA. The Physical Activity Patterns of Greenway Users Playing Pokémon Go: A Natural Experiment. Games for Health Journal. 2019;8(1):7-14. doi: 10.1089/g4h.2017.0168
- 32 Vergara-Torres AP, Juvera-Portilla JL, Ceballos-Gurrola O, Zamarripa J. Pokémon GO y su relación con la actividad física, orientación espacial y socialización en usuarios mexicanos (Pokémon GO and its relationship with physical activity, spatial orientation and socialization in mexican users). Retos. 2020;(38):727-732. doi: 10.47197/retos.v38i38.77757
- 33 Liang H, Wang X, An R. Influence of Pokémon GO on Physical Activity and Psychosocial Well-Being in Children and Adolescents: Systematic Review. J Med Internet Res. 2023;25(1):e49019. doi: 10.2196/49019
- 34 Ayers JW, Leas EC, Dredze M, Allem JP, Grabowski JG, Hill L. Pokémon GO—A New Distraction for Drivers and Pedestrians. JAMA Intern Med. 2016;176(12):1865. doi: 10.1001/jamainternmed.2016.6274
- 35 Senaratne H, Mobasheri A, Ali AL, Capineri C, Haklay M(. A review of volunteered geographic information quality assessment methods. International Journal of Geographical Information Science. 2017;31(1):139-167. doi: 10.1080/13658816.2016.1189556
- 36 Jackson S, Mullen W, Agouris P, Crooks A, Croitoru A, Stefanidis A. Assessing Completeness and Spatial Error of Features in Volunteered Geographic Information. IJGI. 2013;2(2):507-530. doi: 10.3390/ijgi2020507
- 37 Sarmiento OL, Useche AF, Rodriguez DA, Dronova I, Guaje O, Montes F, et al. Built environment profiles for Latin American urban settings: The SALURBAL study. PLoS ONE. 2021;16(10):e0257528. doi: 10.1371/journal.pone.0257528
Declarations
Funding
No financing
Conflict of interest
None
Authorship contributions
Drafting – original draft: Beedxe Castellanos Gómez, Víctor Manuel Martínez García, Yennifer Díaz Romero, Pedro Antonio Valdez Lizárraga, Adriana Chávez Hernández, Andrés Ultreras Rodríguez.
Writing–review and editing: Beedxe Castellanos Gómez, Víctor Manuel Martínez García, Yennifer Díaz Romero, Pedro Antonio Valdez Lizárraga, Adriana Chávez Hernández, Andrés Ultreras Rodríguez.