

Abstract
Introduction: Pageviews of encyclopedia articles can track public attention to augmented reality games, but evidence from Latin American readerships is scarce. This study described the volume, trajectory, launch response, regional composition and cross-edition relation of that attention in the Spanish and Portuguese editions of Wikipedia. Methods: Ecological time-series study of open Wikimedia pageviews from 2016 to 2024. Articles of an English Wikipedia category on augmented reality games with Spanish or Portuguese counterparts were followed, summing views over titles and redirects. Analyses used descriptive statistics, Kendall and Spearman coefficients and an exact Wilcoxon test. Results: Fourteen articles recorded 3,855,441 pageviews, 71.4% in Spanish. Pokémon Go held 87.0% and 91.3% of the Spanish and Portuguese totals. Among 7 paired articles, the Spanish edition obtained a median of 3.0 times the Portuguese views (exact Wilcoxon p = 0.016). The 5 series with a page at release peaked within one month of it, at 1.8 to 142.9 times baseline. Monthly series of the editions correlated (Spearman 0.90), falling to 0.22 without Pokémon Go. Conclusions: Attention concentrated in one title and in the launch month, decayed quickly and was synchronized across editions mainly by that event. Pageview series are a low-cost indicator of launch attention, limited by article creation delays and language-based data.
Keywords
augmented reality, video games, Wikipedia, Latin America, information-seeking behavior
INTRODUCTION
Public attention is a measurable construct when people leave behavioral traces while seeking information. Pageviews of Wikipedia articles have served as an indicator of that attention in health,(1) conservation,(2) tourism,(3) financial markets,(4,5) elections(6) and film releases.(7) Epidemiological work has also used article views to monitor and forecast disease.(8,9) The indicator is public, continuous and free of survey costs, and it has been adopted in several disciplines. The indicator also has limits: Wikipedia data lack location information for some metadata and offer little information on the motivations of many users,(2) so a pageview shows that an article was requested and not why.
Three properties of attention recur in that literature. Attention follows media exposure(10,11) and declines while the triggering event remains in the news,(10) and peaks tied to events do not produce lasting increases in traffic.(12) The motives of readers include current events and media coverage of a topic,(13) and those motives differ across language editions.(14) The topics that readers favor also differ between languages,(15,16) so a result obtained in one edition cannot be assumed for another. Edition-level pageview counts have been used in ecological designs for the Spanish edition as well.(17)
These properties can be examined in augmented reality games. Pokémon Go is described as the most popular location-based game worldwide,(18) and its arrival in Latin America left traces in urban mobility in Santiago,(19) in play practices in Rio de Janeiro,(20) in the public discourse that followed the announcement of its release in Brazil(21) and in the physical activity of players in Pelotas.(22) Syntheses report increases in physical activity associated with the game,(23,24) and a review of geo-based mixed reality games compares Ingress, Pokémon Go and Mario Kart Live through downloads, revenue and search trends.(25) Popular attention to Pokémon Go has waned although the game remains commercially successful,(26) and engagement models for augmented reality games stress the roles of play, presence and place.(27) Online search volume has been proposed as a proxy for the monthly active users of geo-based augmented reality games, with wiki pageviews and social media activity listed as other candidate proxies.(28) Popularity among video games on a large platform is approximately lognormal,(29) a shape in which a few titles hold most of the audience.
Evidence on how Spanish and Portuguese readers distributed their attention among augmented reality games over time is scarce in the studies reviewed for this work. The construct was divided into five dimensions: the volume of attention to each article, its trajectory over time, its response to game releases, the regional composition of the readership of each edition, and the relation between the two editions. The objective of this study was to describe these five dimensions for augmented reality game articles in the Spanish and Portuguese editions of Wikipedia between 2016 and 2024. The specific objectives were to quantify the volume of pageviews by article and edition, to describe annual totals and their trend, to estimate the launch-window response of games released in the period, to describe the regional composition of readership, and to relate the monthly series of the two editions.
METHODS
Design, article selection and data source
An ecological time-series study was designed following the STROBE items that apply to observational studies with aggregated data. The unit of analysis was the article-edition series, defined as the monthly pageviews of one article in one language edition. The universe was the set of direct members of the category Augmented reality games of the English Wikipedia, excluding list pages, which comprised 27 articles. Interlanguage links to the Spanish and Portuguese editions were retrieved through the MediaWiki API, and each article was linked to its Wikidata item. Articles without a Spanish or Portuguese counterpart (13 articles) were excluded. Counterparts with no recorded views between 2016 and 2024 were also excluded from the analysis of series, because a page created after the period has no usable record. Articles linked to both editions with views in both formed the core group for paired comparisons. Membership in the category is maintained by volunteer editors, so the universe reflects editorial classification and not an exhaustive census of augmented reality games; titles whose articles were not categorized in this way could not enter the study.
Pageviews were obtained from the public Wikimedia REST API without authentication, using the per-article endpoint at monthly resolution, all access methods and the user agent type, which filters automated traffic as classified by the platform.(30) The coverage was January 2016 to March 2024 (108 months). Reviews of pageview studies recommend reporting the exact pages, the language edition, the type of data, the treatment of crawlers and the treatment of redirects,(1) and methodological work on Wikipedia data stresses decisions about language representation and temporality.(2) Following those recommendations, the views of each article were summed over its current title and all redirects pointing to it, because the API records each requested title separately. The all-access setting combined desktop and mobile requests. Months without a record were set to zero, which is the convention that corresponds to a page that did not exist or did not receive human requests in that month; the number of such months is reported in the Results. A sensitivity check repeated the volume totals with the all-agents series.
Statistical processing was done in Python 3.14 with NumPy 2.5.4 and SciPy 1.18.1. The scripts were run twice and produced identical output files. Statistical tests were exploratory, two-sided, with a significance level of 0.05 and no adjustment for multiplicity.
Volume of attention
Volume was defined as the cumulative human pageviews of each series over the 108 months, expressed per article and per edition. Instruments were the monthly counts described above. For the core group, the ratio of Spanish to Portuguese views was computed for each article, and the null hypothesis of a median log ratio of zero was tested with an exact Wilcoxon signed-rank test. The share of the most viewed article within each edition and the medians of series totals were reported as descriptive measures. The ratio of human to all-agent views served as the sensitivity indicator.
Temporal trajectory
Trajectory was defined as the sequence of monthly and annual totals of each edition, with and without the most viewed article. The peak month and the share of the whole period contained in the peak month and in calendar year 2016 were obtained. The trend after the initial peak was estimated from January 2017 to March 2024 with the Kendall rank correlation between month index and monthly total, and with the Theil-Sen slope expressed in views per year. Because monthly counts are serially dependent, the p values of these tests were interpreted as indicative.
Launch response
The release month of each game was the earliest dated publication recorded in the Wikidata item with at least month precision, and the infobox of the English article was the fallback source when Wikidata had no date. Only games released between January 2016 and March 2024 were considered. The creation month of each page was taken from the first revision in its edition. A page was classified as existing at release when it was created in or before the release month. The reference month was the release month for such pages and the creation month for pages created later.
The launch-window mean was the average of monthly views in the reference month and the following month. The baseline was the median of monthly views from the seventh to the eighteenth month after the reference month, required to have at least six months of data and a positive median. The baseline months were placed after the first six months because event-driven peaks in Wikipedia traffic tend not to persist.(12) The ratio of the launch-window mean to the baseline was the main indicator, and the peak lag was the number of months between the series maximum and the reference month. A peak within one month of the reference month was classified as a spike. For Pokémon Go, daily views from June to September 2016 were also obtained. Given the small number of series, only descriptive statistics were used for this dimension.
Regional composition of readership
The monthly top-by-country endpoint of the Wikimedia API reports, for each language edition, the countries ranked by views with the count shown as a bucketed range and an upper bound. The share of Latin American countries and the share of the home country of each edition, Spain for the Spanish edition and Portugal for the Portuguese edition, were computed from the upper bounds of the listed countries and averaged over the months of each year. The Latin American group comprised twenty Spanish- or Portuguese-speaking countries and territories of the region. These shares are approximations at the level of the whole edition and not of each article, and they were used as context for the other dimensions.
Relation between editions
The relation between editions was defined as the rank correlation between the monthly series of the Spanish and Portuguese pages of each core-group article, and between the monthly totals of the two editions with and without Pokémon Go. Spearman coefficients were computed over 108 months. The launch ratios of the two editions were compared descriptively for games that had pages in both editions at release.
Ethical considerations
The study used aggregated public counts and involved no participants, no individual-level data and no interviews or surveys. Ethical approval was therefore not applicable. No artificial intelligence system classified or coded the data; all values come from the scripts that process the API responses.
RESULTS
Volume of attention
The category listed 27 articles, and 14 of them recorded human pageviews in at least one edition: 7 in both editions, 6 in the Spanish edition only and 1 in the Portuguese edition only (Table 1). The other 13 had no Spanish or Portuguese counterpart, and 2 Portuguese counterparts had no recorded views in the period.
Article | Release (year-month) | Spanish edition (pageviews) | Portuguese edition (pageviews) | Spanish to Portuguese ratio |
|---|---|---|---|---|
Pokémon Go | 2016-07 | 2,392,907 | 1,007,459 | 2.4 |
Ingress | 2012-11 | 139,499 | 31,436 | 4.4 |
Invizimals | 2009-11 | 57,311 | 18,917 | 3.0 |
Minecraft Earth | 2019-10 | 43,702 | 24,190 | 1.8 |
Kid Icarus: Uprising | 2012-03 | 39,304 | 7,966 | 4.9 |
Mario Kart Live: Home Circuit | 2020-10 | 39,212 | No records | Not applicable |
Harry Potter: Wizards Unite | 2019-06 | 16,748 | 12,576 | 1.3 |
The Playroom | 2013-11 | 9,709 | No records | Not applicable |
Pikmin Bloom | 2021-10 | 5,277 | 847 | 6.2 |
Face Raiders | 2011-02 | 4,608 | No article | Not applicable |
Monster Hunter Now | 2023-09 | 1,691 | No article | Not applicable |
Invizimals: Shadow Zone | 2010-11 | 1,675 | No article | Not applicable |
Pokémon Smile | 2020-06 | No article | 341 | Not applicable |
Maguss | Not available | 66 | No article | Not applicable |
Note: Pageviews are the sum of the article title and its redirects. Release is the earliest dated publication in Wikidata or in the English article infobox. No records indicates that the article had no recorded views within the period; No article indicates no interlanguage link.
The 21 series accumulated 3,855,441 pageviews. The Spanish edition concentrated 2,751,709 of them (71.4%) across 13 series, and the Portuguese edition obtained 1,103,732 across 8 series. Series-months without a recorded view numbered 485 in Spanish and 251 in Portuguese.
For this variable, Pokémon Go obtained 2,392,907 views in Spanish and 1,007,459 in Portuguese, which equaled 87.0% and 91.3% of each edition. Without that article the totals fell to 358,802 and 96,273. The median series accumulated 16,748 views in Spanish and 15,746.5 in Portuguese.
Among the 7 paired articles, the Spanish edition obtained more views than the Portuguese edition in 7 of 7. The median ratio was 3.0 (range 1.3 to 6.2; exact Wilcoxon p = 0.016), and the ratio of the paired totals was 2.4.
The all-agents sensitivity check showed that human views represented 94.5% of the Spanish and 94.2% of the Portuguese total.
Temporal trajectory
Annual totals peaked in 2016 in both editions (Table 2; Figure 1). The Spanish edition obtained 1,936,776 views in 2016 and 124,017 in 2017, and the Portuguese edition obtained 816,318 and 41,052.
Year | Spanish, all articles (pageviews) | Spanish, excluding Pokémon Go (pageviews) | Portuguese, all articles (pageviews) | Portuguese, excluding Pokémon Go (pageviews) |
|---|---|---|---|---|
2016 | 1,936,776 | 84,751 | 816,318 | 9,592 |
2017 | 124,017 | 24,611 | 41,052 | 9,262 |
2018 | 119,109 | 29,930 | 37,834 | 9,988 |
2019 | 125,886 | 29,907 | 57,017 | 21,948 |
2020 | 129,745 | 49,014 | 54,712 | 18,186 |
2021 | 96,658 | 42,258 | 33,121 | 10,302 |
2022 | 80,719 | 33,113 | 23,928 | 6,239 |
2023 | 73,405 | 33,992 | 18,606 | 5,144 |
2024 | 65,394 | 31,226 | 21,144 | 5,612 |
Note: Totals sum all article series of each edition, including redirects.
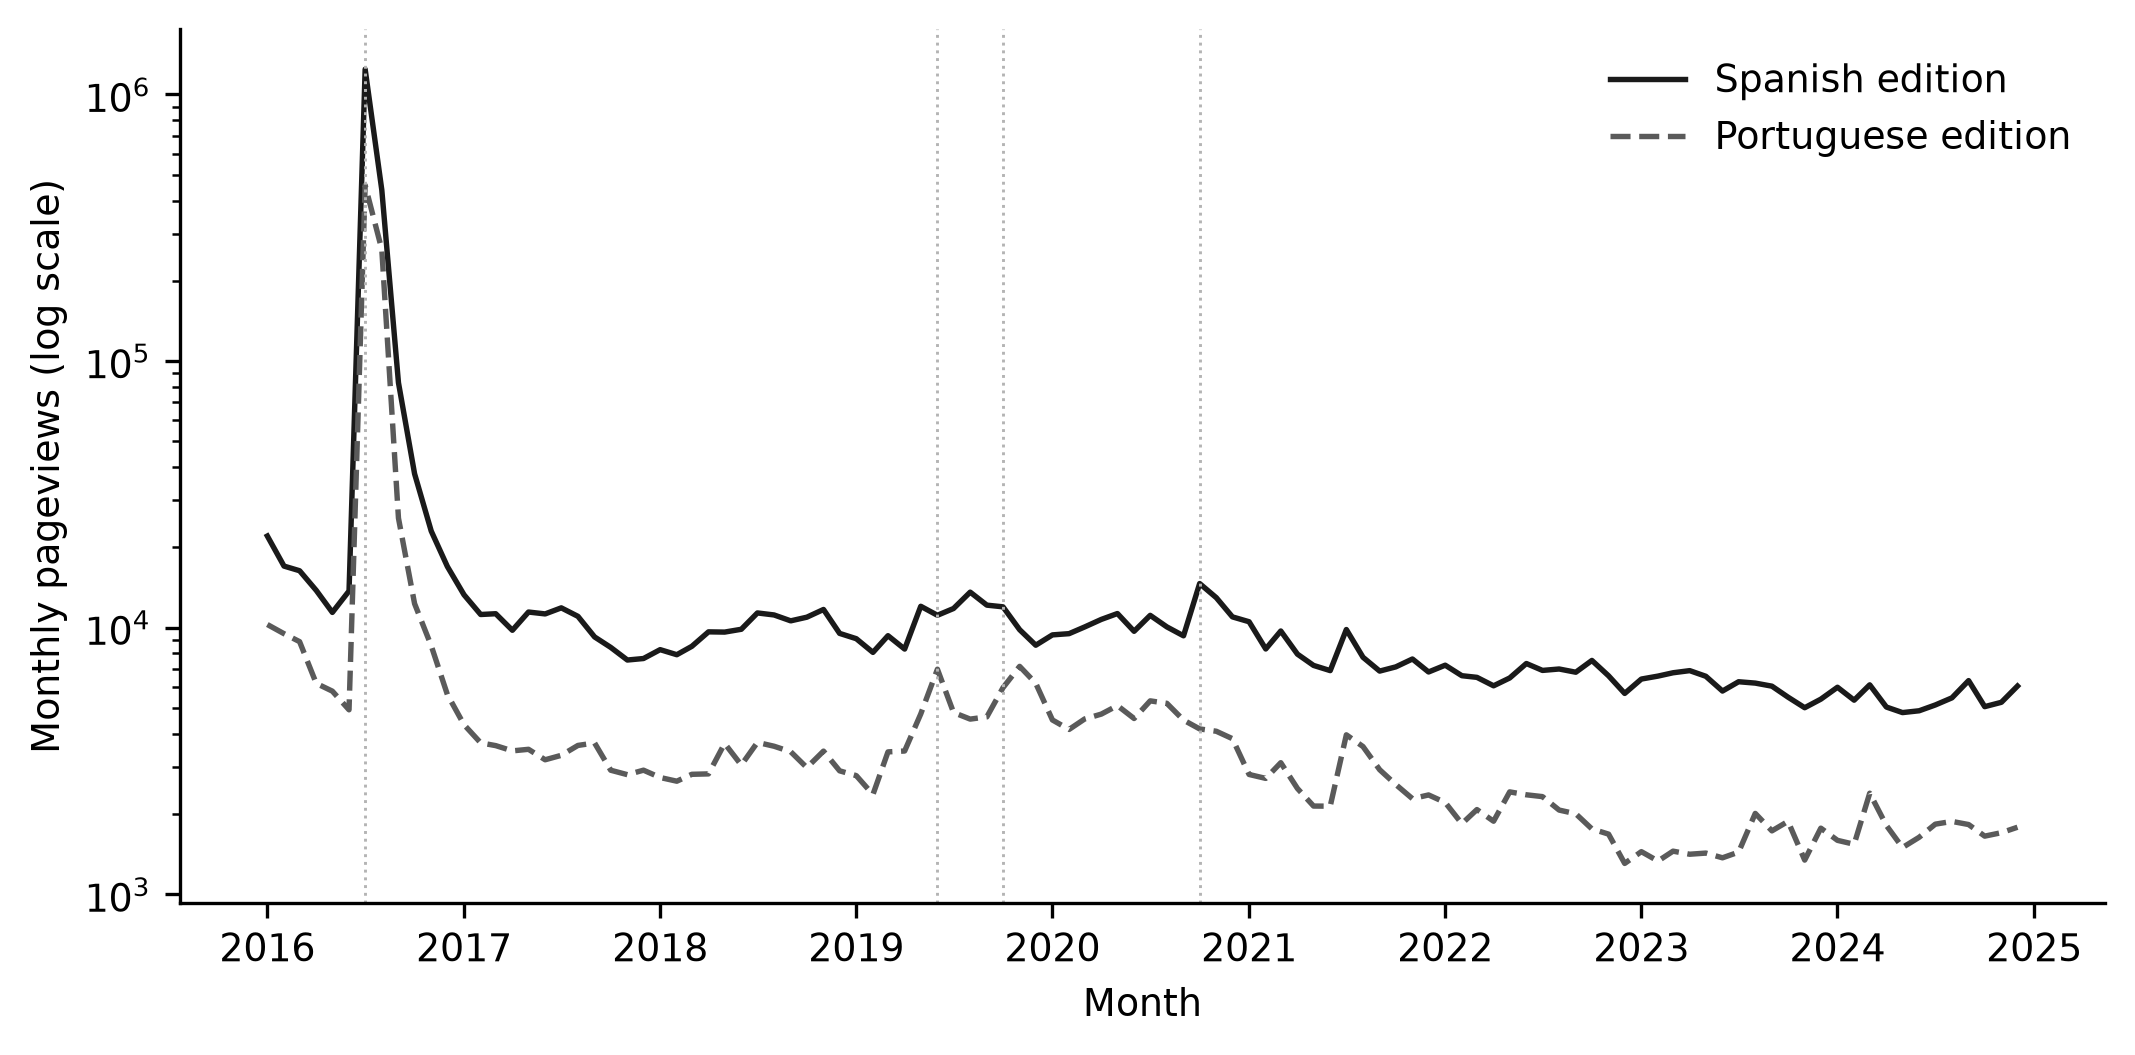
Figure 1. Monthly pageviews of augmented reality game articles in the Spanish and Portuguese editions.
Note: Vertical dotted lines mark the release months of games whose page existed at release. The vertical axis is logarithmic.July 2016 alone concentrated 45.2% of the Spanish views (1,243,572) and 41.4% of the Portuguese views (456,675). Calendar year 2016 accounted for 70.4% and 74.0% of each edition across the nine years.
Without Pokémon Go, the Spanish edition presented 24,611 views in 2017, 49,014 in 2020 and 31,226 in 2024. The Portuguese edition presented 9,262 in 2017, 21,948 in 2019 and 5,612 in 2024.
From January 2017 onward, monthly totals including Pokémon Go were associated negatively with time in the Spanish edition (Kendall tau = −0.62, p < 0.001; slope −804.3 views per year) and in the Portuguese edition (tau = −0.50, p < 0.001; slope −306.3). Without Pokémon Go, the Spanish trend was positive (tau = 0.20, p = 0.004; slope 71.6) and the Portuguese trend was negative (tau = −0.41, p < 0.001; slope −68.3).
In relation to volume, the median monthly total from 2017 to 2024 was 8,173 in Spanish and 2,811.5 in Portuguese, and 2,604.5 and 705.5 without Pokémon Go.
Launch response
Games with a release between 2016 and 2024 and a series in at least one edition numbered 7, which gave 11 article series. The page existed in the release month for 5 of those series and was created later for 6 (Table 3).
Article | Edition | Release (year-month) | Page created (year-month) | Page existed at release | Launch-window mean (pageviews per month) | Baseline median (pageviews per month) | Ratio | Peak month | Peak lag (months) |
|---|---|---|---|---|---|---|---|---|---|
Pokémon Go | Portuguese | 2016-07 | 2015-09 | Yes | 358,113 | 2,506 | 142.9 | 2016-07 | +0 |
Pokémon Go | Spanish | 2016-07 | 2015-09 | Yes | 815,920 | 8,252 | 98.9 | 2016-07 | +0 |
Harry Potter: Wizards Unite | Portuguese | 2019-06 | 2019-03 | Yes | 2,190 | 165 | 13.3 | 2019-06 | +0 |
Mario Kart Live: Home Circuit | Spanish | 2020-10 | 2020-10 | Yes | 2,998 | 720 | 4.2 | 2020-10 | +0 |
Minecraft Earth | Portuguese | 2019-10 | 2019-09 | Yes | 1,357 | 761 | 1.8 | 2019-11 | +1 |
Pokémon Smile | Portuguese | 2020-06 | 2023-09 | No | Not applicable | Not applicable | Not applicable | Not applicable | Not applicable |
Pikmin Bloom | Spanish | 2021-10 | 2021-11 | No | Not applicable | Not applicable | Not applicable | Not applicable | Not applicable |
Pikmin Bloom | Portuguese | 2021-10 | 2021-12 | No | Not applicable | Not applicable | Not applicable | Not applicable | Not applicable |
Monster Hunter Now | Spanish | 2023-09 | 2023-10 | No | Not applicable | Not applicable | Not applicable | Not applicable | Not applicable |
Harry Potter: Wizards Unite | Spanish | 2019-06 | 2019-07 | No | Not applicable | Not applicable | Not applicable | Not applicable | Not applicable |
Minecraft Earth | Spanish | 2019-10 | 2020-01 | No | Not applicable | Not applicable | Not applicable | Not applicable | Not applicable |
Note: Launch window is the reference month and the following month. Reference month is the release month or, when the page was created later, the creation month. Baseline is the median of months 7 to 18 after the reference month. Ratio is the launch-window mean divided by the baseline median. Peak lag is the number of months between the series maximum and the reference month. Values are shown only for pages that existed at release.
Among the 5 series with a page at release, the launch-window mean exceeded the baseline median in 5. The ratios ranged from 1.8 to 142.9 (median 13.3), and the series maximum fell within one month of the release month in 5 of 5.
Pokémon Go obtained a ratio of 98.9 in Spanish and 142.9 in Portuguese, with the maximum in the release month in both editions. Harry Potter: Wizards Unite scored 13.3 in Portuguese, Mario Kart Live: Home Circuit 4.2 in Spanish and Minecraft Earth 1.8 in Portuguese.
The daily series of Pokémon Go (Figure 2) rose in the Spanish edition from 1,271 views on July 5 to 29,993 on July 6, 2016. The Spanish maximum was 76,891 on July 21, and the Portuguese maximum was 58,469 on August 4. Both editions presented a peak on August 4, when the Spanish edition obtained 64,580. The median daily count in June 2016 was 302 in Spanish and 142.5 in Portuguese, so the maxima were 254.6 and 410.3 times those medians.
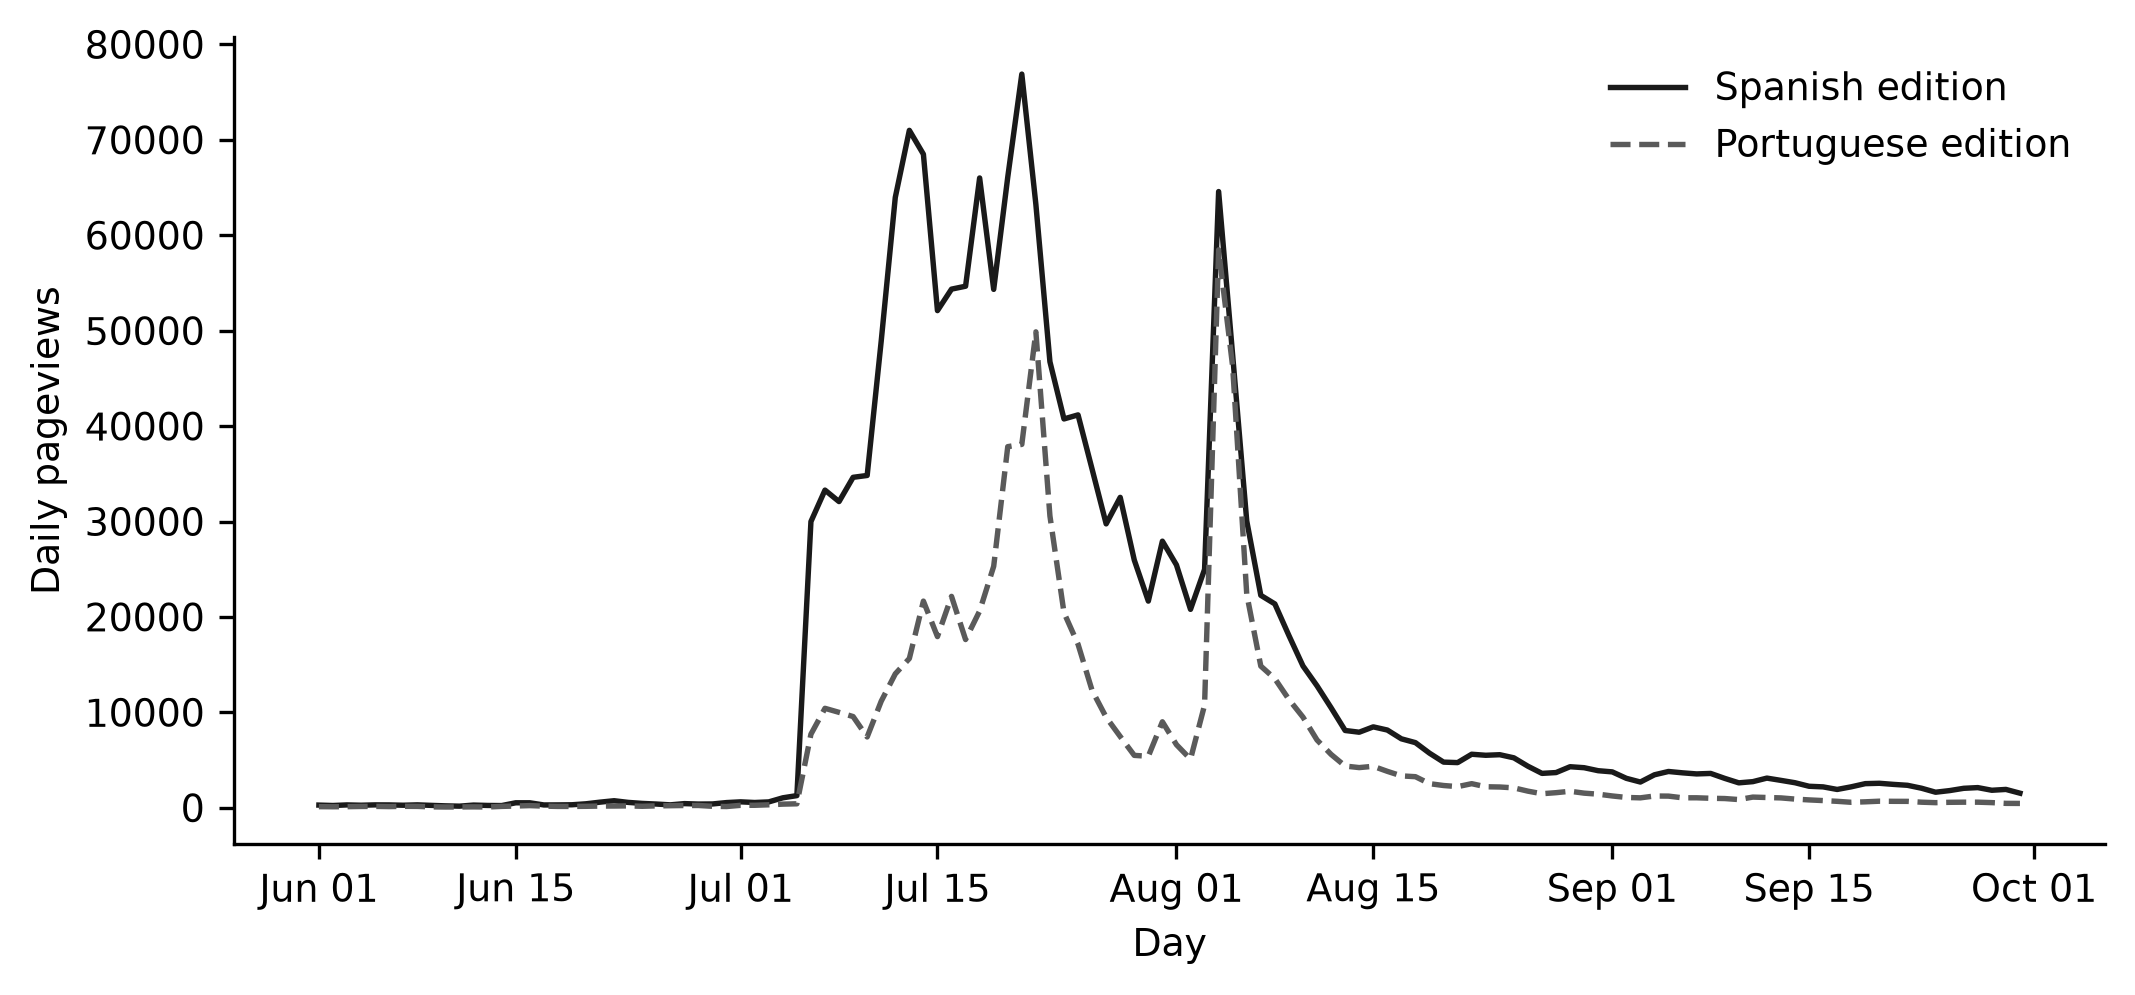
Figure 2. Daily pageviews of the Pokémon Go article in the Spanish and Portuguese editions.
Note: Daily counts of the article title and its redirects from June to September 2016.Within the 6 series created after the release month, the creation delay had a median of 1.5 months (range 1 to 39), and 5 of them were created within three months. Measured from the creation month, their ratios had a median of 2.5 (range 0.9 to 4.6), and 4 of 6 peaked within one month of that reference.
For the only game with a page in both editions at release, the Portuguese ratio exceeded the Spanish ratio (142.9 versus 98.9).
Regional composition of readership
Latin American countries obtained 71.4% of the views of the Spanish edition in 2016 and 62.9% in 2024, and Spain obtained 19.9% and 28.5% (Table 4).
Year | Spanish edition, Latin America (%) | Spanish edition, Spain (%) | Portuguese edition, Latin America (%) | Portuguese edition, Portugal (%) |
|---|---|---|---|---|
2016 | 71.4 | 19.9 | 71.7 | 7.5 |
2017 | 70.2 | 20.7 | 72.1 | 7.9 |
2018 | 70.5 | 21.7 | 75.4 | 7.9 |
2019 | 67.7 | 21.6 | 77.6 | 8.9 |
2020 | 68.4 | 22.4 | 78.9 | 10.1 |
2021 | 67.1 | 24.6 | 77.5 | 11.4 |
2022 | 67.1 | 25.0 | 80.3 | 11.2 |
2023 | 64.9 | 26.0 | 80.1 | 11.4 |
2024 | 62.9 | 28.5 | 81.0 | 11.4 |
Note: Shares are approximations computed from the upper bounds of the bucketed monthly counts published for listed countries and averaged over months. Latin America comprises 20 Spanish- or Portuguese-speaking countries and territories of the region. Months without published country data are excluded from the averages.
The Latin American share of the Portuguese edition was 71.7% in 2016 and 81.0% in 2024, whereas Portugal presented 7.5% and 11.4%.
The annual means across the nine years were 67.8% for Spanish and 77.2% for Portuguese, with annual values from 62.9% to 71.4% and from 71.7% to 81.0%. Country files were unavailable for 2 months, which were excluded from the averages.
Relations between editions
The monthly series of the two editions were correlated for the 7 paired articles (Table 5). Pikmin Bloom scored 0.94, Pokémon Go 0.90, Minecraft Earth 0.87, Harry Potter: Wizards Unite 0.80, Kid Icarus: Uprising 0.79, Ingress 0.59 and Invizimals 0.21.
Series | Spearman correlation between monthly editions | p |
|---|---|---|
Pokémon Go | 0.90 | <0.001 |
Ingress | 0.59 | <0.001 |
Invizimals | 0.21 | 0.029 |
Minecraft Earth | 0.87 | <0.001 |
Kid Icarus: Uprising | 0.79 | <0.001 |
Harry Potter: Wizards Unite | 0.80 | <0.001 |
Pikmin Bloom | 0.94 | <0.001 |
All articles combined | 0.90 | <0.001 |
All articles excluding Pokémon Go | 0.22 | 0.023 |
Note: Spearman coefficients over 108 months. The p values assume independent observations and are indicative only because monthly series are serially dependent.
The median coefficient was 0.80 (range 0.21 to 0.94), and 7 of 7 coefficients had p < 0.05. The coefficient for the combined totals was 0.90 (p < 0.001), and it fell to 0.22 when Pokémon Go was removed (p = 0.023).
DISCUSSION
Main finding in relation to the objectives
The objective was to describe the volume, trajectory, launch response, regional composition and cross-edition relation of attention to augmented reality games on two Wikipedia editions. The main finding is that attention was concentrated in one title and in one month, and that the two editions moved together mainly because of that event. The five dimensions are discussed in the same order as in the Results and then read jointly.
Volume of attention
A single article absorbed almost nine tenths of the Spanish views and more than nine tenths of the Portuguese views. This concentration agrees with the approximately lognormal popularity observed for video games on a large distribution platform,(29) although the two measures differ, since that study counted players and the present one counts encyclopedia readers. Pokémon Go is also the game on which the Latin American studies retrieved for this work concentrate,(19,20,22) so the weight of its article is consistent with the weight it has in research.
The Spanish edition obtained more views than the Portuguese edition for every paired article, with a median ratio of about three. Readers of different language editions come to Wikipedia with different mixes of motives(14) and favor different topics,(15,16) so a stable advantage of the Spanish edition is plausible, but the ratio ranged widely between games. The data cannot separate differences in readership size from differences in interest in each game.
Attention was not limited to the newest titles. Ingress, released in 2012, was the second most viewed article in both editions, and a review of geo-based mixed reality games includes it among five major titles of the genre together with Pokémon Go and Mario Kart Live.(25) A large audience for an older game indicates that the encyclopedia article works as a reference page that is consulted long after release, and not only as a launch-time landing page. That reading cannot be tested here, because the series of such titles lack a launch window inside the period. An infodemiological study of occupational health likewise treated the Spanish and English editions as separate sources of search trends,(17) which is consistent with analyzing editions separately.
In the sensitivity check, human views made up 94.5% and 94.2% of the all-agent views of the two editions, so the choice of the human-only series changes the totals modestly. Reporting that choice matters, because a review of pageview studies recommends stating the treatment of crawlers.(1)
Temporal trajectory
The fall after July 2016 was steep, and the later series stayed at a small fraction of the initial level. This pattern coincides with studies in which attention followed media exposure(10,11) and declined while the triggering event persisted,(10) and with the finding that event peaks in Wikipedia traffic do not produce lasting increases.(12) It also coincides with the observation that popular attention to Pokémon Go has waned although the game remains successful,(26) and with the remark that interventions based on the game must retain players once the novelty wears off.(23)
The trend without Pokémon Go differed by edition: it rose slightly in Spanish and fell in Portuguese. The Portuguese secondary maximum in 2019 and 2020 coincides in time with the releases of Harry Potter: Wizards Unite and Minecraft Earth, but the present design cannot attribute the maximum to those releases. Seasonal patterns in Wikipedia usage have been described for other topics,(31,32) and monthly series of augmented reality games may carry a comparable component that this study did not model. A positive trend in one edition and a negative trend in the other illustrates that edition-level results should not be extrapolated.(15)
Launch response
Every series with a page at release peaked within one month of it, and the ratios ranged from about two to more than one hundred. The result agrees with the evidence that a news event drives collective attention(10,11) and that readers visit Wikipedia because of current events and media coverage.(13) It also fits the report that the activity of editors and viewers of a film entry in Wikipedia predicts the financial success of the film,(7) which suggests that attention to games and films shares a release-driven structure. The ratios differ in size by two orders of magnitude, however, and only Pokémon Go reached values of that order.
The daily series offer a detail that monthly data conceal. The Spanish series jumped on July 6, 2016, but the Santiago study places the Chilean release of the game in August 2016,(19) so the Spanish readership appears to have reacted to the global release before the national one. The Portuguese edition peaked on July 21 and on August 4, and the Spanish edition showed a peak on the same August day. Brazilian discourse about the game was already present from the announcement of its release.(21) The data do not identify the event behind the shared peak, and an external referral cannot be ruled out, since links posted in a large Reddit community were associated with increases in the pageviews of the linked articles.(33)
Most pages in the launch analysis were created after the release month, with a median delay of 1.5 months. During that interval, attention to the game could not reach the article, which implies that launch attention in these editions is underestimated for late pages. Methodological guidance on Wikipedia data stresses temporality as a decision that changes the measure of interest.(2) A plausible explanation is that early readers were directed to other pages, such as the page of the franchise or the page of the English edition, and the present design cannot test it. Editors who anticipate a release can reduce the gap by creating the page when the game is announced, a practice that would also make later comparisons between editions less dependent on creation dates.
Regional composition of readership
Latin American countries supplied about two thirds of the Spanish views and about four fifths of the Portuguese views. The share fell in Spanish and rose in Portuguese over the period, while the share of the home country rose in both. A global study of climate change articles also found regional differences in Wikipedia traffic, with greater traffic from the global north,(12) and socio-economic differences in reader behavior across countries have been documented.(14) The present shares are approximations at the level of the whole edition, so they support the label of a largely Latin American readership but not statements about who read each game article. Pageviews also capture only connected readers. Players in Rio de Janeiro and Nairobi reported precarious access to technology and inconsistent network connections,(20) which implies that groups with limited connectivity are underrepresented in any pageview indicator and that regional inequality enters the series before analysis begins.
Relations between editions
The coefficients between the monthly series of the two editions were high for several games, with a median near 0.8. Synchronization of visits across regions has been described for Zika-related pages and attributed to exposure to national television,(11) and a similar common exposure could explain the coupling found here. The coefficient was much lower once Pokémon Go was removed, which indicates that the correlation of the totals reflects mostly one shared shock. The weaker coefficients of Ingress and Invizimals, two older titles, are consistent with series driven by slow background interest rather than by synchronized events.
Joint reading
Taken together, the dimensions describe a pattern of concentration, fast decay, launch-driven spikes at pages that exist, and edition coupling produced by a single event. This pattern is compatible with the view that pageviews are one of several proxies for activity around geo-based augmented reality games,(28) and the review of those games by downloads and search trends gives a complementary view of the same phenomenon.(25) Engagement models of augmented reality games stress the role of place and presence,(27) and a survey study of players links motivation and community to stickiness.(34) Pageviews cannot observe those mechanisms, and they should be read as a measure of curiosity about a game and not of play. The physical activity effects documented for Pokémon Go(23,24) and the mobility effect measured in Santiago(19) concern behavior in the street, whereas the present series concern behavior on a screen, and the two layers need not move together. A study that linked pageview series with mobility or activity data from the same cities would test whether the launch spike of curiosity precedes, accompanies or follows the change in behavior.
The comparison between the two editions can also be read through the lens of reader motives. If readers of the Spanish edition arrive more often through current events and media coverage than readers of the Portuguese edition, the launch ratios would differ, as the Pokémon Go ratios did.(13,14) The single paired launch available does not allow a test, and the survey evidence on motives was gathered for the encyclopedia as a whole and not for game articles. A follow-up with more paired launches, for example the games announced after the period, would give the sample size that this comparison needs.
Strengths and limitations
The strengths are the open and reproducible data, the inclusion of redirect titles, the complete enumeration of a defined category and the sensitivity analysis for automated traffic.
The first limitation is that language editions are not countries. The Spanish and Portuguese editions are read in Spain and Portugal as well, so the regional reading rests on approximate shares. Studies that use the per-country pageview dataset can assign attention to countries directly,(12) and that approach is recommended for the next step. The second limitation is the size of the core group, with 7 paired articles, and the dependence on a single category, which excludes games absent from it; the use of Wikidata classes would extend the universe. The third limitation is that pageviews recorded under redirect titles depend on the redirects existing in the data snapshot, and that renamed pages may have lost earlier views; page-move histories should be added in future extractions.
The fourth limitation is that pageviews do not measure play. Search volume and platform downloads have been used as proxies for active users,(25,28) and combining them with pageviews would test whether the same launch peaks appear. The fifth limitation is the serial dependence of monthly counts, which makes the p values indicative; models for autocorrelated series would give valid intervals. The sixth limitation is that the classification of human and automated traffic is made by the platform and cannot be audited by users, so the human-only totals inherit its errors; reporting both series, as done in the sensitivity check, is the practical response.
Implications
For game publishers and for educators who plan activities around augmented reality games, the results indicate that public curiosity is front-loaded: most of it appears within the first month, and the article of a game that is not yet present in the local language misses it. Wikipedia editors in Spanish and Portuguese could create or update articles before a scheduled release. For researchers, the study shows that reports of pageview analyses should state titles, redirects, agent type and edition, as a published review recommends.(1)
CONCLUSIONS
The volume of attention was concentrated in Pokémon Go, which held most of the pageviews of both editions, and the Spanish edition obtained more views than the Portuguese edition for every paired article.
The trajectory showed a peak in July 2016 followed by a sustained decline, with an opposite trend in the two editions once Pokémon Go was excluded.
The launch response was a spike within one month of release for every page that existed at that time, and most pages were created after the release month.
The regional composition showed a majority of views from Latin American countries in both editions, with a growing share of the home country.
The relation between editions was strong for most games and weak without Pokémon Go.
References
- 1 Alibudbud R. Wikipedia page views for health research: a review. Front Big Data. 2023;6:1199060. doi: 10.3389/fdata.2023.1199060
- 2 Mittermeier JC, Correia R, Grenyer R, Toivonen T, Roll U. Using Wikipedia to measure public interest in biodiversity and conservation. Conservation Biology. 2021;35(2):412-423. doi: 10.1111/cobi.13702
- 3 Donovan C, Flaherty ET, Quinn Healy E. Using big data from Wikipedia page views for official tourism statistics. SJI. 2017;33(4):997-1003. doi: 10.3233/sji-160320
- 4 Gómez‐Martínez R, Orden‐Cruz C, Martínez‐Navalón JG. Wikipedia pageviews as investors’ attention indicator for Nasdaq. Intelligent Sys in Account. 2022;29(1):41-49. doi: 10.1002/isaf.1508
- 5 Kristoufek L. BitCoin meets Google Trends and Wikipedia: Quantifying the relationship between phenomena of the Internet era. Sci Rep. 2013;3(1):3415. doi: 10.1038/srep03415
- 6 Yasseri T, Bright J. Wikipedia traffic data and electoral prediction: towards theoretically informed models. EPJ Data Sci. 2016;5(1):22. doi: 10.1140/epjds/s13688-016-0083-3
- 7 Mestyán M, Yasseri T, Kertész J. Early Prediction of Movie Box Office Success Based on Wikipedia Activity Big Data. PLoS ONE. 2013;8(8):e71226. doi: 10.1371/journal.pone.0071226
- 8 Generous N, Fairchild G, Deshpande A, Del Valle SY, Priedhorsky R. Global Disease Monitoring and Forecasting with Wikipedia. PLoS Comput Biol. 2014;10(11):e1003892. doi: 10.1371/journal.pcbi.1003892
- 9 McIver DJ, Brownstein JS. Wikipedia Usage Estimates Prevalence of Influenza-Like Illness in the United States in Near Real-Time. PLoS Comput Biol. 2014;10(4):e1003581. doi: 10.1371/journal.pcbi.1003581
- 10 Gozzi N, Tizzani M, Starnini M, Ciulla F, Paolotti D, Panisson A, et al. Collective Response to Media Coverage of the COVID-19 Pandemic on Reddit and Wikipedia: Mixed-Methods Analysis. J Med Internet Res. 2020;22(10):e21597. doi: 10.2196/21597
- 11 Tizzoni M, Panisson A, Paolotti D, Cattuto C. The impact of news exposure on collective attention in the United States during the 2016 Zika epidemic. PLoS Comput Biol. 2020;16(3):e1007633. doi: 10.1371/journal.pcbi.1007633
- 12 Meier F. Using Wikipedia Pageview Data to Investigate Public Interest in Climate Change at a Global Scale. ACM Web Science Conference. 2024:365-375. doi: 10.1145/3614419.3644007
- 13 Singer P, Lemmerich F, West R, Zia L, Wulczyn E, Strohmaier M, et al. Why We Read Wikipedia. Proceedings of the 26th International Conference on World Wide Web. 2017:1591-1600. doi: 10.1145/3038912.3052716
- 14 Lemmerich F, Sáez-Trumper D, West R, Zia L. Why the World Reads Wikipedia. Proceedings of the Twelfth ACM International Conference on Web Search and Data Mining. 2019:618-626. doi: 10.1145/3289600.3291021
- 15 Ciechanowski K, Banasik-Jemielniak N, Jemielniak D. What’s hot and what's not in lay psychology: Wikipedia’s most-viewed articles. Curr Psychol. 2024;43(16):14761-14773. doi: 10.1007/s12144-022-03826-0
- 16 Lewoniewski W, Węcel K, Abramowicz W. Multilingual Ranking of Wikipedia Articles with Quality and Popularity Assessment in Different Topics. Computers. 2019;8(3):60. doi: 10.3390/computers8030060
- 17 García-González MT, Baquero-Moreno I, Escribano-Garcia AM, Buitrago-Leal R. Interés poblacional sobre salud laboral basado en las tendencias de búsqueda de información en las ediciones española e inglesa de Wikipedia: estudio infodemiológico. Med Segur Trab. 2024;70(275):111-124. doi: 10.4321/s0465-546x2024000200004
- 18 de Souza e Silva A, Glover-Rijkse R, Njathi A, de Cunto Bueno D. Playful mobilities in the Global South: A study of Pokémon Go play in Rio de Janeiro and Nairobi. New Media & Society. 2023;25(5):963-979. doi: 10.1177/14614448211016400
- 19 Graells-Garrido E, Ferres L, Caro D, Bravo L. The effect of Pokémon Go on the pulse of the city: a natural experiment. EPJ Data Sci. 2017;6(1):23. doi: 10.1140/epjds/s13688-017-0119-3
- 20 de Souza e Silva A, Glover-Rijkse R, Njathi A, de Cunto Bueno D. Exploring the material conditions of Pokémon Go play in Rio de Janeiro and Nairobi. Information, Communication & Society. 2021;24(6):813-829. doi: 10.1080/1369118x.2021.1909098
- 21 De Souza-Leão ALM, Moura BM. Temos que pegar todos! - Discursos identitários sobre o consumo de Pokemon GO no Brasil. Rev Bras Mark. 2018;17(6):895-913. doi: 10.5585/bmj.v17i6.3830
- 22 Finco MD, Rocha RS, Fão RW, Santos F. Let's Move!. International Journal of Game-Based Learning. 2018;8(2):44-54. doi: 10.4018/ijgbl.2018040104
- 23 Khamzina M, Parab KV, An R, Bullard T, Grigsby-Toussaint DS. Impact of Pokémon Go on Physical Activity: A Systematic Review and Meta-Analysis. American Journal of Preventive Medicine. 2020;58(2):270-282. doi: 10.1016/j.amepre.2019.09.005
- 24 Liang H, Wang X, An R. Influence of Pokémon GO on Physical Activity and Psychosocial Well-Being in Children and Adolescents: Systematic Review. J Med Internet Res. 2023;25(1):e49019. doi: 10.2196/49019
- 25 Kerdvibulvech C. Geo-Based Mixed Reality Gaming Market Analysis. Human Behavior and Emerging Technologies. 2022;2022:1-9. doi: 10.1155/2022/1139475
- 26 Grandinetti J, Abrams-Rollinson T. Remembering Pokémania: Memory, Cognitive Assemblages, and Augmented Reality. Hyperrhiz. 2021;(24). doi: 10.20415/hyp/024.e05
- 27 Pyae A, Potter LE. A player engagement model for an augmented reality game. Proceedings of the 28th Australian Conference on Computer-Human Interaction - OzCHI '16. 2016:11-15. doi: 10.1145/3010915.3010960
- 28 Liu HX, Wagner C. Proxies to the monthly active user number of Geo AR Mobile games – online search volume as a proposal. Multimed Tools Appl. 2023;82(16):25403-25425. doi: 10.1007/s11042-023-14366-5
- 29 Mendes LO, Cunha LR, Mendes RS. Popularity of Video Games and Collective Memory. Entropy. 2022;24(7):860. doi: 10.3390/e24070860
- 30 Wikimedia Foundation. Wikimedia REST API: pageviews per-article and top-by-country metrics [Internet]. 2024. Available from: https://wikimedia.org/api/rest_v1/
- 31 Mittermeier JC, Roll U, Matthews TJ, Grenyer R. A season for all things: Phenological imprints in Wikipedia usage and their relevance to conservation. PLoS Biol. 2019;17(3):e3000146. doi: 10.1371/journal.pbio.3000146
- 32 Owuor I, Hochmair HH, Paulus G. Use of social media data, online reviews and wikipedia page views to measure visitation patterns of outdoor attractions. Journal of Outdoor Recreation and Tourism. 2023;44:100681. doi: 10.1016/j.jort.2023.100681
- 33 Moyer D, Carson S, Dye T, Carson R, Goldbaum D. Determining the Influence of Reddit Posts on Wikipedia Pageviews. ICWSM. 2021;9(5):75-82. doi: 10.1609/icwsm.v9i5.14700
- 34 Zhang R. The relation between players' motivation, virtual communities and stickiness in augmented reality games. LHT. 2024;42(2):496-529. doi: 10.1108/lht-05-2022-0225
Declarations
Funding
No financing
Conflict of interest
None
Authorship contributions
Drafting – original draft: Dennyse María Patricia Hermosa Guzmán, Dhamelis Anaya Rios, Esmeralda Cortes López.
Writing–review and editing: Dennyse María Patricia Hermosa Guzmán, Dhamelis Anaya Rios, Esmeralda Cortes López.