

Abstract
Introduction: Achievements are optional meta-objectives widely used in games and gamified systems, but their association with player retention in commercial games has been quantified little. Methods: Retrospective cross-sectional analysis of public metadata of 1,341 Steam games released between 2010 and 2023, drawn from the SteamSpy and Steam Store APIs. The exposure was the number of achievements, and the retention proxy was concurrent users per 10,000 owners. Negative binomial models with an owner offset were adjusted for price, genre and release year. Results: The share of games with at least one achievement climbed from 60.7% in the earliest release year to 90.8% in the latest, while list size stayed flat. The adjusted rate ratio per doubling of achievements was 1.03 (95% CI 0.98-1.08). Bands of 20 to 49 and 50 to 99 achievements had lower rate ratios than games without achievements, and the band of 100 or more had a higher one (1.61; 95% CI 1.09-2.38). Among games with achievements the rate ratio per doubling was 1.24 (95% CI 1.12-1.38). The median earn rate dropped from 21.1% to 4.8% across bands. Conclusions: Achievement count was not associated with a higher active player share along a straight line. The association was positive only among games that list achievements and may be confounded by game type and business model. These cross-sectional estimates do not support causal claims.
Keywords
video games, achievements, player retention, gamification, game design, Steam
INTRODUCTION
Achievements are optional meta-objectives that a platform records independently of any single play session and that usually carry a reward.(1) Platform operators adopted them widely to keep players interested, and the trophy systems of console platforms have been compiled into datasets of their own.(2) Industry-oriented work describes achievements as important to a title's profitability and to the player's motivation to continue playing.(3) The same logic runs through gamification, defined as the use of game design elements outside games.(4) In a review of 18 gamified interventions, achievements, badges or medals were among the reward types reported in seven of them.(5)
Player retention, meaning continued use of a game over time, is a central analytic target in the games industry, and survival and churn models are the usual tools for studying it.(6,7) Evidence on achievements is divided. In one online multiplayer game, achievement features predicted player longevity from the initial to the advanced phases of play.(8) Longitudinal work on a single title examined why the appeal of specific game elements changes over time.(9) Motivational accounts, in contrast, warn that extrinsic rewards can undermine intrinsic interest.(5,10) If achievements mainly widen the set of goals open to a player, titles with more of them should keep a larger share of their owner base active, with diminishing returns once the list is long. That pattern was the working expectation of this analysis.
Studies based on Steam data have examined reviews, cross-game playtime and monetisation.( 11-13) One analysis of 18,658 listed games linked achievements to greater engagement with the publishing platform.( 14) Engagement with a platform is not retention within a title, and the association between achievement counts and a within-title activity measure, net of price, genre and release year, remains to be quantified. The aim of this study was to estimate the association between the number of achievements and a retention proxy in Steam games released between 2010 and 2023, adjusting for price, genre and release year, and to describe how achievement design changed over that period.
METHODS
Study design and data sources
This was a retrospective, cross-sectional analysis of public platform metadata. It followed the STROBE items that apply to observational studies without individual-level data. Three open sources were queried programmatically without login. The SteamSpy public API( 15) supplied, for each application, the owner range, the number of concurrent users, the counts of positive and negative user reviews and the initial price. The Steam Store API supplied the application type, the release date, the genre labels and the total number of achievements. The public global achievement percentages of the Steamworks Web API( 16) supplied the share of players who had earned each achievement. SteamSpy values on owners and concurrent users correspond to the snapshot available from the public API.
The SteamSpy listing returned 5,992 applications. Applications were ranked by total user reviews (positive plus negative), and the first 1,600 were queried in the Steam Store API. Records were retained when the application was a game, the store listed a release date between 2010 and 2023 that was not marked as upcoming, and SteamSpy reported a valid owner range. Ranking by reviews favours titles with a visible audience, so the sample describes well-reviewed commercial titles and not the full catalogue. The playtime fields of the SteamSpy listing (average and median hours) were empty for every application, so playtime could not serve as the retention measure.
Each application was requested once by script, and the extracted fields were stored before any variable was derived. Records were keyed on the application identifier, so no application could enter twice. Range checks confirmed that counts were non-negative and that the owner range string had a lower and an upper bound. Missing values were handled by complete-case analysis, and no imputation was used. The earn-rate endpoint returned no data for some games that list achievements, and those games were excluded from the secondary analysis only.
No sample size calculation was made, because the sample was fixed by the ranking rule and the availability of public records. The main threats to validity were selection through the review ranking, information bias from a single snapshot and residual confounding. They were addressed by describing the sampling rule, by the sensitivity analyses described below and by interpreting all estimates as associations.
Variables
The exposure was the number of achievements listed in the store, with zero for games that list none. The total reported by the store was used as listed, and downloadable content with its own list was not merged with the base game. The exposure was analysed in two forms: as log2(1 + n), so that each unit corresponds to a doubling of the achievement count, and in five bands (none, 1 to 19, 20 to 49, 50 to 99, and 100 or more).
The primary outcome was the active player share, defined as the number of concurrent users in the SteamSpy snapshot per 10,000 estimated owners. Owners were taken as the midpoint of the range reported by SteamSpy. This ratio approximates the part of a game's owner base that is playing at a given moment. As a snapshot-based proxy of retention, it is higher when owners keep returning to the game.( 6) It does not measure the time to abandonment, which survival analysis requires individual-level logs to estimate.
The secondary outcome was the median earn rate, calculated for games with at least one achievement as the median, across that game's achievements, of the percentage of players who had earned the achievement. Because the list of a game with many achievements includes rarer feats, a mechanical dependence on the achievement count is expected, and the outcome was interpreted as depth of completion.
Covariates were the initial list price in United States dollars (as log of one plus price), an indicator for free games, eight indicators for the most frequent store genres (action, adventure, casual, indie, role-playing, simulation, strategy and massively multiplayer; a game could carry several), and release year as a categorical term. The band limits were fixed before the analysis to separate games with short lists, common lists of 20 to 99 achievements and very long lists. Genre labels and price were chosen because they plausibly determine both how many achievements a developer adds and how much of the owner base stays active.
Statistical analysis
Continuous variables were summarised as median with first and third quartiles. Differences in the active player share across bands were tested with the Kruskal-Wallis test, and monotonic associations were described with Spearman correlation coefficients.
The first figure was built by grouping games by release year. Its left panel plots the percentage of games in each year with at least one achievement, and its right panel plots the median achievement count among games that list any. The second figure plots, for each band, the distribution of log10(1 + active player share) as boxes spanning the quartiles, with whiskers at 1.5 times the interquartile range and outliers hidden.
The primary model was a negative binomial regression with log link for the count of concurrent users, with the logarithm of owners (in units of 10,000) as offset, so that coefficients are rate ratios of the active player share. This family was chosen because concurrent users are counts with a long right tail, and the log link makes each coefficient a ratio: a rate ratio of 1.10 means 10% more concurrent users per owner for each doubling of achievements. The log2 transformation imposes diminishing returns on the continuous model, and the banded model relaxes that assumption. The dispersion parameter was estimated by maximum likelihood and then fixed in a generalised linear model with heteroscedasticity-robust (HC1) standard errors. The crude model contained only the exposure, and the adjusted model added price, free indicator, genres and release year. The rate ratio is reported per doubling of achievements with its 95% confidence interval. A second adjusted model replaced the continuous exposure with the bands, using games without achievements as reference. The third figure plots the unadjusted and adjusted band rate ratios on a logarithmic axis with 95% confidence intervals.
Seven sensitivity analyses repeated the adjusted continuous model after adding the share of positive reviews, excluding free games, excluding games with 200 or more achievements, using the lower or the upper bound of the owner range as exposure, restricting to releases from 2010 to 2019, and restricting to games with at least one achievement. For the secondary outcome, a linear regression with robust errors estimated the change in percentage points of the median earn rate per doubling of achievements, crude and adjusted for the same covariates, among games with at least one achievement. The fourth figure plots the median earn rate by band for those games.
Tests were two-sided with a significance level of 0.05. No correction for multiplicity was applied because the secondary and sensitivity analyses were exploratory.
All steps from download to figures were scripted, and the stored extracted records allow the derived variables to be rebuilt. The analysis script was executed twice on the same inputs and produced identical metrics, which is expected because the models contain no random component. Tables and figures were produced by the script, and every number in the text was drawn from its output.
Ethical considerations
The study analysed aggregated public metadata on games and contained no personal data and no participant recruitment.
RESULTS
Of the 1,600 applications ranked by user reviews, 1,597 returned a store record, and 1,341 games met the release window and owner criteria. The exclusions were 16 games without a valid release date and 240 released outside the window. The sample contained 1,172 games (87.4%) that listed at least one achievement, and the median count among them was 49 (first to third quartile 32 to 74).
The ranking rule left 3 applications without a store record. The remaining games were spread unevenly across bands: the 20 to 49 band was the largest, with 452 games (33.7%), and the 1 to 19 band was the smallest, with 135 games (10.1%).
The pattern of adoption climbed from 60.7% of 2010 releases with at least one achievement to 90.8% of 2023 releases (Figure 1). The peak reached 94.4% in 2022, and the earliest cohort held 28 games against 120 in the latest.
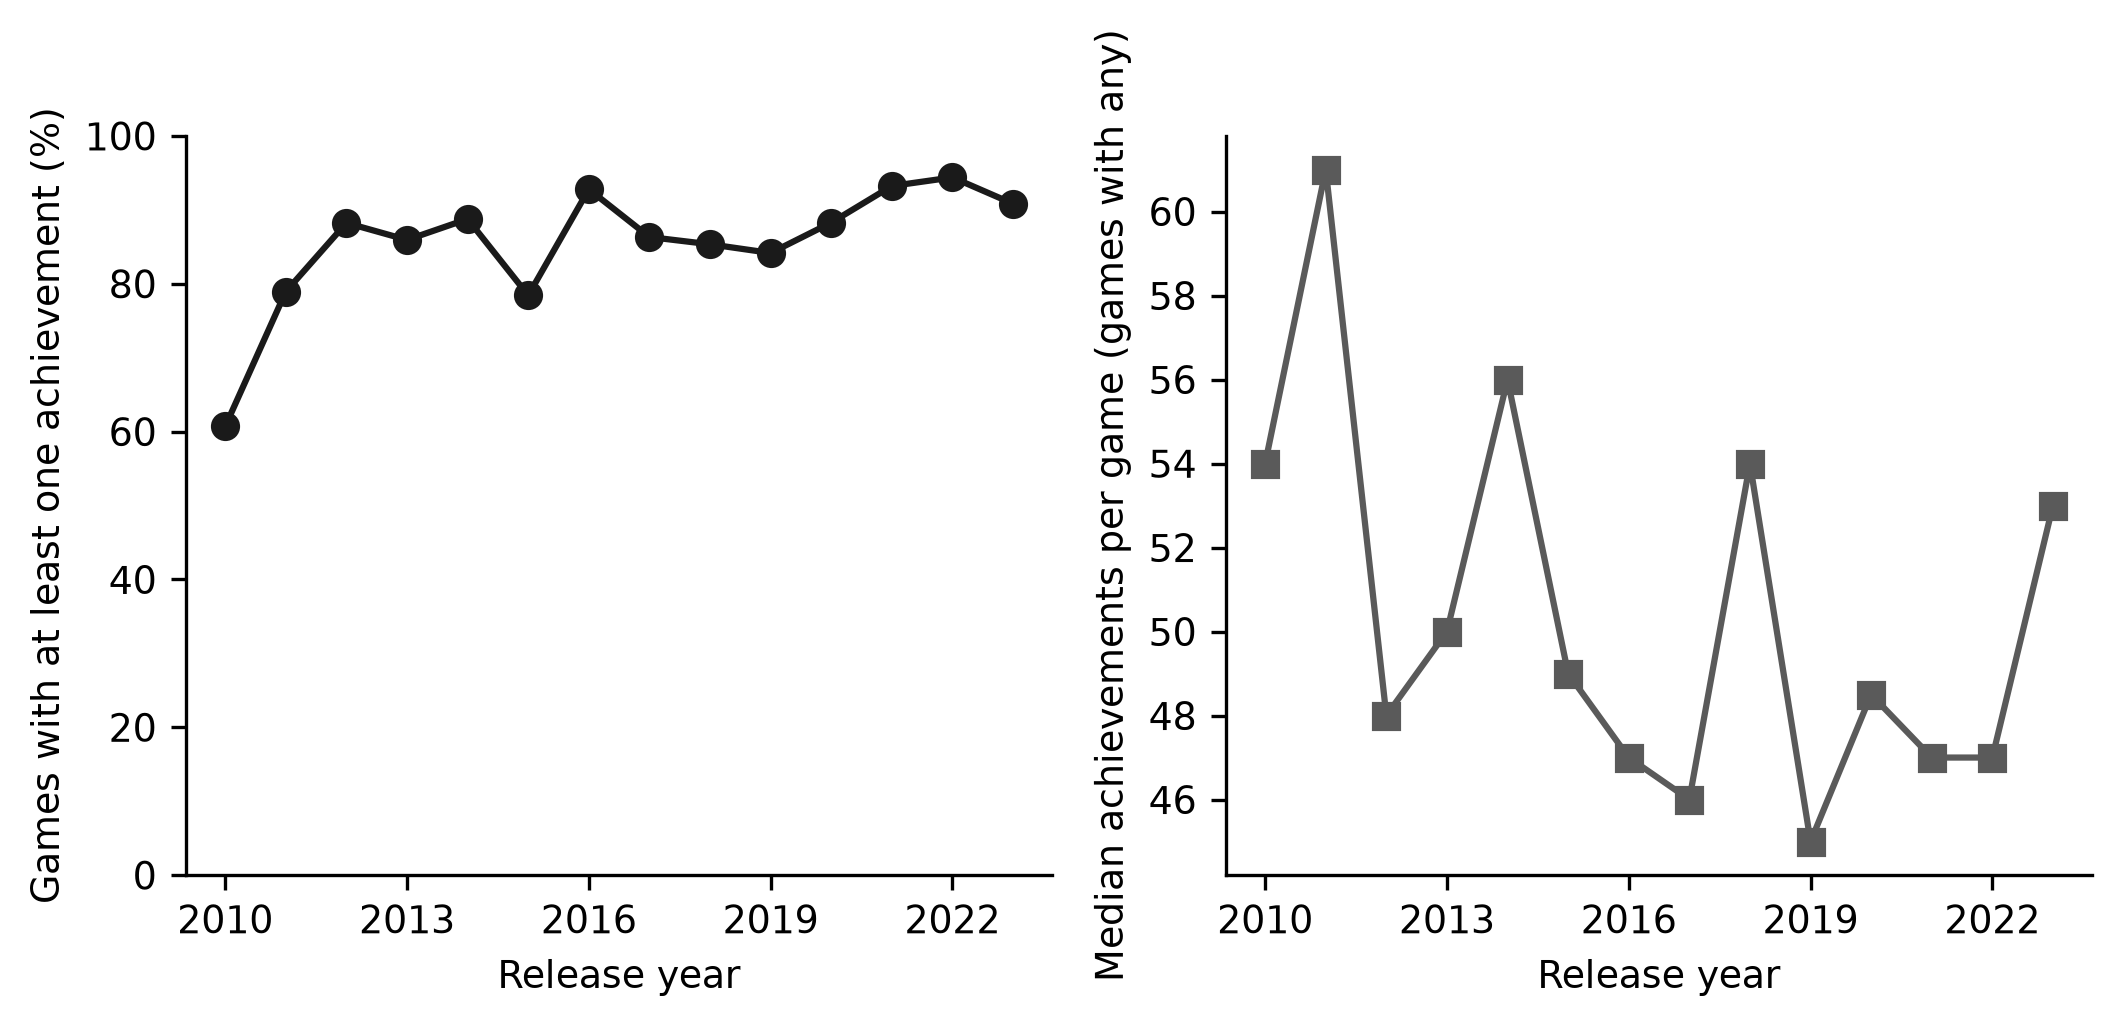
Figure 1. Adoption and size of achievement lists by release year.
Note: Left panel, percentage of games with at least one achievement. Right panel, median number of achievements among games that list any.The slope of list size stayed flat. The median among games with any achievement was 54 for 2010 releases and 53 for 2023 releases, with its highest value of 61 in 2011. Release year and achievement count were uncorrelated among games with any achievement (Spearman rho = −0.02, p = 0.432).
The distribution of the active player share spread across the five bands, with a median of 0.5 concurrent users per 10,000 owners in the 1 to 19 band and 4.4 in the 100 or more band (Figure 2; Table 1). Games without achievements sat at 1.1. The differences were significant (Kruskal-Wallis H = 107.8, p <0.001), and the rank correlation between achievement count and active player share was 0.25 (p <0.001).
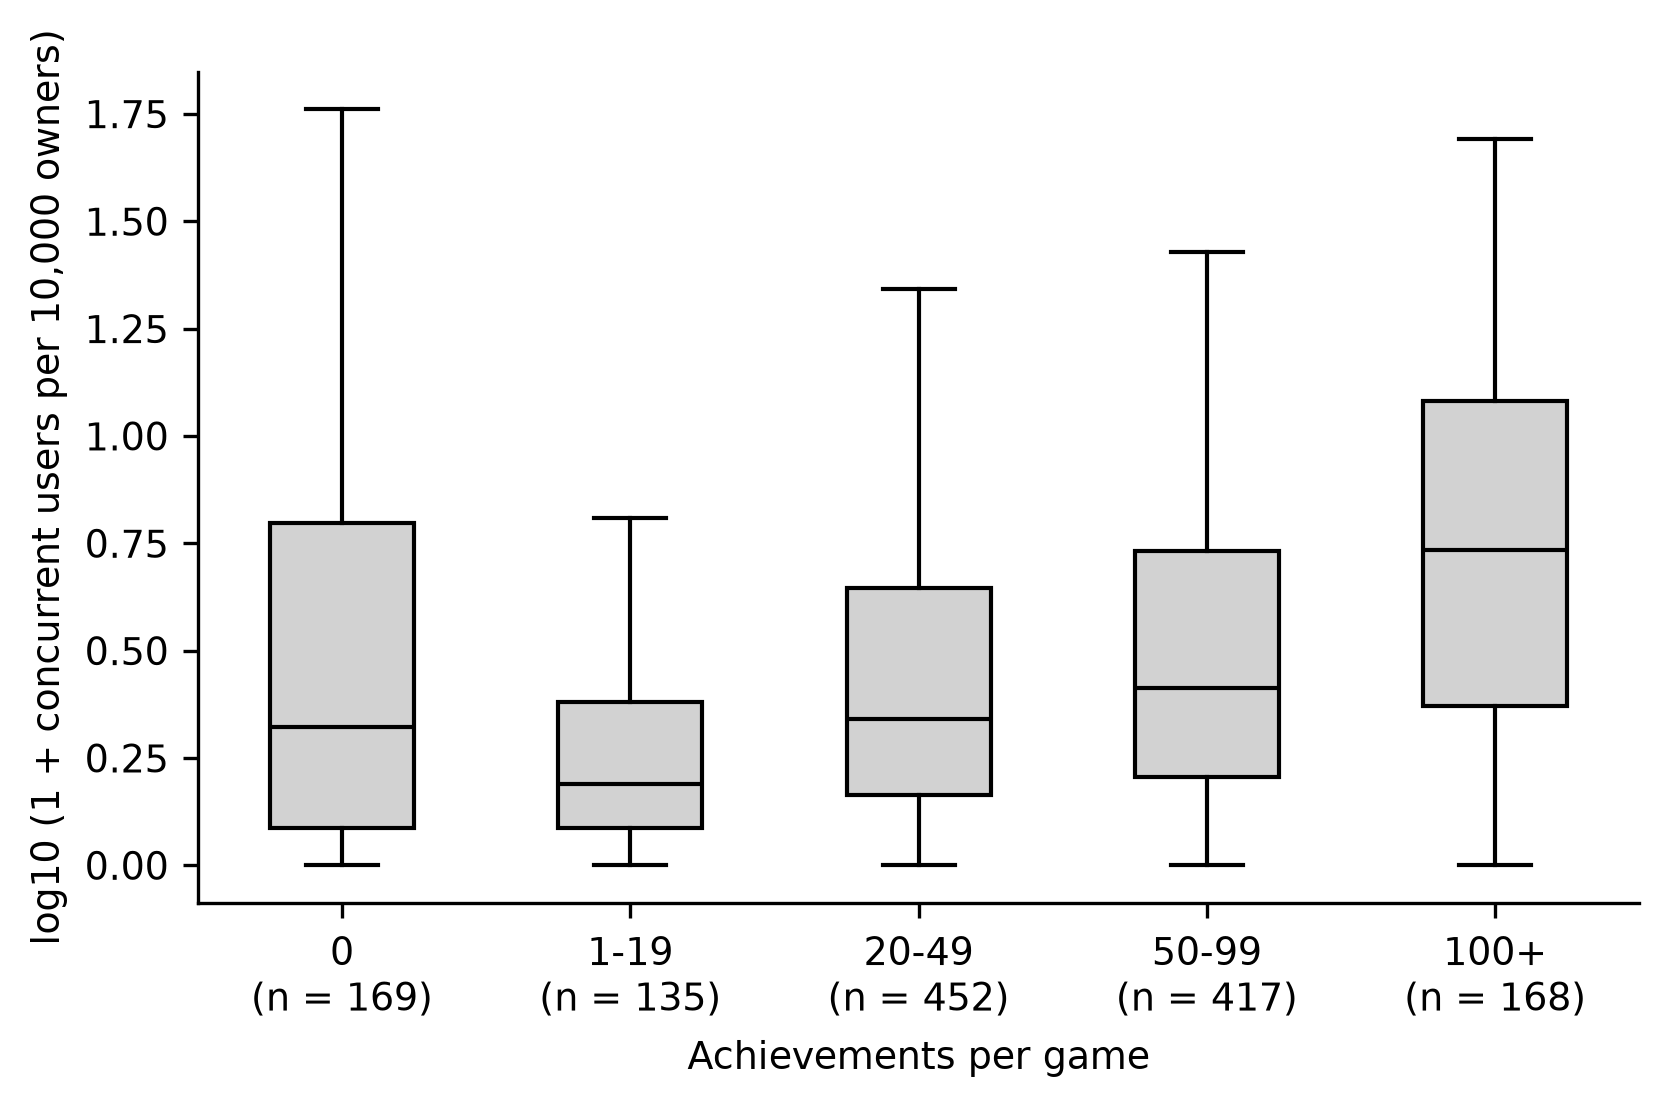
Figure 2. Distribution of the active player share by achievement band.
Note: Boxes span the first to third quartile with the median as the central line. Whiskers extend to 1.5 times the interquartile range. Outliers are not drawnAchievement band | Games (n) | Release year, median | Free to play (%) | List price (USD), median | Owners (thousands), median | Concurrent users per 10,000 owners, median [Q1-Q3] | Median earn rate (%), median [Q1-Q3] |
|---|---|---|---|---|---|---|---|
0 | 169 | 2017 | 47.3 | 19.99 | 1500 | 1.1 [0.2-5.3] | NA |
1-19 | 135 | 2017 | 18.5 | 14.99 | 1500 | 0.5 [0.2-1.4] | 21.1 [8.7-34.9] |
20-49 | 452 | 2019 | 14.8 | 19.99 | 1500 | 1.2 [0.5-3.4] | 15.2 [7.5-25.8] |
50-99 | 417 | 2018 | 10.3 | 29.99 | 1500 | 1.6 [0.6-4.4] | 11.7 [5.6-19.2] |
100+ | 168 | 2018 | 16.7 | 24.99 | 3500 | 4.4 [1.4-11.0] | 4.8 [2.4-13.1] |
Note: Q1-Q3 = first and third quartiles. Earn rate = median across a game's achievements of the percentage of players who earned each achievement; NA = not applicable because the game lists no achievements. Owners are range midpoints. Source: SteamSpy public API, Steam Store API and Steamworks Web API; games released between 2010 and 2023.
The composition of the bands differed. Free games made up 47.3% of the band without achievements and 16.7% of the band with 100 or more. Games with zero concurrent users in the snapshot numbered 17 (1.3% of the sample), and 4.7% of the games without achievements were among them.
The slope of the crude model was shallow: the active player share rose by a factor of 1.03 per doubling of achievements (0.98-1.09). After adjustment for price, genre and release year, the rate ratio was 1.03 (0.98-1.08; p = 0.185), which is 3.2% per doubling with an interval that included no change (Table 2).
Model | Rate ratio | 95% CI | p | Games (n) |
|---|---|---|---|---|
Crude, per doubling of achievements | 1.03 | 0.98-1.09 | 0.23 | 1341 |
Adjusted, per doubling: primary model | 1.03 | 0.98-1.08 | 0.18 | 1341 |
Adjusted, per doubling: adding positive review share | 1.04 | 0.99-1.09 | 0.12 | 1341 |
Adjusted, per doubling: excluding free-to-play games | 1.04 | 0.98-1.10 | 0.16 | 1098 |
Adjusted, per doubling: excluding games with 200 or more achievements | 0.97 | 0.92-1.02 | 0.27 | 1300 |
Adjusted, per doubling: lower bound of owner range as exposure | 1.03 | 0.99-1.08 | 0.16 | 1341 |
Adjusted, per doubling: upper bound of owner range as exposure | 1.03 | 0.98-1.08 | 0.20 | 1341 |
Adjusted, per doubling: games released from 2010 to 2019 only | 1.03 | 0.97-1.09 | 0.39 | 836 |
Adjusted, per doubling: games with at least one achievement only | 1.24 | 1.12-1.38 | <0.001 | 1172 |
Note: CI = confidence interval. Rate ratios come from negative binomial models with log owners as offset. Adjusted models include price, free indicator, eight genre indicators and release year.
The adjusted bands departed from a straight line (Figure 3). The rate ratio dropped to 0.52 (0.37-0.73) in the 20 to 49 band and 0.66 (0.47-0.93) in the 50 to 99 band, relative to games without achievements. The 1 to 19 band gave 0.80 (0.42-1.53), and the 100 or more band climbed to 1.61 (1.09-2.38).
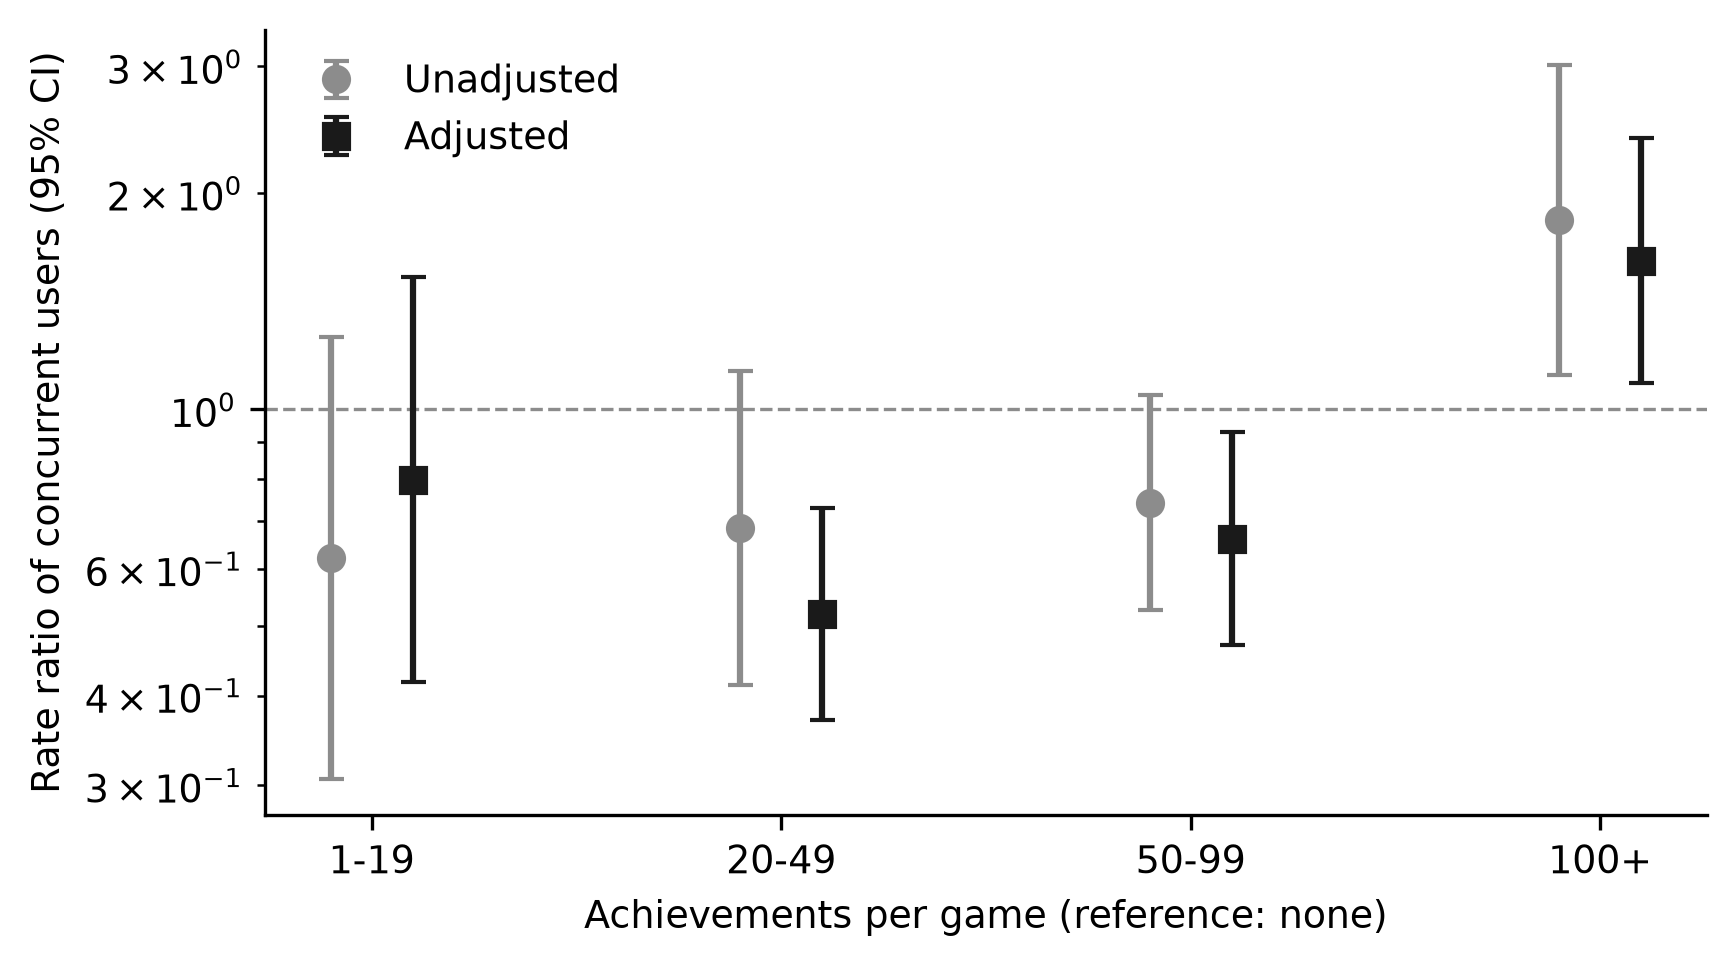
Figure 3. Rate ratio of the active player share by achievement band.
Note: Reference category, games without achievements. Adjusted estimates account for price, free indicator, genre and release year. Bars show 95% confidence intervals on a logarithmic axis. Source: SteamSpy public API and Steam Store API; own analysis.The sensitivity analyses clustered around the primary estimate, with rate ratios from 0.97 after excluding games with 200 or more achievements to 1.04 after adding the share of positive reviews. Releases from 2010 to 2019 gave 1.03, and the exclusion of free games gave 1.04. The lower and upper owner bounds gave 1.03 and 1.03. The dispersion parameter of the adjusted model was 1.71. Restriction to games with at least one achievement was the exception: the rate ratio per doubling reached 1.24 (1.12-1.38; p <0.001) among 1,172 games.
Among the covariates, the active player share was 2.76 times higher for massively multiplayer games and 1.71 times higher for simulation games, the share was 1.24 times higher for free games, and each unit of log price carried a ratio of 1.16, while it was lower for indie (0.73) and action (0.75) games, each against games without that label.
The highest earn rates sat in the shortest lists. The median earn rate dropped from 21.1% in the 1 to 19 band to 4.8% in the 100 or more band (Figure 4). Across the 1,169 games with earn data, the median was 12.9% (first to third quartile 5.5 to 22.3).
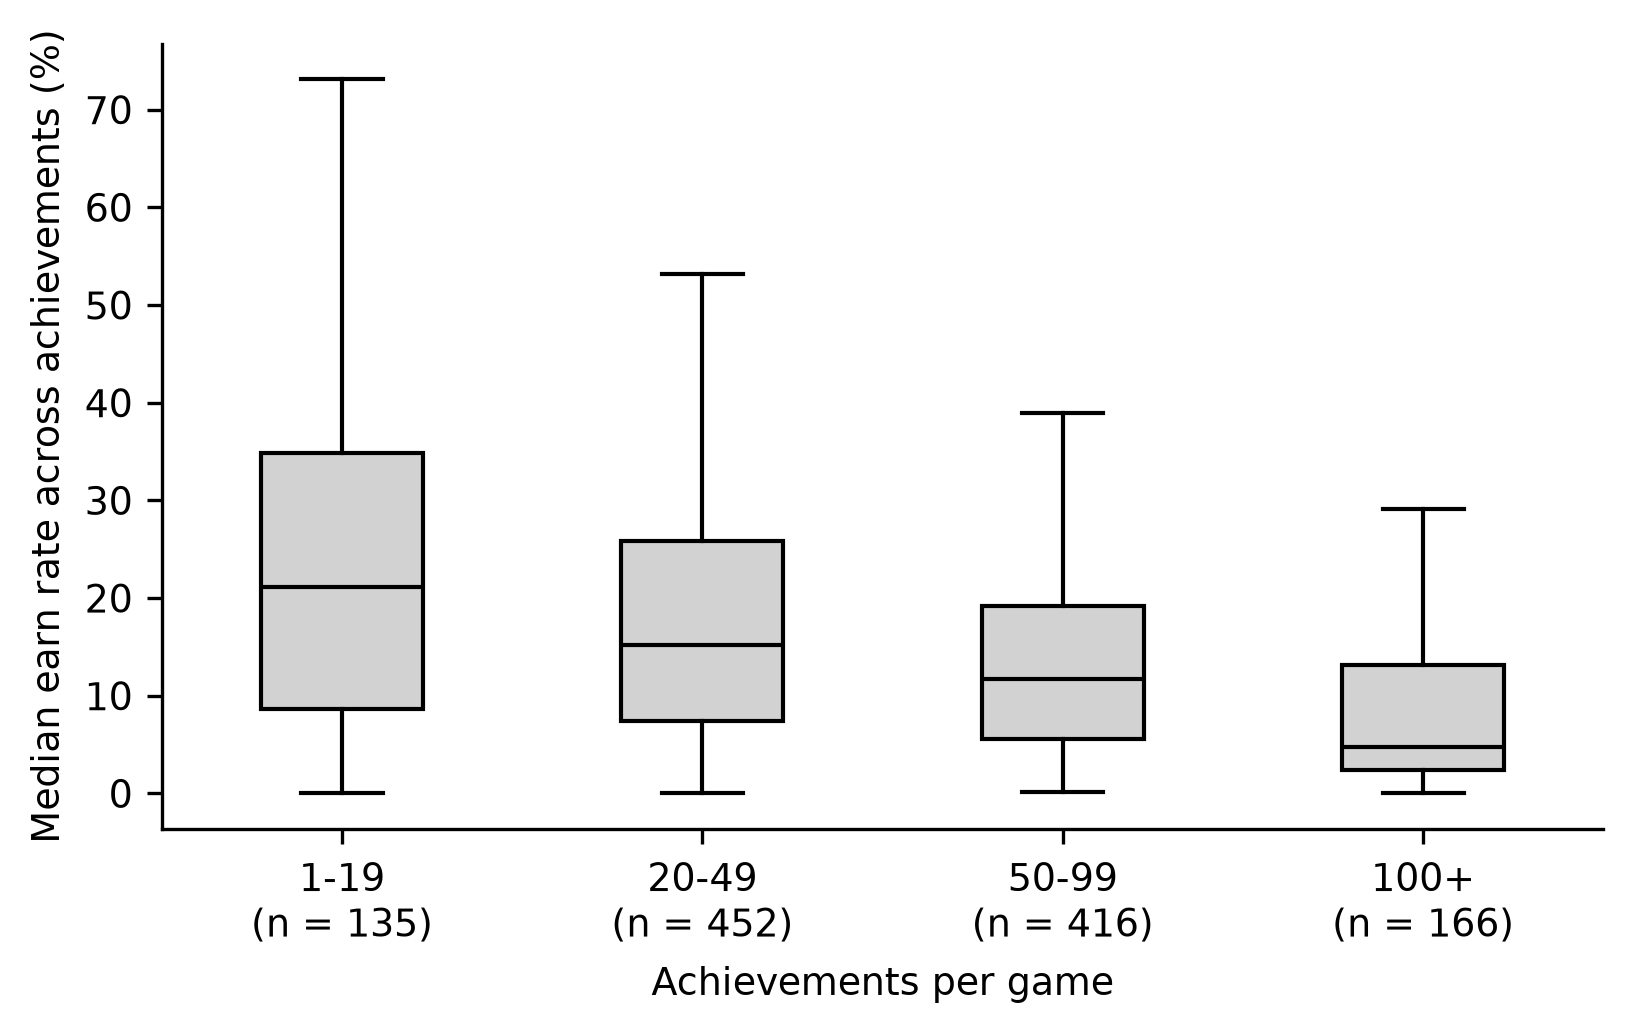
Figure 4. Median earn rate of achievements by achievement band.
Note: Earn rate is the percentage of players who earned an achievement, summarised as the median per game. Boxes span the first to third quartile. Games without achievements are excluded.The earn rate fell with list size in both models. Each doubling of achievements coincided with a change of −4.5 percentage points in the crude model and −3.8 percentage points after adjustment (−4.67 to −2.97; p <0.001), and the rank correlation was −0.31.
DISCUSSION
The main finding is that the number of achievements did not track the active player share along a straight line. Mid-sized lists coincided with a lower share than no list at all, very long lists coincided with a higher one, and the continuous estimate was compatible with no association. The expected pattern of a rising curve that flattens at high counts was therefore not supported in the full sample. It appeared only when games without any achievement were set aside, and the earn rate of achievements fell as lists grew.
The adoption pattern in the first figure agrees with the picture of achievements as a standard layer of platform design. Achievement systems were adopted widely on gaming platforms to maintain players' interest,(2) and an analysis of 18,658 Steam-listed games reported that achievements were tied to engagement with the publishing platform.(14) The plateau after the early years differs from the trajectory of monetisation features, which grew rapidly between 2012 and 2014 among the most-played Steam desktop games.(12) A flat list size across release years suggests a convention among developers more than a response to market change, although this sample cannot test that explanation.
Cohort sizes differ, from 28 games in 2010 to 145 in 2020, so the early percentages rest on small counts and the 2010 value carries wide uncertainty. Ranking by reviews also favours older games that had years to accumulate reviews, which would blur the contrast between early and late cohorts. Release-year indicators in the adjusted model absorb part of these cohort differences, and the pre-2020 restriction gave the same estimate as the full sample.
The distribution in the second figure needs to be read with the composition of the bands. Free games made up 47.3% of the band without achievements, and free-to-play titles depend on in-game purchases and advertising, which makes behavioural telemetry and retention a business requirement for them.( 7) That structure can give a no-achievement game a high active share for reasons unrelated to rewards. The adjustment for a free indicator and price addressed part of this problem, but business models are broader than a price of zero, and the residual difference between the reference band and the others should be read with that caution.
Dividing concurrent users by an owner range makes the outcome sensitive to the width of the range, and the ranges are wide where ownership is high. A game with between 20 million and 50 million owners can differ by a factor of 2.5 in its denominator, and the games at the top of the distribution are therefore measured with the most error. The sensitivity analyses with the lower and upper bounds reproduced the primary estimate, which indicates that the midpoint choice did not drive the result.
The dip in the middle bands and the rise above 100 achievements may reflect two different kinds of titles. The massively multiplayer label carried the largest genre rate ratio in the adjusted model, and persistent online designs may account for part of the rise above 100 achievements, a point this analysis did not test by band. In an online multiplayer game, achievement features predicted longevity from the initial to the advanced phases of play, while social features became the strongest predictor at the highest level.(8) Gaming performance and player popularity also predicted highly active players in another online social game.( 17) A long achievement list in such a title may be one expression of a large content base that keeps players returning, which would make the achievements a marker and not a cause.
The result among games that list achievements, a rate ratio of 1.24 per doubling, fits the logic that achievements add optional goals and rewards that extend play.(1,18) The gap between this estimate and the full-sample estimate shows that the choice of comparison group drives the conclusion. Players do not respond uniformly either: typologies synthesised from earlier work separate player types,( 19) and adaptive achievements matched to player types were proposed to preserve intrinsic motivation.( 20)
Self-determination theory offers a reading of why the association among games with achievements could be positive. Gaming engagement has been linked to the satisfaction of the needs for competence, autonomy and relatedness, and the frustration of the same needs to problematic use.(21) Battle royale play was examined through the same lens in relation to values and well-being,(22) and an experiment with game versions built on self-determination, self-efficacy or both found no significant difference in engagement or performance among them.(23) Achievements speak most directly to competence, since they mark mastery of optional challenges. This study measured none of the needs, so the theory frames an interpretation and does not receive support from the data.
The competing account, in which extrinsic rewards weaken intrinsic interest, cannot be tested with an aggregate snapshot.(5,10) A flat association at moderate list sizes is compatible with that account, but it is also compatible with lists that carry no motivational content. Evidence from gamification research points to context dependence: positive effects were reported in a review of empirical studies, and they depended on the context and the users.(24) A meta-analysis in education found a large pooled effect of gamification on learning outcomes.(25) A single-element experiment found motivational gains from each of four design elements, badges among them.(26) Those outcomes concern learners and motivation, and they do not transfer directly to commercial game retention.
Parallels from gamified education and health point to the same caution. In a field study with 46 new students, an achievement system had some effect on engagement with orientation activities and no evident effect on user experience.(27) Digital badges work through both their mechanics and the psychology of recognising and pursuing them, and designs that ignore the second part lose effect.(28) Choosing the right combination of game elements remains a challenge for gamification designers in e-learning, where dropout and low completion are frequent problems.(29) Commercial games offer many designs side by side for these questions.
The fall in the earn rate with list size matches the way long lists are built. Additional achievements probably add late-game or optional feats that few players complete, and the dependence of the measure on list length was anticipated in the Methods. Data mining of achievement completion rates found that, for most games, few players consume the content provided, and that higher quality content kept a higher player retention rate,( 30) and a dataset of console trophies was assembled to study achievements from the viewpoint of developers and players.( 2) The present result suggests that a developer who doubles the list should expect the typical achievement to be earned by fewer players.
Steam has served as a data source for market and behavioural studies, from virtual reality application markets( 31) to a panorama of multiplayer games built from player reviews.( 32) The present study adds achievement design to that list and does so with a measure of activity relative to the owner base, which separates popularity from retention to a degree that raw concurrent users cannot. A player-level analysis of motivations in relation to achievement systems would complement the aggregate view taken here.
Further Steam studies describe how the covariates and the outcome behave. Genre labels on Steam are partly user-generated tags, and tag networks provide an alternative way to understand genres,(33) so the eight genre indicators used here are an approximation. Positive reviews and playtime correlated slightly to moderately in souls-like games,(34) and peer reviews were followed by higher play rates in a Steam sample.(35) Adding the share of positive reviews moved the estimate only marginally, which suggests that perceived quality did not explain the weak association. The concurrent-user measure also responds to context: daily player peaks of Steam games rose in a pandemic period.(36)
Definitions of gamification vary among scholars and practitioners,(37) and a service-marketing definition stresses the consumer as a co-producer of the experience.(38) Under any of them, achievements are among the most portable elements, which is why their behavioural effect matters beyond games. Educational studies compare few designs at a time; one experiment pair in online physics courses compared badges with leaderboards for academic performance and motivation.(39) A game store holds thousands of designs on one platform, and the typical list among games with achievements held 49 of them. That benchmark gives educators and health designers a reference for list size in commercial practice.
The results carry several limitations. First, the outcome is a single snapshot of concurrent users, which depends on the moment and on updates, and in a study of one title major but infrequent updates raised player engagement by 11% to 49% in most cases.( 40) A series of repeated snapshots or daily peaks would allow a within-game measure. Second, owners are known only as ranges, and the midpoint was a coarse exposure, although the lower and upper bounds gave the same estimate. Sources with exact ownership counts would remove that source of error.
Third, the sample consisted of the games ranked highest by reviews, so low-visibility titles are missing, and a sample stratified by review count would test whether the association differs in them. Fourth, the design is cross-sectional and ecological, and unmeasured features such as marketing, update cadence, multiplayer modes and studio size can confound the association. A panel that follows the same games before and after an update that adds achievements would come closer to a causal contrast. Fifth, the achievement count carries no information on difficulty, visibility or type, and coding achievement types would allow a test of which designs relate to retention.
Cross-game analyses on Steam combined ownership and playtime for more than 3,000 games and 6 million players,( 11) and cross-game models of playtime characterised how interest in games evolves.( 41) Achievement counts could enter such models as a game-level covariate, which would connect the aggregate association reported here with the behaviour of individual players. Until then, the present estimates describe games and not players, and an association at the game level need not hold for any single player.
Retention research in online social games relies on features of play and of the surrounding community. Replay-sharing communities provided in-game and out-of-game features for predicting player and uploader retention.( 42) Survival curves of days after first login, game level and playtime were used to profile high-spending players.( 43) These methods operate on logs that a platform or developer holds, which explains why public aggregates cannot replace them but can screen which design features deserve a log-based test.
Retention in its usual analytic sense needs individual-level logs. Survival analysis and cumulative-function methods measure the time to abandonment and handle censoring,(6,44) and churn models predict departure from logs of play.(45,46) The proxy used here describes the active share of an owner base and is a coarser quantity. Its strengths are that it is reproducible from open sources without login, that it covers 1,341 games released between 2010 and 2023, and that the primary estimate was stable in six of the seven sensitivity analyses.
Transferability to Latin America cannot be assessed with these data for two reasons: the sources carry no country of play, and the price variable is the list price in United States dollars. Players in the region buy the same titles on the same platform, so the observations on list size and earn rate describe the catalogue that those players also see. Differences in retention linked to purchasing power, connectivity or language would require regional data, such as country-level concurrent users. Studies in the region that gamify courses or clinical tools can use the descriptive benchmark above and test their own designs in their own users.
For designers, the results do not support adding achievements in the moderate range as a lever for retention. A review of empirical studies found that the effects of gamification depend on the context and on the users,( 24) and the data agree with that dependence for moderate lists. Very long lists and lists in games that already hold a persistent audience deserve separate testing, because the positive estimates concentrated there.
CONCLUSIONS
Achievement adoption rose from the earliest to the latest release years while the size of achievement lists stayed flat.
The active player share differed across achievement bands and was highest in games with 100 or more achievements.
After adjustment for price, genre and release year, achievement count was not associated with a higher active player share per doubling in the full sample, and the positive association appeared only among games that list achievements.
The share of players earning the typical achievement was lower in games with longer lists.
References
- 1 Hamari J, Eranti V. Framework for Designing and Evaluating Game Achievements. DiGRA Digital Library. 2011. doi: 10.26503/dl.v2011i1.545
- 2 Kwak H. You Have Earned a Trophy: Characterize In-Game Achievements and Their Completions. 14th ACM Web Science Conference 2022. 2022:129-138. doi: 10.1145/3501247.3531582
- 3 Lewis I, de Salas K, Wells L. Features of Achievement systems. Proceedings of CGAMES'2013 USA. 2013:66-73. doi: 10.1109/cgames.2013.6632608
- 4 Deterding S, Dixon D, Khaled R, Nacke L. From game design elements to gamefulness. Proceedings of the 15th International Academic MindTrek Conference: Envisioning Future Media Environments. 2011:9-15. doi: 10.1145/2181037.2181040
- 5 Lewis ZH, Swartz MC, Lyons EJ. What's the Point?: A Review of Reward Systems Implemented in Gamification Interventions. Games for Health Journal. 2016;5(2):93-99. doi: 10.1089/g4h.2015.0078
- 6 Viljanen M, Airola A, Heikkonen J, Pahikkala T. Playtime Measurement With Survival Analysis. IEEE Trans Games. 2018;10(2):128-138. doi: 10.1109/tciaig.2017.2727642
- 7 Hadiji F, Sifa R, Drachen A, Thurau C, Kersting K, Bauckhage C. Predicting player churn in the wild. 2014 IEEE Conference on Computational Intelligence and Games. 2014:1-8. doi: 10.1109/cig.2014.6932876
- 8 Park K, Cha M, Kwak H, Chen KT. Achievement and Friends. Proceedings of the 26th International Conference on World Wide Web Companion - WWW '17 Companion. 2017:445-453. doi: 10.1145/3041021.3054176
- 9 Strååt B, Verhagen H. Exploring Video Game Design and Player Retention- a Longitudinal Case Study. Proceedings of the 22nd International Academic Mindtrek Conference. 2018:39-48. doi: 10.1145/3275116.3275140
- 10 Zulkifly A, Lewis I, de Salas K. Do Achievement systems undermine intrinsic player motivation?. Proceedings of CGAMES'2013 USA. 2013:19-22. doi: 10.1109/cgames.2013.6632598
- 11 Sifa R, Drachen A, Bauckhage C. Large-Scale Cross-Game Player Behavior Analysis on Steam. AIIDE. 2015;11(1):198-204. doi: 10.1609/aiide.v11i1.12804
- 12 Zendle D, Meyer R, Ballou N. The changing face of desktop video game monetisation: An exploration of exposure to loot boxes, pay to win, and cosmetic microtransactions in the most-played Steam games of 2010-2019. PLoS ONE. 2020;15(5):e0232780. doi: 10.1371/journal.pone.0232780
- 13 Guzsvinecz T, Szűcs J. Length and sentiment analysis of reviews about top-level video game genres on the steam platform. Computers in Human Behavior. 2023;149:107955. doi: 10.1016/j.chb.2023.107955
- 14 Rizani MN, Khalid MNA, Iida H. Application of Meta-Gaming Concept to the Publishing Platform: Analysis of the Steam Games Platform. Information. 2023;14(2):110. doi: 10.3390/info14020110
- 15 SteamSpy. SteamSpy API documentation [Internet]. n.d. Available from: https://steamspy.com/api.php
- 16 Valve Corporation. Steamworks Web API documentation: ISteamUserStats interface [Internet]. n.d. Available from: https://partner.steamgames.com/doc/webapi/ISteamUserStats
- 17 Gu L, Jia AL. Player Activity and Popularity in Online Social Games and their Implications for Player Retention. 2018 16th Annual Workshop on Network and Systems Support for Games (NetGames). 2018;2018-June:1-6. doi: 10.1109/netgames.2018.8463415
- 18 Wang H, Sun CT. Game reward systems: Gaming experiences and social meanings. DiGRA Digital Library. 2011. doi: 10.26503/dl.v2011i1.594
- 19 Hamari J, Tuunanen J. Player Types: A Meta-synthesis. ToDIGRA. 2014;1(2). doi: 10.26503/todigra.v1i2.13
- 20 Volkmar G, Pfau J, Teise R, Malaka R. Player Types and Achievements -- Using Adaptive Game Design to Foster Intrinsic Motivation. Extended Abstracts of the Annual Symposium on Computer-Human Interaction in Play Companion Extended Abstracts. 2019:747-754. doi: 10.1145/3341215.3356278
- 21 Mills DJ, Milyavskaya M, Mettler J, Heath NL. Exploring the pull and push underlying problem video game use: A Self-Determination Theory approach. Personality and Individual Differences. 2018;135:176-181. doi: 10.1016/j.paid.2018.07.007
- 22 Fernandez de Henestrosa M, Billieux J, Melzer A. Last Man Standing: Battle Royale Games Through the Lens of Self-Determination Theory. Games and Culture. 2023;18(4):427-448. doi: 10.1177/15554120221101312
- 23 Jamshidifarsani H, Tamayo-Serrano P, Garbaya S, Lim T, Blazevic P. Integrating Self-Determination and Self-Efficacy in Game Design. In: Lecture Notes in Computer Science. Springer International Publishing; 2019. p. 178-190. doi: 10.1007/978-3-030-11548-7_17
- 24 Hamari J, Koivisto J, Sarsa H. Does Gamification Work? -- A Literature Review of Empirical Studies on Gamification. 2014 47th Hawaii International Conference on System Sciences. 2014:3025-3034. doi: 10.1109/hicss.2014.377
- 25 Li M, Ma S, Shi Y. Examining the effectiveness of gamification as a tool promoting teaching and learning in educational settings: a meta-analysis. Front Psychol. 2023;14:1253549. doi: 10.3389/fpsyg.2023.1253549
- 26 Mazarakis A, Bräuer P. Gamification is Working, but Which One Exactly? Results from an Experiment with Four Game Design Elements. International Journal of Human–Computer Interaction. 2023;39(3):612-627. doi: 10.1080/10447318.2022.2041909
- 27 Fitz-Walter Z, Wyeth P, Tjondronegoro D, Johnson D. Exploring the effect of achievements on students attending university orientation. Proceedings of the first ACM SIGCHI annual symposium on Computer-human interaction in play. 2014:87-96. doi: 10.1145/2658537.2658700
- 28 McDaniel R, Fanfarelli J. Building Better Digital Badges. Simulation & Gaming. 2016;47(1):73-102. doi: 10.1177/1046878115627138
- 29 Khaldi A, Bouzidi R, Nader F. Gamification of e-learning in higher education: a systematic literature review. Smart Learn Environ. 2023;10(1):10. doi: 10.1186/s40561-023-00227-z
- 30 Bailey E, Miyata K. Improving video game project scope decisions with data: An analysis of achievements and game completion rates. Entertainment Computing. 2019;31:100299. doi: 10.1016/j.entcom.2019.100299
- 31 Stecuła K. Virtual Reality Applications Market Analysis—On the Example of Steam Digital Platform. Informatics. 2022;9(4):100. doi: 10.3390/informatics9040100
- 32 Petrosino S, Loria E, Kainz A, Pirker J. The Panorama of Steam Multiplayer Games (2018-2020): A Player Reviews Analysis. Proceedings of the 17th International Conference on the Foundations of Digital Games. 2022:1-7. doi: 10.1145/3555858.3555922
- 33 Li X, Zhang B. A preliminary network analysis on steam game tags. Proceedings of the 23rd International Conference on Academic Mindtrek. 2020:65-73. doi: 10.1145/3377290.3377300
- 34 Guzsvinecz T. The correlation between positive reviews, playtime, design and game mechanics in souls-like role-playing video games. Multimed Tools Appl. 2023;82(3):4641-4670. doi: 10.1007/s11042-022-12308-1
- 35 Brodschneider V, Pirker J. On the Influence of Reviews on Play Activity on Steam - A Statistical Approach. 2023 IEEE Conference on Games (CoG). 2023:1-5. doi: 10.1109/cog57401.2023.10333235
- 36 Croissant M, Frister M. A data-driven approach for examining the demand for relaxation games on Steam during the COVID-19 pandemic. PLoS ONE. 2021;16(12):e0261328. doi: 10.1371/journal.pone.0261328
- 37 Landers RN, Auer EM, Collmus AB, Armstrong MB. Gamification Science, Its History and Future: Definitions and a Research Agenda. Simulation & Gaming. 2018;49(3):315-337. doi: 10.1177/1046878118774385
- 38 Huotari K, Hamari J. A definition for gamification: anchoring gamification in the service marketing literature. Electron Markets. 2017;27(1):21-31. doi: 10.1007/s12525-015-0212-z
- 39 Balci S, Secaur JM, Morris BJ. Comparing the effectiveness of badges and leaderboards on academic performance and motivation of students in fully versus partially gamified online physics classes. Educ Inf Technol. 2022;27(6):8669-8704. doi: 10.1007/s10639-022-10983-z
- 40 Zhong X, Xu J. Measuring the effect of game updates on player engagement: A cue from DOTA2. Entertainment Computing. 2022;43:100506. doi: 10.1016/j.entcom.2022.100506
- 41 Sifa R, Bauckhage C, Drachen A. The Playtime Principle: Large-scale cross-games interest modeling. 2014 IEEE Conference on Computational Intelligence and Games. 2014:1-8. doi: 10.1109/cig.2014.6932906
- 42 Gu L, Shen X, Jia AL. User Activities in Game Replay Sharing Communities and Their Implications for User Retention. IEEE Trans Games. 2021;13(2):205-215. doi: 10.1109/tg.2021.3058187
- 43 del Rio AF, Pei Chen P, Perianez A. Profiling Players with Engagement Predictions. 2019 IEEE Conference on Games (CoG). 2019;2019-August:1-4. doi: 10.1109/cig.2019.8848074
- 44 Viljanen M, Airola A, Majanoja AM, Heikkonen J, Pahikkala T. Measuring Player Retention and Monetization Using the Mean Cumulative Function. IEEE Trans Games. 2020;12(1):101-114. doi: 10.1109/tg.2020.2964120
- 45 Bertens P, Guitart A, Perianez A. Games and big data: A scalable multi-dimensional churn prediction model. 2017 IEEE Conference on Computational Intelligence and Games (CIG). 2017:33-36. doi: 10.1109/cig.2017.8080412
- 46 Demediuk S, Murrin A, Bulger D, Hitchens M, Drachen A, Raffe WL, et al. Player retention in league of legends. Proceedings of the Australasian Computer Science Week Multiconference. 2018:1-9. doi: 10.1145/3167918.3167937
Declarations
Funding
No financing
Conflict of interest
None
Authorship contributions
Drafting – original draft: Dhamelis Anaya Rios, Analía Ortigoza.
Writing–review and editing: Dhamelis Anaya Rios, Analía Ortigoza.