

Abstract
Introduction: Out-of-pocket payments create the largest financial barrier to dental care in the United States, where dental benefits are separate from medical insurance and coverage is incomplete. This study quantified out-of-pocket dental expenditures and catastrophic dental spending among US adults by dental coverage status. Methods: Cross-sectional analysis of the 2023 Medical Expenditure Panel Survey Household Component (full-year consolidated file HC-251 and dental visits file HC-248B) among 14,768 adults aged 18 years or older, using survey weights, strata and primary sampling units. Catastrophic dental spending was defined as out-of-pocket dental spending of at least 10% of annual family income, with sensitivity thresholds of 5% and 20%. Results: Dental coverage reached 52.1% of adults. Any dental visit was reported by 53.2% of adults with coverage and 34.0% without. Among adults with a visit, mean out-of-pocket dental spending was $413 with coverage and $606 without (adjusted geometric mean ratio 0.77, 95% CI 0.68-0.88). Catastrophic spending at the 10% threshold affected 0.4% of adults with coverage and 0.7% without; the unadjusted odds ratio was 0.58 (95% CI 0.37-0.93) and the adjusted odds ratio was 1.21 (95% CI 0.64-2.27). Conclusions: Dental coverage is associated with higher utilization and lower out-of-pocket spending among users, but the protective association with catastrophic spending is explained by income and disappears after adjustment, indicating that poverty rather than coverage drives catastrophic dental burden.
Keywords
dental care, insurance, dental, health expenditures, out-of-pocket expenditures, adult, United States
INTRODUCTION
Dental care presents the highest level of financial barriers among all health care services in the United States.(1) Unlike medical care, adult dental benefits are usually not part of core health insurance. Traditional Medicare excludes routine dental care, Medicaid dental benefits for adults vary from state to state, and commercial plans sell dental coverage separately, frequently with annual maximums and coinsurance that shift the residual cost to the patient.(2) Adults therefore pay for much of their dental care out of pocket, and cost-related avoidance of dental treatment has persisted across decades despite broad coverage gains in medical care.(3) The consequences are clinical as well as financial: adults who defer care because of cost accumulate untreated disease, and unmet dental need attributed to cost has been linked prospectively to incident cardiovascular disease and dementia.(4)
Dental coverage in the United States is concentrated among working-age adults with employer-sponsored private benefits and contracts sharply at retirement, when adults move from Medicaid or employer plans into traditional Medicare without a dental benefit.(5,6) Among Medicare Advantage enrollees, the presence and generosity of dental benefits vary widely and shape whether beneficiaries obtain care.(7,8) Nationally representative studies document persistent socioeconomic and racial gradients in coverage, utilization and cost-related unmet dental need.(4,9,10) Out-of-pocket payments are the dominant financing source for adult dental care and account for a large share of total dental expenditure, a pattern that has held across two decades of survey data.(11,12)
In health financing research, catastrophic health expenditure is conventionally defined as out-of-pocket spending that exceeds 10% of household income or 40% of household capacity to pay.(13,14) The concept distinguishes spending that can be absorbed from spending that threatens a household's standard of living, and it anchors the Sustainable Development Goal indicator of financial protection. Applied to dentistry, studies in low- and middle-income countries show that out-of-pocket dental payments push a measurable fraction of households into catastrophic expenditure.(15-17) Evidence from high-income countries is sparser. In Spain, dental care was the health service that most frequently generated catastrophic household expenditure despite near-universal medical coverage,(18) and older adults in several European countries report dental care as a recurrent source of financial burden.(19) Estimates of catastrophic spending are also sensitive to the recall period, the items included and the threshold selected, which complicates cross-study comparison.(20,21) Two measurement points matter for the United States. First, the denominator in the US literature is usually annual family income rather than household consumption, because income is what survey respondents can report reliably and what public programs use to set cost sharing. Second, because US dental bills are moderate relative to income, the catastrophic measure may capture only the extreme tail of a broader distribution of financial strain.
Despite the size of the US dental market and the active policy debate about adding dental benefits to Medicare and to the essential health benefits, no recent nationally representative estimate has stratified out-of-pocket dental expenditures and catastrophic dental spending by whether adults hold dental coverage. Earlier tabulations of dental expenditure by coverage predate the current survey cycle,(11,22) and catastrophic dental spending has not been quantified in the United States with contemporary data. Cost-of-care analyses in the United States have instead concentrated on medical financial hardship among patients with serious illness,(23) leaving the routine dental burden of the general adult population largely undescribed. This gap weakens the empirical basis for judging how much financial protection dental coverage actually provides.
The objective of this study was to quantify out-of-pocket dental expenditures and catastrophic dental spending among US adults with and without dental coverage, and to characterize the empirical pathway from coverage through utilization to financial burden. It was anticipated that dental coverage would be associated with greater utilization and lower out-of-pocket spending per user, and that catastrophic dental spending would concentrate among lower-income adults regardless of coverage status.
METHODS
Study design and data source
Cross-sectional secondary analysis of the Medical Expenditure Panel Survey Household Component (MEPS-HC) for calendar year 2023. MEPS-HC is a nationally representative survey of the civilian noninstitutionalized population of the United States conducted by the Agency for Healthcare Research and Quality.(24) The study used the 2023 Full Year Consolidated Data File (HC-251, released August 2025) and the 2023 Dental Visits File (HC-248B, released May 2025), downloaded as public-use ASCII files with their SAS programming statements from the AHRQ website (https://meps.ahrq.gov/mepsweb/data_stats/download_data_files.jsp). The files require no login and carry no access restrictions. Reporting followed the STROBE statement for observational studies, and elements of the RECORD extension were applied because the source is a routine survey dataset.
Study population
The analytic sample comprised persons aged 18 years and older with a positive survey weight and non-missing dental coverage indicators. Persons younger than 18 years (n = 3,648) and persons without a valid survey weight (n = 355) were excluded. The final sample included 14,768 adults, representing a weighted population of 259.7 million adults. Analyses that used family income as a denominator were restricted to the 14,296 adults in families with positive income, because a ratio of out-of-pocket spending to non-positive income is undefined and the conventional catastrophic threshold assumes a positive resource base.
Variables
Dental coverage was defined as reporting dental insurance at any time during 2023, based on a value of yes on any of the three round-specific dental insurance indicators in the consolidated file (DENTIN31_M23, DENTIN42_M23 and DENTIN53_M23). These indicators derive from the household-reported question about insurance that pays for dental visits, asked for each round of the survey. Adults whose available indicators were all equal to no were classified as without dental coverage. This person-level indicator captures whether an adult held dental insurance at some point during the year, regardless of the source or the generosity of the benefit, and it includes both private and public dental benefits.
Any dental visit was defined as at least one reported dental care visit during 2023 (DVTOT23 greater than zero). Out-of-pocket dental spending was the self/family payment amount for dental care (DVTSLF23), and total dental expenditure was the payment from all sources combined (DVTEXP23), both expressed in US dollars and recorded for the calendar year. Annual family income (FAMINC23) provided the denominator for burden measures. Catastrophic dental spending was defined as out-of-pocket dental spending equal to or greater than 10% of annual family income, restricted to persons in families with positive income. The 10% threshold follows the widely used operationalization of the Sustainable Development Goal indicator of financial protection. Sensitivity analyses used thresholds of 5% and 20%, and the proportion of family income devoted to out-of-pocket dental spending was computed as a continuous burden measure.
Covariates were age group (18-34, 35-44, 45-64 and 65 years or older), sex, race and ethnicity (Hispanic, non-Hispanic White, non-Hispanic Black, non-Hispanic Asian, other or multiple race), family income as a percentage of the poverty line (poor or negative, near poor, low, middle and high), educational attainment (high school or less, some college or more) and general health insurance coverage (any private, public only, uninsured). These variables were selected as potential confounders of the association between dental coverage and spending outcomes, because they jointly determine access to employer-sponsored benefits, the demand for dental care and the capacity to pay. Special negative codes in the source files, including inapplicable, refused, do not know, not ascertained and cannot be computed, were treated as missing.
Statistical analysis
All estimates accounted for the complex survey design using the person weight (PERWT23F), the variance estimation stratum (VARSTR) and the primary sampling unit (VARPSU), with standard errors obtained by Taylor series linearization. Weighted percentages and means are reported with 95% confidence intervals. Because out-of-pocket dental spending is right-skewed, medians with interquartile ranges are presented alongside means, and the magnitude model used a logarithmic transformation. Weighted quantiles were computed from the person weights.
Associations between dental coverage and the three outcomes were estimated with survey-weighted logistic regression for any dental visit and for catastrophic dental spending, and with a survey-weighted log-linear model for out-of-pocket spending among adults with a visit. The two-step structure separates the decision to seek care from the amount paid conditional on seeking care, which avoids conflating utilization with intensity. Results are reported as odds ratios and as a geometric mean ratio with 95% confidence intervals. Models were adjusted for age group, sex, race and ethnicity, poverty category, education and general insurance coverage, with unadjusted estimates computed for comparison. Design-based coefficient variance was estimated with the sandwich linearization of the pseudo-likelihood, which propagates the stratified clustered sampling into the regression standard errors. The significance level was 0.05, and no correction for multiplicity was applied because the outcomes represent distinct constructs within a single prespecified framework.
A supplementary analysis used the dental visits file (HC-248B) merged with person-level coverage to estimate the mean out-of-pocket payment per dental visit and the share of visits with any out-of-pocket payment, treating each visit as an observation that inherits the person weight and design identifiers. Missing data were handled by complete-case analysis within each estimate: the small number of adults with missing dental coverage was excluded from coverage-stratified analyses, and persons with non-positive family income were excluded only from the ratio-based catastrophic and burden measures, with the exclusion count reported. The primary catastrophic threshold of 10% was prespecified, and the 5% and 20% thresholds were examined to test the sensitivity of conclusions to the definition. All data management and analyses were performed in Python 3.14 with pandas, NumPy, SciPy and statsmodels, and the fixed-width data were parsed from the official SAS programming statements. The analysis script is deterministic and reproduces identical results on repeated execution, which was verified by running the script twice and confirming an unchanged metric file.
Ethical aspects
The study used de-identified public-use survey data, and no ethical approval or informed consent was required.
RESULTS
Dental coverage and utilization
The sample of 14,768 adults represented 259.7 million adults. Dental coverage was held by 52.1% (95% CI 50.4-53.8) of adults. Coverage was most common among adults aged 35-64 years, non-Hispanic White adults and adults with high income, and least common among adults aged 65 years or older, who constituted 11.5% of covered adults but 35.6% of adults without coverage (Table 1). The covered and uncovered groups differed most on economic characteristics. High-income adults represented 62.1% of the covered group and 30.1% of the uncovered group, adults with any private medical coverage represented 97.7% and 31.8%, and adults with public-only medical coverage represented 1.5% and 53.9% (Table 1). Educational attainment followed the same direction: adults with high school or less made up 42.0% of the covered group and 65.6% of the uncovered group. The sex distribution was nearly identical across groups, whereas Hispanic adults were overrepresented among the uncovered (22.5% versus 13.7%), and adults in the South constituted the largest regional group in both columns (Table 1). Coverage also varied with age in opposite directions at the extremes: adults aged 18-34 years made up 31.2% of the covered group and 25.8% of the uncovered group, whereas adults aged 65 years or older showed the reverse pattern (11.5% versus 35.6%) (Table 1).
Any dental visit was reported by 44.0% of adults overall. Utilization differed markedly by coverage: 53.2% of adults with dental coverage reported a visit compared with 34.0% of adults without coverage (Table 2). The unadjusted odds ratio for a dental visit was 2.18 (95% CI 2.00-2.37), and after adjustment for age group, sex, race and ethnicity, poverty category, education and general insurance coverage, dental coverage remained associated with a dental visit (odds ratio 1.68, 95% CI 1.47-1.93) (Table 3).
Out-of-pocket dental expenditures
Mean out-of-pocket dental spending among all adults was $213 (95% CI $193-233). The overall mean was similar between adults with coverage ($220) and those without ($206), because higher utilization among covered adults offset their lower spending per user (Table 2). Among adults with any dental visit, mean out-of-pocket spending was $485, and it was $413 with coverage versus $606 without coverage. The median among users was $64 overall, $50 with coverage and $110 without coverage, and the interquartile range for all users was $0 to $325 dollars (Figure 1). The proportion of users with any out-of-pocket payment was similar between groups (64.7% with coverage versus 64.4% without), while the amounts paid differed (Table 2). The median payment followed the same pattern: half of covered users paid $50 or less, whereas half of uncovered users paid $110 or less. In the adjusted log-linear model, covered users spent 0.77 times as much as uncovered users (95% CI 0.68-0.88), a 23% lower geometric mean; the unadjusted ratio was 0.61 (95% CI 0.55-0.69) (Table 3). Mean total dental expenditure among users was $1,036 overall, $1,003 with coverage and $1,094 without coverage, whereas the out-of-pocket component was lower among covered users (Table 2). Out-of-pocket spending absorbed 0.45% of family income overall, with little difference by coverage (Table 2). At the visit level, mean out-of-pocket payment was $218 per visit, $188 with coverage and $267 without coverage, and about half of all visits generated any out-of-pocket payment regardless of coverage (Table 2).
Catastrophic dental spending
Catastrophic dental spending at the 10% threshold affected 0.6% of adults in families with positive income. Prevalence was 0.4% among adults with dental coverage and 0.7% among adults without coverage (Table 4). At the 5% threshold, prevalence was 1.3% overall (0.9% with coverage versus 1.8% without), and at the 20% threshold it was 0.2% overall (0.1% versus 0.4%). At every threshold the unadjusted prevalence among adults without coverage was roughly double that among covered adults, although the absolute difference between groups was small. Catastrophic spending declined steeply and monotonically across poverty categories, from 2.0% among poor or negative adults and 2.5% among near-poor adults to 0.4% among middle-income and 0.1% among high-income adults (Table 5; Figure 2). Within poverty categories the gap between coverage groups was inconsistent and, for the near-poor stratum, the estimate for covered adults carried a wide confidence interval (Table 5). The estimates were restricted to adults with positive family income, who made up the large majority of the analytic sample, and the primary 10% threshold estimate remained below one adult in a hundred across coverage groups.
Adjusted associations and the coverage-to-burden framework
In the unadjusted model, dental coverage was associated with lower odds of catastrophic spending at the 10% threshold (odds ratio 0.58, 95% CI 0.37-0.93). After adjustment for age, sex, race and ethnicity, poverty category, education and general insurance coverage, the odds ratio was 1.21 (95% CI 0.64-2.27), with a confidence interval that included 1 (Table 3). At the 20% threshold the adjusted association was 0.57 (95% CI 0.23-1.40), compared with the unadjusted estimate of 0.29. Figure 1 integrates these components into an empirical pathway in which coverage raises utilization and lowers out-of-pocket spending per user, whereas catastrophic burden is governed by family income rather than by coverage itself (Figure 3).
Characteristic | All adults | Dental coverage | No dental coverage |
|---|---|---|---|
18-34 years | 28.6 (0.5) | 31.2 (0.8) | 25.8 (0.8) |
35-44 years | 17.0 (0.5) | 20.8 (0.7) | 12.8 (0.6) |
45-64 years | 31.4 (0.5) | 36.5 (0.7) | 25.7 (0.6) |
65 years or older | 23.1 (0.5) | 11.5 (0.5) | 35.6 (0.9) |
Male | 48.7 (0.4) | 49.5 (0.5) | 47.8 (0.6) |
Female | 51.3 (0.4) | 50.5 (0.5) | 52.2 (0.6) |
Hispanic | 17.9 (1.2) | 13.7 (0.9) | 22.5 (1.7) |
Non-Hispanic White | 60.2 (1.2) | 63.3 (1.2) | 56.9 (1.6) |
Non-Hispanic Black | 12.1 (0.7) | 11.9 (0.8) | 12.4 (0.9) |
Non-Hispanic Asian | 6.6 (0.6) | 7.7 (0.7) | 5.4 (0.6) |
Other or multiple race | 3.1 (0.2) | 3.5 (0.3) | 2.8 (0.3) |
Poor or negative | 9.9 (0.4) | 3.2 (0.3) | 17.1 (0.7) |
Near poor | 3.3 (0.2) | 1.3 (0.2) | 5.6 (0.4) |
Low income | 11.3 (0.5) | 6.3 (0.4) | 16.7 (0.7) |
Middle income | 28.7 (0.7) | 27.1 (1.0) | 30.5 (0.9) |
High income | 46.8 (1.0) | 62.1 (1.1) | 30.1 (1.1) |
High school or less | 53.3 (0.9) | 42.0 (1.0) | 65.6 (0.9) |
Some college or more | 46.7 (0.9) | 58.0 (1.0) | 34.4 (0.9) |
Any private | 66.1 (0.8) | 97.7 (0.2) | 31.8 (0.9) |
Public only | 26.6 (0.7) | 1.5 (0.2) | 53.9 (1.0) |
Uninsured | 7.3 (0.5) | 0.8 (0.1) | 14.3 (0.8) |
Northeast | 17.2 (0.8) | 18.3 (1.0) | 16.0 (1.0) |
Midwest | 20.4 (0.8) | 21.5 (1.1) | 19.2 (0.8) |
South | 38.7 (1.2) | 36.7 (1.5) | 41.0 (1.5) |
West | 23.7 (1.3) | 23.5 (1.7) | 23.8 (1.3) |
Note: Values are weighted percentages with standard error in parentheses. Source: Elaboration from AHRQ Medical Expenditure Panel Survey, 2023 Full Year Consolidated Data File (HC-251).
Measure | All adults | Dental coverage | No dental coverage |
|---|---|---|---|
Any dental visit, % | 44.0 (0.8) | 53.2 (0.9) | 34.0 (0.9) |
Out-of-pocket dental spending among all adults, USD | 213 (10) | 220 (13) | 206 (15) |
Mean out-of-pocket dental spending among users, USD | 485 (21) | 413 (23) | 606 (43) |
Median out-of-pocket dental spending among users, USD (IQR) | 64 (0-325) | 50 (0-276) | 110 (0-400) |
Users with any out-of-pocket payment, % | 64.6 (1.0) | 64.7 (1.2) | 64.4 (1.3) |
Mean total dental expenditure among users, USD | 1,036 (30) | 1,003 (31) | 1,094 (58) |
Out-of-pocket dental spending as share of family income, % | 0.4 (0.1) | 0.4 (0.1) | 0.5 (0.1) |
Mean out-of-pocket per dental visit, USD | 218 (9) | 188 (10) | 267 (17) |
Dental visits with any out-of-pocket payment, % | 50.5 (0.9) | 49.9 (1.0) | 51.7 (1.3) |
Note: USD = US dollars; IQR = interquartile range. Values are weighted estimates; means are shown with standard error in parentheses, medians with interquartile range. Source: Elaboration from AHRQ Medical Expenditure Panel Survey, 2023 Full Year Consolidated Data File (HC-251) and 2023 Dental Visits File (HC-248B).
Group | ≥5% of family income | ≥10% of family income | ≥20% of family income |
|---|---|---|---|
All adults | 1.3 (0.1) | 0.6 (0.1) | 0.2 (0.0) |
Dental coverage | 0.9 (0.2) | 0.4 (0.1) | 0.1 (0.0) |
No dental coverage | 1.8 (0.2) | 0.7 (0.1) | 0.4 (0.1) |
Note: Catastrophic spending is defined as out-of-pocket dental spending equal to or above the indicated share of annual family income, among adults in families with positive income. Values are weighted percentages with standard error in parentheses. Source: Elaboration from AHRQ Medical Expenditure Panel Survey, 2023 Full Year Consolidated Data File (HC-251).
Outcome | Measure | Unadjusted (95% CI) | Adjusted (95% CI) | Adjusted p |
|---|---|---|---|---|
Any dental visit | Odds ratio | 2.18 (2.00-2.37) | 1.68 (1.47-1.93) | 0.000 |
Catastrophic dental spending (≥10% of family income) | Odds ratio | 0.58 (0.37-0.93) | 1.21 (0.64-2.27) | 0.557 |
Catastrophic dental spending (≥20% of family income) | Odds ratio | 0.29 (0.14-0.57) | 0.57 (0.23-1.40) | 0.219 |
Out-of-pocket dental spending among users | Geometric mean ratio | 0.61 (0.55-0.69) | 0.77 (0.68-0.88) | 0.000 |
Note: Adjusted models include age group, sex, race and ethnicity, poverty category, education and general health insurance coverage. CI = confidence interval. Source: Elaboration from AHRQ Medical Expenditure Panel Survey, 2023 Full Year Consolidated Data File (HC-251).
Poverty category | All adults | Dental coverage | No dental coverage |
|---|---|---|---|
Poor or negative | 2.0 (0.4) | 2.2 (1.0) | 2.0 (0.5) |
Near poor | 2.5 (1.0) | 6.9 (3.4) | 1.4 (0.7) |
Low income | 1.1 (0.3) | 1.8 (0.9) | 0.9 (0.2) |
Middle income | 0.4 (0.1) | 0.3 (0.1) | 0.5 (0.1) |
High income | 0.1 (0.0) | 0.1 (0.0) | 0.2 (0.1) |
Note: Values are weighted percentages with standard error in parentheses, among adults in families with positive income. Source: Elaboration from AHRQ Medical Expenditure Panel Survey, 2023 Full Year Consolidated Data File (HC-251).

Figure 3. Empirical framework of the pathway from dental coverage to financial burden among US adults, 2023.
Note: OR = odds ratio. Estimates shown are weighted; the out-of-pocket values are means among adults with a dental visit. Source: Elaboration from AHRQ Medical Expenditure Panel Survey, 2023 Full Year Consolidated Data File (HC-251).
Figure 1. Distribution of out-of-pocket dental spending among US adults with a dental visit, by dental coverage status, 2023.
Note: Boxes show the interquartile range with the median; whiskers extend to 1.5 times the interquartile range. The vertical axis is logarithmic. Source: Elaboration from AHRQ Medical Expenditure Panel Survey, 2023 Full Year Consolidated Data File (HC-251).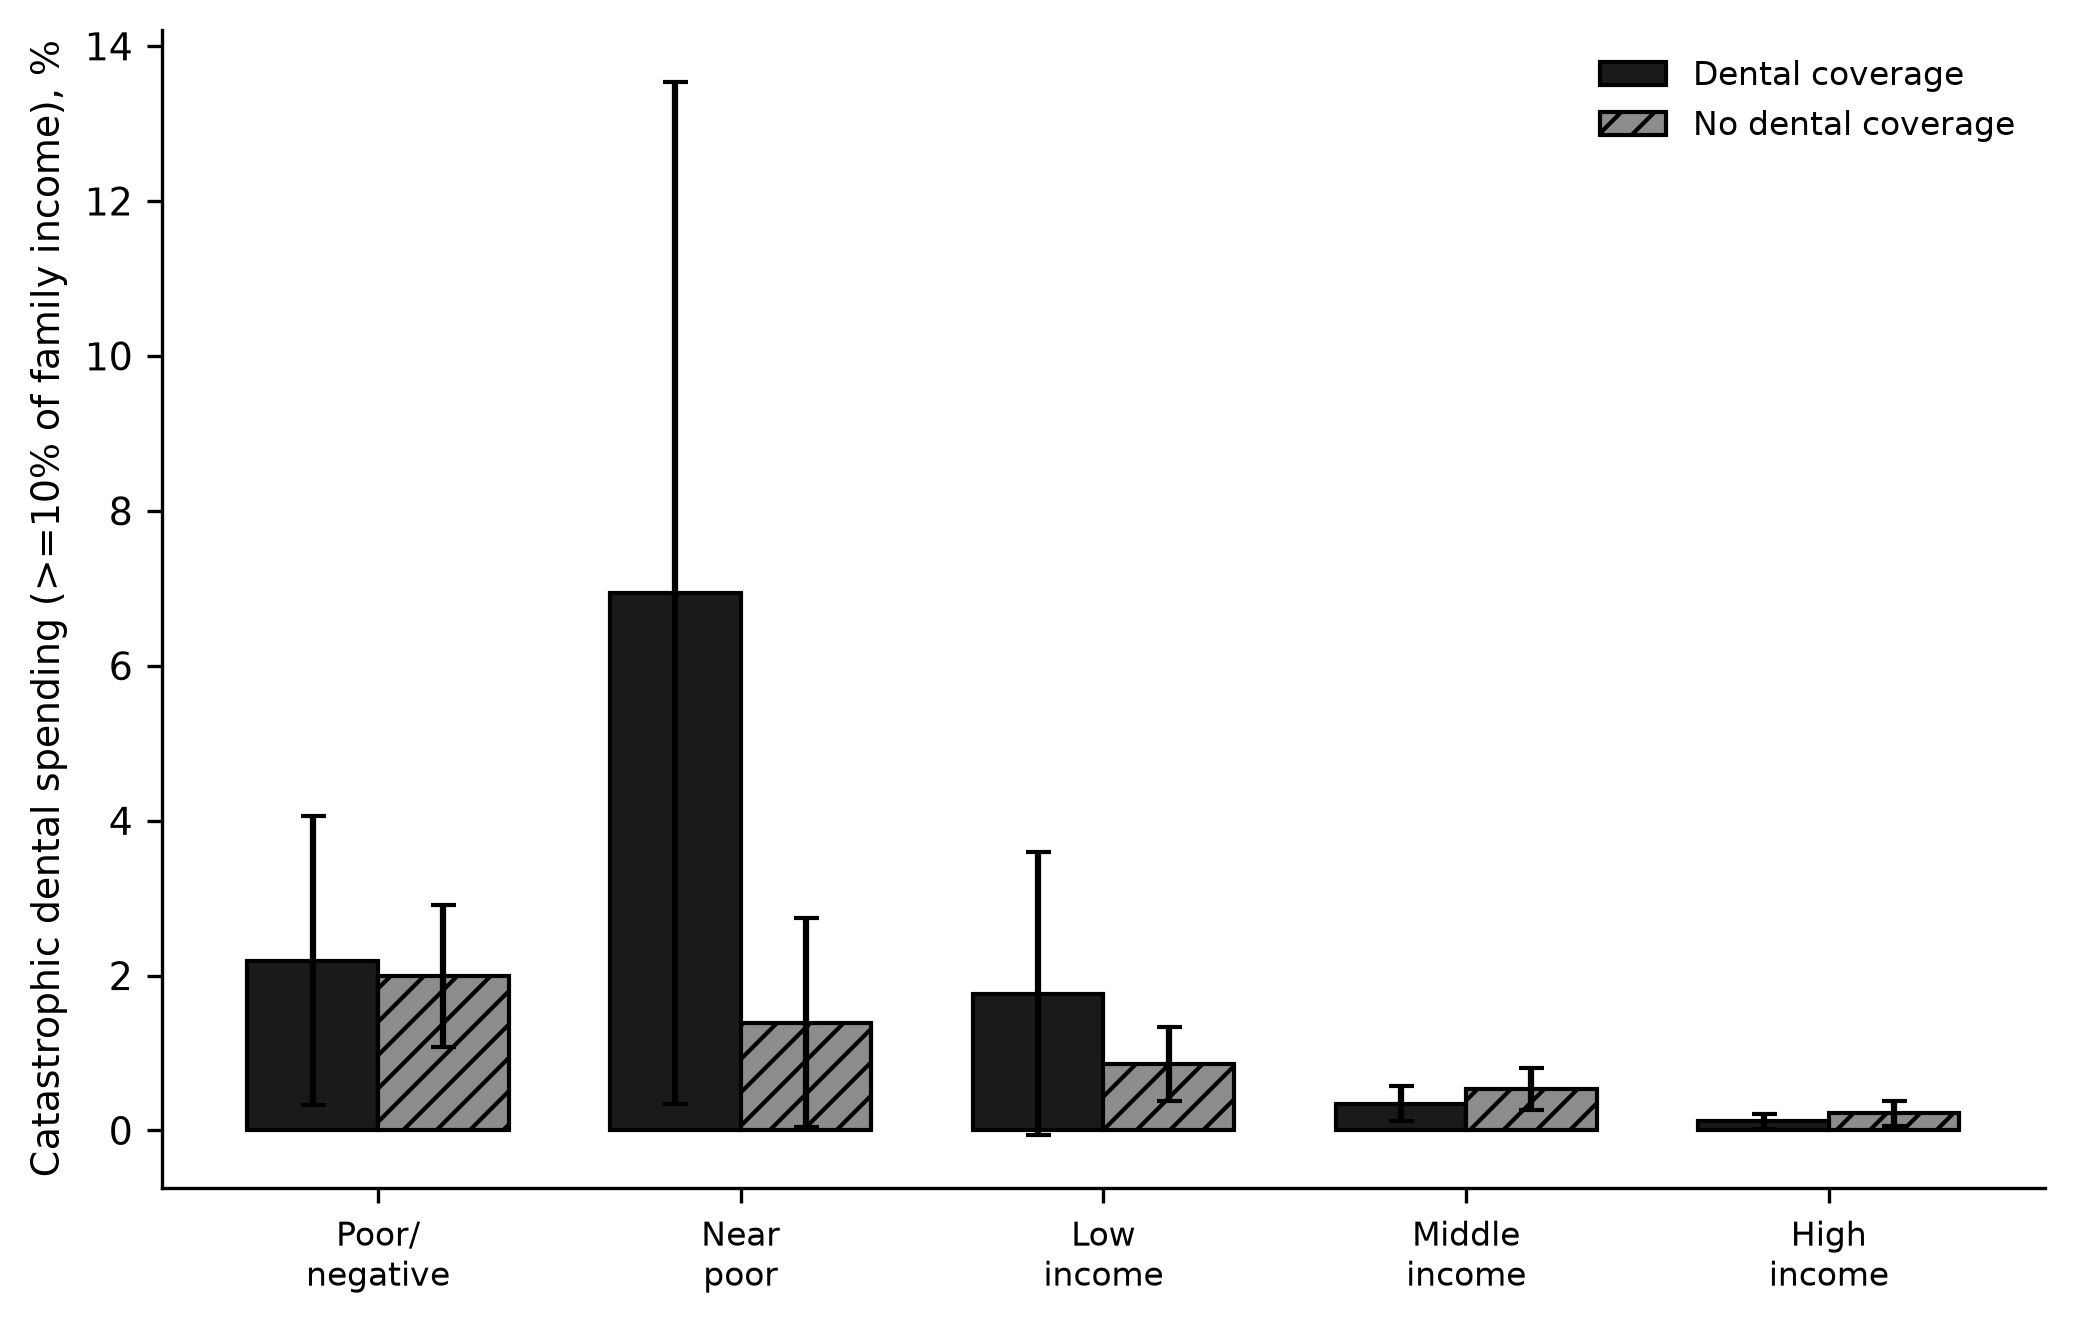
Figure 2. Prevalence of catastrophic dental spending of at least 10% of family income by poverty category and dental coverage status, 2023.
Note: Error bars show 95% confidence intervals. Estimates are restricted to adults in families with positive income. Source: Elaboration from AHRQ Medical Expenditure Panel Survey, 2023 Full Year Consolidated Data File (HC-251).DISCUSSION
The principal finding is that dental coverage increases utilization and lowers the amount that users pay out of pocket, but it does not independently reduce catastrophic dental spending once income is taken into account. Coverage and income therefore operate at different points of the burden pathway: coverage shapes whether adults seek care and how much they pay per visit, while family income determines whether that spending crosses a catastrophic threshold.
Coverage prevalence in this sample, about half of adults, is consistent with recent descriptions of the fragmented US dental financing system, in which benefits track private employment and shrink at retirement.(5,6) The observation that dental coverage reaches only a minority of older adults, and that coverage among Medicare Advantage enrollees depends on benefit design, matches studies of the Medicare population.(7,8) The utilization gap between covered and uncovered adults also reproduces a long-standing pattern observed in Canada, Australia and the United States, where insurance and income jointly predict whether adults obtain dental care.(25-27) The concentration of coverage among high-income and privately insured adults means that the adults most exposed to out-of-pocket dental costs are also the least able to absorb them, a welfare loss that has been quantified for racial and ethnic disparities in dental access in the United States.(28)
The lower out-of-pocket spending among covered users is the expected mechanical effect of insurance and matches evidence from the expansion of dental benefits in Korea, which reduced out-of-pocket payments among older adults.(29) It also aligns with a recent US analysis that framed dental insurance as a paradox: coverage increases use but can still leave substantial residual cost to the patient.(30) Absolute spending levels in this study are comparable to earlier MEPS-based series, which placed mean dental expenditure per user in the same range as the values reported here.(11,22) The finding that covered and uncovered adults have similar average spending in the whole population, despite opposite utilization patterns, illustrates that the population-level financial consequence of coverage depends on both the price and the quantity of care. Disparities in out-of-pocket dental spending within countries have likewise been linked to socioeconomic position rather than to coverage alone, as reported for Israel and China.(31,32)
Catastrophic dental spending was rare in this nationally representative US sample, far below the prevalence reported for dental care in Iran, China, Saudi Arabia and other low- and middle-income settings.(16,17,33,34) The comparison is expected: catastrophic measures are denominated by household income, and US incomes are high relative to the typical out-of-pocket dental bill. The estimates are closer to the Spanish experience, where dental care still generated catastrophic expenditure despite universal medical coverage,(18) and to the financial burden reported by older adults in several Central and Eastern European countries.(19) The reversal of the coverage association after adjustment is the key analytical result. Unadjusted estimates suggested protection because covered adults are disproportionately high-income; once poverty category and other covariates are controlled, coverage no longer predicted catastrophic spending. This pattern echoes systematic reviews showing that socioeconomic status, not insurance status alone, is the dominant determinant of catastrophic health expenditure,(35) and it parallels evidence that financial burden concentrates among lower-income beneficiaries even when insurance is present.(23,36) Special populations with constrained finances, such as formerly incarcerated older adults and patients with head and neck cancer, face dental expenditure burdens that coverage alone does not resolve.(37,38)
The mechanisms follow from the definitions. Insurance lowers the effective price of a dental visit and raises demand, which increases utilization and reduces the per-visit payment. Catastrophic spending, by contrast, is a ratio of out-of-pocket payment to family income, so it is mechanically dominated by the denominator.(13,14) For most adults with positive income, even a substantial dental bill stays below 10% of annual family income, which is why catastrophic dental spending is rare and why poverty, rather than coverage, orders its distribution. Methodological choices amplify this interpretation: estimates vary with the threshold, the recall period and the income measure, and results at the 5%, 10% and 20% thresholds moved in the expected direction.(20,21) The absence of an independent coverage effect on catastrophic spending should therefore be read as a property of the ratio definition, not as evidence that coverage provides no financial relief.
Catastrophic spending is rare by construction, whereas high financial burden is far more common. A dental bill that equals a small share of income can still force an adult to forgo other necessities, borrow or defer care, and the scoping reviews of oral health care costs describe exactly this broader spectrum of hardship.(12,39) In this sample, one in three adults who used dental care reported no out-of-pocket payment, but the remainder paid amounts that, while rarely catastrophic, were concentrated among lower-income users. Deferred dental care and medical debt attributed to dental needs are reported by a sizable minority of US adults and reinforce that the absence of catastrophic spending is not the same as the absence of burden.(28,40) This distinction is central to the framework in Figure 1: coverage acts on the amount paid per visit, whereas the welfare consequence of that payment depends on the payer's income.
The low prevalence of catastrophic dental spending in this sample contrasts with the substantial medical out-of-pocket burden documented in US populations, where high out-of-pocket spending among the poor and elderly and financial hardship among seriously ill patients are well established.(23,36) The difference reflects both the smaller absolute size of dental bills and the fact that adults without dental coverage often simply forgo care rather than incur large expenses, a substitution that converts potential financial burden into unmet need. This substitution is consistent with the observation that dental care is the health service most frequently skipped because of cost,(1) and with the welfare losses estimated for inequitable dental access in the United States.(28)
The strengths of this study include a current, nationally representative source, the explicit use of the survey design for all estimates, a reproducible analysis pipeline verified by repeated execution, and the combination of person-level and visit-level files to describe both the amount and the distribution of out-of-pocket spending. Restricting the sample to adults aged 18 years and older focuses the analysis on the population for whom dental coverage is most fragmented, and the prespecified thresholds make the burden estimates directly comparable with the financial protection literature. The study also contributes a conceptualization of the coverage-to-burden pathway that separates utilization, payment per visit and catastrophic burden, three quantities that are frequently conflated in policy discussion.
The results also speak to the comparative structure of dental financing. Jurisdictions that integrate dental care into their public coverage, or that explicitly cover the mouths of older adults, achieve more uniform access than the fragmented US system, where dental benefits are an optional rider rather than a core entitlement.(6) The Korean experience is instructive for the United States because it shows that expanding public dental benefits to older adults reduced out-of-pocket spending without eliminating it, a pattern that mirrors the residual payments observed among covered adults in this sample.(29) The US debate, which centers on whether to add a dental benefit to Medicare and whether adult dental care should be an essential health benefit, is therefore less about whether coverage lowers the price of care and more about whether the resulting reduction reaches the adults whose income places them at risk of catastrophic burden.(2,5)
These findings also bear on benefit design. The lower geometric mean among covered users shows that even incomplete dental benefits reduce out-of-pocket exposure, but the persistence of mean payments above $400 among covered users points to the role of deductibles, coinsurance and annual maximums in leaving a residual burden. Plans that cap annual benefits or apply high coinsurance to major restorative work shift cost back onto patients precisely for the most expensive episodes, a design feature that has been documented in the United States.(30) Future research could therefore estimate the financial protection provided by specific benefit features rather than by coverage status alone, using plan-level data on maximums and cost sharing, and could test whether value-based designs that reduce cost sharing for preventive care alter the distribution of out-of-pocket spending. Longitudinal designs that follow adults through retirement and Medicare eligibility would also clarify how much of the coverage gap among older adults reflects benefit loss rather than lower demand.(5,8)
The policy implications follow. Because coverage lowers out-of-pocket spending per user and raises utilization, expanding dental benefits to the roughly half of adults without them would likely increase treatment and reduce the cost of each visit, and proposals to add a Medicare dental benefit or to include adult dental care in essential health benefits address a real gap.(2,7) Because catastrophic burden is income-driven, coverage expansion alone will not eliminate financial hardship; it needs to be paired with income-related cost-sharing protection for lower-income adults, such as reduced or eliminated cost sharing for the poorest beneficiaries. This interpretation agrees with the broader literature on financial burden and deferred dental care in the United States.(12,39,40)
Study limitations
The design is cross-sectional, so the associations cannot be interpreted causally; future work should exploit longitudinal panels or quasi-experimental variation such as Medicaid and Medicare Advantage dental benefit changes to estimate causal effects.(7,41)
Catastrophic spending was measured against family income rather than household consumption or capacity to pay, which can misclassify burden for adults whose income understates their resources; a capacity-to-pay definition should be tested in future analyses, and income was reported before the subtraction of medical spending, so the denominator may overstate resources for households with large medical bills.
Dental coverage was self-reported and captured as any coverage during the year, so benefit generosity, waiting periods and annual maximums were not observed; administrative benefit data would sharpen the exposure and allow dose-response analyses.
Some subgroup estimates, particularly among near-poor adults with coverage, rested on small cell sizes and wide confidence intervals and should be read with caution; pooling adjacent survey years would stabilize these cells.
The analysis used a single survey year, so secular trends and the effect of the COVID-19 pandemic on dental use could not be examined; pooled multi-year files would strengthen precision and allow trend analysis.(11)
The results generalize to the civilian noninstitutionalized population and not to institutionalized adults or children, whose dental financing differs substantially.
CONCLUSIONS
This study quantified out-of-pocket dental expenditures and catastrophic dental spending among US adults according to dental coverage status in a nationally representative sample. Dental coverage was held by about half of adults and was associated with higher utilization and, among users, with substantially lower out-of-pocket spending. Catastrophic dental spending was rare, and its prevalence was ordered by family income rather than by coverage; the protective association observed before adjustment disappeared once sociodemographic factors were controlled. The empirical framework that emerges separates three components of the coverage-to-burden pathway: coverage drives utilization, it lowers the amount paid per visit, and income determines whether that payment becomes catastrophic. Policies that seek to relieve the financial burden of dental care should therefore combine coverage expansion with income-based cost-sharing protection for lower-income adults, since coverage alone is unlikely to eliminate the catastrophic burden concentrated among the poor.
References
- 1 Vujicic M, Buchmueller T, Klein R. Dental Care Presents The Highest Level Of Financial Barriers, Compared To Other Types Of Health Care Services. Health Affairs. 2016;35(12):2176-2182. doi: 10.1377/hlthaff.2016.0800
- 2 Vujicic M, Fosse C. Time for Dental Care to Be Considered Essential in US Health Care Policy. AMA Journal of Ethics. 2022;24(1):E57-63. doi: 10.1001/amajethics.2022.57
- 3 Vujicic M. Our dental care system is stuck. The Journal of the American Dental Association. 2018;149(3):167-169. doi: 10.1016/j.adaj.2018.01.006
- 4 Velez M, Buto PT, Pederson AM, Weuve J, Murchland AR, Wang J, et al. Associations of unmet dental care needs due to cost with incident cardiovascular disease and dementia: a prospective study in the All of Us cohort. J Gerontol A Biol Sci Med Sci. 2026;81(4):glag023. doi: 10.1093/gerona/glag023
- 5 Elani HW, Sommers BD, Yuan D, Kawachi I, Rosenthal MB, Tipirneni R. Dental Coverage and Care When Transitioning From Medicaid to Medicare. JAMA Health Forum. 2024;5(11):e244165. doi: 10.1001/jamahealthforum.2024.4165
- 6 Allin S, Farmer J, Quiñonez C, Peckham A, Marchildon G, Panteli D, et al. Do health systems cover the mouth? Comparing dental care coverage for older adults in eight jurisdictions. Health Policy. 2020;124(9):998-1007. doi: 10.1016/j.healthpol.2020.06.015
- 7 Nasseh K, Singhal A, Vujicic M, Simon L. Benefit Design and Access to Dental Care Among Seniors With Medicare Advantage Dental Benefits. JAMA Health Forum. 2025;6(1):e245123. doi: 10.1001/jamahealthforum.2024.5123
- 8 Luo H, Sanfratello NR, Basu R, Mejia G, Moss ME. Dental Coverage and Dental Care Utilization Among Medicare Advantage Beneficiaries With and Without Diabetes United States. J Aging Health. 2026:08982643261486557. doi: 10.1177/08982643261486557
- 9 Zhou X, He G, Lan Z, Ren Z, Qiu Y. Associations of social determinants of health with oral pain in U.S. adults: A cross-sectional study on the mediating role of cost-related barriers to dental care. Science Progress. 2026;109(3):00368504261491793. doi: 10.1177/00368504261491793
- 10 Alkhabbaz S, Altoorah D, Al-Kandari A, Al-Dara’an H, Al-Mutairi M, AlSulimmani W, et al. Dental treatment affordability and oral outcomes among U.S. adults: NHANES 2015–2018. BMC Oral Health. 2025;25(1):1304. doi: 10.1186/s12903-025-06685-w
- 11 Hung M, Lipsky MS, Moffat R, Lauren E, Hon ES, Park J, et al. Health and dental care expenditures in the United States from 1996 to 2016. PLoS ONE. 2020;15(6):e0234459. doi: 10.1371/journal.pone.0234459
- 12 Proaño D, Huang H, Allin S, Essue BM, Singhal S, Quiñonez C. Oral Health Care Out-of-Pocket Costs and Financial Hardship: A Scoping Review. J Dent Res. 2024;103(12):1197-1208. doi: 10.1177/00220345241253191
- 13 Xu K, Evans DB, Kawabata K, Zeramdini R, Klavus J, Murray CJ. Household catastrophic health expenditure: a multicountry analysis. The Lancet. 2003;362(9378):111-117. doi: 10.1016/s0140-6736(03)13861-5
- 14 van Doorslaer E, O'Donnell O, Rannan‐Eliya RP, Somanathan A, Adhikari SR, Garg CC, et al. Catastrophic payments for health care in Asia. Health Economics. 2007;16(11):1159-1184. doi: 10.1002/hec.1209
- 15 Bernabé E, Masood M, Vujicic M. The impact of out-of-pocket payments for dental care on household finances in low and middle income countries. BMC Public Health. 2017;17(1):109. doi: 10.1186/s12889-017-4042-0
- 16 Woldemichael A, Rezaei S, Kazemi Karyani A, Ebrahimi M, Soltani S, Aghaei A. The impact of out-of pocket payments of households for dental healthcare services on catastrophic healthcare expenditure in Iran. BMC Public Health. 2021;21(1):1474. doi: 10.1186/s12889-021-11209-6
- 17 Sun X, Bernabé E, Liu X, Gallagher JE, Zheng S. Determinants of Catastrophic Dental Health Expenditure in China. PLoS ONE. 2016;11(12):e0168341. doi: 10.1371/journal.pone.0168341
- 18 López-López S, del Pozo-Rubio R, Ortega-Ortega M, Escribano-Sotos F. Catastrophic household expenditure associated with out-of-pocket payments for dental healthcare in Spain. Eur J Health Econ. 2022;23(7):1187-1201. doi: 10.1007/s10198-021-01420-y
- 19 Vojvodic K, Terzic-Supic Z, Todorovic J, Gagliardi C, Santric-Milicevic M, Popovic M. Financial Burden of Medical Care, Dental Care, and Medicines among Older-Aged Population in Slovenia, Serbia, and Croatia. IJERPH. 2022;19(6):3325. doi: 10.3390/ijerph19063325
- 20 Lu C. Limitations of methods for measuring out-of-pocket and catastrophic private health expenditures. Bull World Health Org. 2009;87(3):238-244. doi: 10.2471/blt.08.054379
- 21 Raban MZ, Dandona R, Dandona L. Variations in catastrophic health expenditure estimates from household surveys in India. Bull World Health Organ. 2013;91(10):726-735. doi: 10.2471/blt.12.113100
- 22 Meyerhoefer CD, Zuvekas SH, Manski R. THE DEMAND FOR PREVENTIVE AND RESTORATIVE DENTAL SERVICES. Health Economics. 2014;23(1):14-32. doi: 10.1002/hec.2899
- 23 Narang AK, Nicholas LH. Out-of-Pocket Spending and Financial Burden Among Medicare Beneficiaries With Cancer. JAMA Oncol. 2017;3(6):757. doi: 10.1001/jamaoncol.2016.4865
- 24 Agency for Healthcare Research and Quality. Medical Expenditure Panel Survey Household Component: 2023 Full Year Consolidated Data File (HC-251) and 2023 Dental Visits File (HC-248B) [Internet]. 2025. Available from: https://meps.ahrq.gov/mepsweb/data_stats/download_data_files.jsp
- 25 Locker D, Maggirias J, Quiñonez C. Income, dental insurance coverage, and financial barriers to dental care among Canadian adults. Journal of Public Health Dentistry. 2011;71(4):327-334. doi: 10.1111/j.1752-7325.2011.00277.x
- 26 Lutfiyya MN, Gross AJ, Soffe B, Lipsky MS. Dental care utilization: examining the associations between health services deficits and not having a dental visit in past 12 months. BMC Public Health. 2019;19(1):265. doi: 10.1186/s12889-019-6590-y
- 27 Wei L, Griffin SO, Parker M, Thornton-Evans G. Dental health status, use, and insurance coverage among adults with chronic conditions. The Journal of the American Dental Association. 2022;153(6):563-571.e2. doi: 10.1016/j.adaj.2021.12.012
- 28 Guo C, Rizzo JA. The Economic Toll of Inequitable Dental Care Access: A Welfare Analysis of Racial and Ethnic Disparities. Health Services Research. 2026;61(4):e70155. doi: 10.1111/1475-6773.70155
- 29 Kim NH, Jung SH, Kawachi I. Did Expanded Dental Insurance Reduce Out-of-Pocket Expenditures on Dental Care among Older Adults in Korea? Interrupted Time-Series Analysis. IJERPH. 2021;18(6):3003. doi: 10.3390/ijerph18063003
- 30 Loux T, Bafegeeh F, Liu E, Raybon N. Examining the Financial Paradox of Dental Insurance: Higher Out‐of‐Pocket Costs for Individuals Without Private Health Insurance?. J Public Health Dent. 2025;85(4):344-351. doi: 10.1111/jphd.12681
- 31 Orenstein L, Chetrit A, Oberman B, Benderly M, Kalter-Leibovici O. Factors associated with disparities in out-of-pocket expenditure on dental care: results from two cross-sectional national surveys. Isr J Health Policy Res. 2020;9(1):30. doi: 10.1186/s13584-020-00387-0
- 32 Cheng ML, Wang CX, Wang X, Feng XP, Tai BJ, De Hu Y, et al. Dental expenditure, progressivity and horizontal inequality in Chinese adults: based on the 4th National Oral Health Epidemiology Survey. BMC Oral Health. 2020;20(1):137. doi: 10.1186/s12903-020-01128-0
- 33 AlBaty A, AlGhasham H, Al Wusaybie M, El Tantawi M. Dental expenditure and catastrophic dental expenditure in Eastern Saudi Arabia: Pattern and associated factors. J Clin Exp Dent. 2019;11(7):0-0. doi: 10.4317/jced.55820
- 34 Masood M, Sheiham A, Bernabé E. Household Expenditure for Dental Care in Low and Middle Income Countries. PLoS ONE. 2015;10(4):e0123075. doi: 10.1371/journal.pone.0123075
- 35 Community Medicine Department, Faculty of Medicine & Biomedical Sciences, MAHSA University, Saujana Putra Campus, 42610 Jenjarom, Selangor, Malaysia, Azzani M, Roslani AC, University of Malaya Cancer Research Institute (UMCRI), Faculty of Medicine, University of Malaya, 50603 Kuala Lumpur, Malaysia, Department of Surgery, Faculty of Medicine, University of Malaya, 50603 Kuala Lumpur, Malaysia, Su TT, et al. Determinants of Household Catastrophic Health Expenditure: A Systematic Review. MJMS. 2019;26(1):15-43. doi: 10.21315/mjms2019.26.1.3
- 36 Baird K. High Out‐of‐Pocket Medical Spending among the Poor and Elderly in Nine Developed Countries. Health Services Research. 2016;51(4):1467-1488. doi: 10.1111/1475-6773.12444
- 37 Patel M, Mijares L, Testa A, Jackson DB, Ganson KT, Maroufy V, et al. Prior incarceration and out-of-pocket dental care expenditures among older adults in the United States. BMC Oral Health. 2026;26(1):1392. doi: 10.1186/s12903-026-08684-x
- 38 Ben Dor B, Villa A, Hayes C, Alpert E, Shepard DS, Sonis ST. Financial Burden of Dental Care Among Patients With Head and Neck Cancer. JAMA Otolaryngol Head Neck Surg. 2024;150(9):811. doi: 10.1001/jamaoto.2024.2260
- 39 Madhavan K, Sajan SA. Financial Burden in Dental Care: Global Determinants, Policy Interventions and Access Inequities—A Scoping Review. Comm Dent Oral Epid. 2026:cdoe.70104. doi: 10.1111/cdoe.70104
- 40 Moon KJ, Becker NV, Miller KEM, Ettman CK. Medical Debt and Deferred Care for Physical Health, Mental Health, and Dental Needs Among U.S. Adults. J GEN INTERN MED. 2026;41(11):3133-3141. doi: 10.1007/s11606-026-10215-x
- 41 Atanda A, Amedari MI, Agaku IT, Hayman LW, Hossain MB. Medicaid expansion, dental visits and expenditures in veterans, older adults, and the foreign-born. Sci Rep. 2025;15(1):19669. doi: 10.1038/s41598-025-03964-y
Declarations
Funding
No financing
Conflict of interest
None
Authorship contributions
Drafting – original draft: Maria Fernanda Escalante Freitez.
Writing–review and editing: Maria Fernanda Escalante Freitez.