

Abstract
The carbon footprint of dental practice is usually presented either as a negligible per-visit emission or as the large aggregate burden of a high-volume service. This narrative review synthesizes the evidence published between 2018 and 2025 on the size, sources, and reduction strategies of the carbon footprint of dental care. Literature was searched in OpenAlex, Crossref, and PubMed and organized into four thematic axes: measurement of the footprint, materials and single-use consumables, clinical gases and waste, and interventions. Reported estimates range from 4.3 kg CO2e per patient visit and 4.9 kg CO2e per root canal treatment to 31.8 to 35.1 kg CO2e per implant-supported prosthesis, and from 285 to 2,170 kg CO2e per person over a lifetime of oral care. Patient and staff travel consistently dominate practice-level footprints, accounting for 65.2% of clinic emissions in one Egyptian study, while procurement, energy, and single-use plastics dominate the material side. Reusable instruments outperform disposable kits, and removing unnecessary plastics, harvesting rainwater, and teledentistry produce measurable reductions, whereas digital fabrication is not automatically lower-carbon. Nitrous oxide and amalgam remain high-priority targets. The apparent contradiction between a small per-unit footprint and a large aggregate footprint is reconciled by volume, travel, and procurement. Comparability across studies is limited by heterogeneous methods; standardized functional units and routine measurement are needed to move the field from awareness to verified emission reductions.
Keywords
carbon footprint, dentistry, environmental sustainability, dental waste, greenhouse gases, life cycle assessment
INTRODUCTION
Health care is responsible for roughly 5% of global greenhouse gas emissions, a share comparable to that of the food sector and larger than that of aviation.(1-3) A systematic review of health-care settings arrives at the same order of magnitude, between 4% and 5% of global emissions, and attributes them across the three scopes of the Greenhouse Gas Protocol, with the majority in the purchased goods and services that constitute scope 3.(4) Dentistry sits inside this footprint, yet the field cannot agree on how to describe its own contribution. One body of evidence presents dental care as almost negligible at the level of a single appointment: a life cycle analysis of one dental examination concluded that its environmental burden, compared with one person's annual impact, is minimal.(5) A second body of evidence points in the opposite direction, at the scale of a career of care and of an entire profession. Modeled lifetime oral healthcare for a patient with high disease experience was estimated at approximately 2,170 kg CO2e, against 285 kg CO2e for a person with very low disease experience,(6) and the air travel of only four global oral health meetings was estimated at about 47,000 metric tons of CO2e.(7) The same profession is thus described, in published work, both as a trivial emitter and as a material contributor to the climate crisis.
The contradiction matters because it changes what the profession does. If the footprint is trivial per unit, the rational response is to focus on clinical quality and leave emissions alone. If it is large in aggregate, the response is to redesign travel, procurement, and waste, which requires measurement and intervention data that dentistry largely lacks. The framing also has a moral dimension that the profession has begun to articulate: oral health professionals have an ethical responsibility to manage the environmental impact of the care they provide, and the World Dental Federation has tied good-quality oral healthcare explicitly to environmental sustainability.(8) National health systems have committed to net-zero targets that include dentistry, and the National Health Service in England has quantified and tracked its footprint in ways that name dental care as a component to be decarbonized.(9) Overviews directed at clinical teams now list carbon reduction alongside plastics, nitrous oxide, and antibiotics as domains for routine action.(10) The gap is not awareness but quantification: frameworks and toolkits describe what to change, while the evidence on how much each change saves is only beginning to accumulate. Dentists therefore need a defensible account of where the emissions of their practices come from and which changes actually reduce them, rather than a list of aspirational principles.
A review is timely because the measurement literature has grown rapidly and remains scattered. Most carbon accounting for dental care has appeared since 2020, in the form of process-based life cycle assessments of individual procedures, calculator-based audits of clinics and laboratories, and scoping reviews that map the field without reconciling its findings.(11,12) The health-care sector more broadly has consolidated methods for this task, and narrative reviews of the sector's climate role now exist for guidance.(13) What the dental literature still lacks is a synthesis that holds the per-unit and the aggregate estimates together, separates measurement from intervention, and identifies which reductions are supported by measured outcomes rather than by assumption. The methods needed to close that gap already exist elsewhere: health-care systems have established hybrid accounting that combines spending and activity data, and hospital-level reviews have demonstrated that service-level footprints can be produced routinely.(9,14) The objective of this review is to synthesize the published evidence on the size, main sources, and reduction strategies of the carbon footprint of dental practice between 2018 and 2025. It is guided by one question: how large is the footprint, which processes contribute most, and which strategies reduce it measurably without compromising care?
METHODS
Sources and search strategy
The search was designed to answer the gap identified above, which requires both per-unit life cycle assessments and studies of whole practices and care pathways. Three bibliographic sources were queried to the preparation of this manuscript: OpenAlex, Crossref, and PubMed. OpenAlex and Crossref were used for their broad coverage of journal articles, including items not indexed in biomedical databases, and PubMed for its coverage of the clinical dental literature. Searches combined terms for the carbon footprint and environmental sustainability of dental care with terms for specific processes, including single-use plastics, amalgam and mercury waste, nitrous oxide, and digital dentistry. The core search window was restricted to publications from 2018 through 2025 to capture the period in which measurement methods consolidated; older or methodological works were admitted only when they were needed to contextualize a finding, and none post-dates 2025.
Selection criteria and organization
Studies were selected if they reported a quantified estimate of greenhouse gas emissions or environmental impact attributable to dental care, compared materials or equipment by environmental impact, or evaluated an intervention intended to reduce that impact. Surveys of awareness and barriers were included when they explained the gap between available evidence and its adoption in practice. Editorials, commentaries without data, and studies of environmental topics outside dental care were excluded. The selection criterion deliberately spans primary life cycle assessments and audits, comparative studies, and intervention evaluations, because the review question cannot be answered by any single design; a footprint requires measurement studies, and a reduction strategy requires intervention studies. No claim of exhaustiveness is made, consistent with the narrative design and the SANRA guidance for such reviews.(15)
Synthesis approach
The selected evidence was organized into a matrix of four thematic axes, each linking specific claims to the studies that support or contradict them and to the quality of their designs. The four axes are the size and measurement of the footprint, materials and single-use consumables, clinical gases and waste streams, and interventions. Because the review seeks to move from description to action, intervention studies were kept distinct from descriptive measurement studies so that reductions could be separated from baselines. Quantitative values reported in the text are taken from the primary studies cited; no estimate was generated for this review. The matrix format was chosen over a study-by-study account because the review question is comparative: the same source, whether travel, procurement, or nitrous oxide, recurs across studies, and grouping claims by source makes convergence and divergence visible. Divergent findings were retained rather than resolved by majority, so the synthesis reflects the range of the evidence rather than its average. Cross-sector studies from surgery and anaesthesia were retained where they quantified a mechanism that dental care shares, such as single-use plastics or nitrous oxide, and are identified as such in the synthesis. Selection and synthesis were performed by one reviewer against the stated criteria, and this limitation is addressed in the discussion.
DEVELOPMENT
Size and measurement of the footprint
The evidence that speaks most directly to the opening contradiction shows that both framings are correct, because they measure different things. Process-based life cycle assessments find small footprints for single episodes of care. A two-visit root canal treatment was estimated at 4.9 kg CO2e,(16) and a carbon audit of private clinics in Egypt placed an average patient visit at 4.3 kg CO2e.(17) These per-unit values are small in absolute terms and easy to dismiss. The aggregate values are not. The same Egyptian audit estimated an average clinic at 14,426.8 kg CO2e per year, and a companion study of dental laboratories estimated 20,820 kg CO2e per laboratory-year, equivalent to 2.9 kg CO2e per prosthesis or appliance.(17,18) Lifetime modeling in the United Kingdom reported between 285 and 2,170 kg CO2e per person depending on disease and treatment experience.(6) The gap between the per-unit and the aggregate scale is therefore not a disagreement about method but a difference in the functional unit chosen (Figure 1).
The dominant sources are more consistent. Travel, procurement, and energy explain most of the emissions in every study that decomposes them. In the Egyptian clinic audit, patient travel contributed 45.6% and staff travel 19.6%, together 65.2% of the footprint, followed by energy at 18% and procurement at 12.4%.(17) Energy ranked below travel in both audits, a reminder that the direct energy of the building is a smaller lever than the movement and manufacture that surround it. In the laboratory audit, staff travel contributed 43.6%, procurement 27.8%, and energy 25%.(18) The same ordering appears in life cycle analyses of a United Kingdom practice, which repeatedly identified travel as the largest contributor.(19,20) The pattern also matches health care at large, where purchased goods and services and patient travel dominate national footprints rather than the energy of care facilities themselves.(9) This convergence is the clearest quantitative finding of the literature: a dental practice's climate impact is driven less by the clinical procedure itself than by how people reach it and how its supplies are made and moved. The attribution across scopes explains why procurement looms large: the emissions embedded in purchased instruments, materials, and consumables sit in scope 3, outside the practice's direct control but inside its purchasing decisions.(2,9) Table 1 summarizes the principal estimates (Table 1).
Study (year) | Setting and scope | Method | Main estimate |
|---|---|---|---|
Duane et al. (2020)(16) | United Kingdom; two-visit root canal treatment | Process-based LCA | 4.9 kg CO2e per procedure |
Elwan et al. (2025)(17) | Egypt; private dental clinic, 1 year | Carbon footprint calculator | 14,426.8 kg CO2e per clinic-year; 4.3 kg CO2e per patient visit |
Elwan et al. (2025)(18) | Egypt; private dental laboratory, 1 year | Carbon footprint calculator | 20,820 kg CO2e per laboratory-year; 2.9 kg CO2e per prosthesis |
Martin et al. (2024)(6) | United Kingdom; lifetime oral care to age 50 | Modeled from peer-reviewed data | 285 to 2,170 kg CO2e per person |
Noodaeng et al. (2025)(21) | Thailand; implant-supported prosthesis | Comparative LCA | 31.8 to 35.1 kg CO2e per unit |
Lalloo et al. (2025)(7) | Global; air travel to four oral health meetings | Public attendance data and calculators | Approximately 47,000 t CO2e total |
Note: CO2e = carbon dioxide equivalent. Values are reported as published by each study and use different functional units. Source: Elaborated from the primary studies cited in the review.
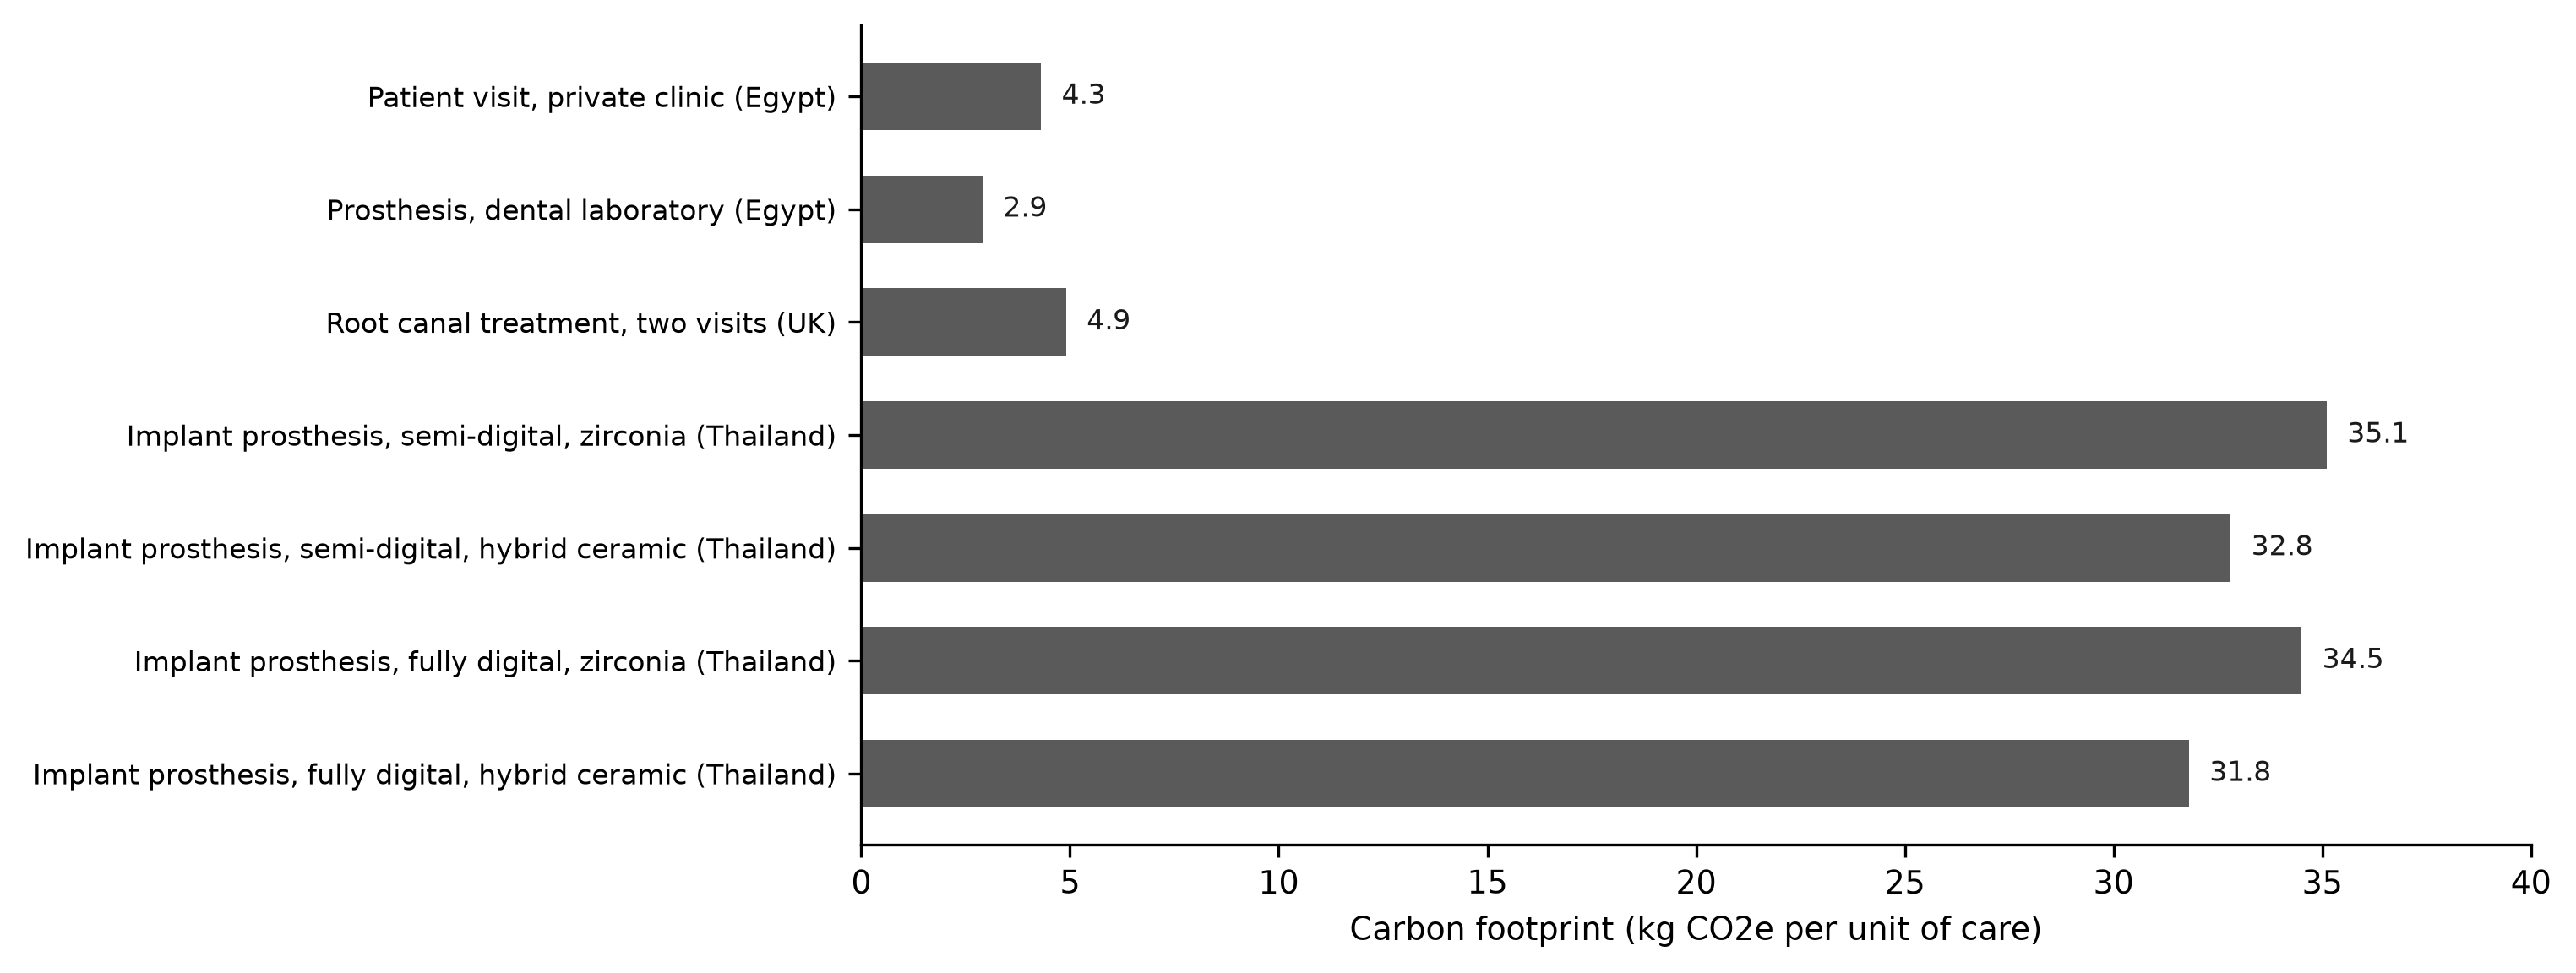
Figure 1. Reported carbon footprint per unit of dental care.
Note: Values use the functional units of each study and are not directly interchangeable across procedures. Source: Elaborated from the primary studies cited in the review.Method heterogeneity is the main obstacle to comparability. Studies differ in system boundaries, in whether travel is included, in the use of spend-based or activity-based accounting, and in the choice of functional unit.(22) A calculator built for general dental practice combines spend-based and activity-based accounting precisely because neither alone captures the full footprint.(22) Some analyses exclude patient travel, which the audit data show can be the single largest source, so exclusions change rankings as well as magnitudes. Reviews of hospital care pathways report the same difficulty and call for standardized functional units and transparent boundaries.(14) This heterogeneity means the field can currently rank sources within a study more reliably than it can compare magnitudes between studies, and it explains why published numbers for superficially similar units of care can differ by an order of magnitude.
Measurement tools are available and are the precondition for any of the reductions that follow. The carbon calculator developed for general dental practice translates a practice's activity and spend into a greenhouse gas estimate without requiring specialist software, which lowers the entry barrier to a baseline audit.(22) The Egyptian clinic and laboratory studies used the same calculator-based logic and demonstrated that a practice can obtain a decomposed estimate from routine administrative data on visits, staff, energy, water, procurement, and waste.(17,18) What is still missing is a common reporting standard: without an agreed functional unit and system boundary, two practices measuring the same activity will not produce comparable numbers, and benchmarking, which drives improvement in other areas of quality, cannot begin.
Materials and single-use consumables
On the material side, single-use plastics are the most quantified stream and the clearest target. Observational work in United Kingdom primary and secondary care found an average of 21 single-use plastic items per procedure, with a mean mass of 354 g, dominated by generic surgery set-up items used for every patient.(23) Across a lifetime of care, modeled single-use plastic waste rose from 1,382 items and 4.6 kg in low disease experience to 12,200 items and 33.8 kg in high disease experience.(6) The pattern is not specific to dentistry; a material flow analysis of a surgical hospital measured 619 g of medical consumables per patient per day, of which 86% were polymers.(24) Dental care combines high visit volumes with a routine reliance on plastic barriers, aspirators, and examination kits, which turns a modest per-item mass into a substantial stream that repeats at every appointment.
The COVID-19 pandemic amplified the single-use problem and left a useful measurement behind. Life cycle assessments of pandemic-era personal protective equipment quantified the environmental impact of gowns, visors, and respirators and showed that choices among them differ materially, with reusable and disposable options trading impact between carbon and human health categories.(25) The episode demonstrated both the speed with which practice can shift toward disposables under an infection control imperative and the value of measuring the trade-off before it becomes habitual.
The dental examination deserves attention because it is the highest-volume procedure in dentistry and because its kit is used for every patient. A life cycle analysis of an examination identified soaps and detergents, disposable bibs, surface disinfection, stainless-steel instruments, and clothing as the main hotspots, a list that points to hygiene and sterilization rather than to any single clinical device.(5) Because the examination repeats across every visit, small per-examination improvements propagate to the whole caseload, which is the same volume logic that governs the footprint as a whole.
Where reusable and disposable options have been compared directly, reusables generally perform better. A life cycle assessment of dental examination kits, conducted across sixteen ecological impact categories and eight human health categories, found the disposable plastic kit worse than a reusable stainless-steel kit across all of them.(26) The same direction held for nitrous oxide sedation equipment, where disposable items produced a larger impact across nearly all categories.(27) The comparison is not one-sided in every case, however. An assessment of personal protective equipment during the COVID-19 pandemic found that a reusable gown carried greater damage to human health than a disposable gown, because the washing and drying burden dominated its life cycle.(25) These exceptions matter: they show that reusability lowers carbon only when the reprocessing step is itself efficient, and they caution against assuming that any reusable substitute is automatically greener.
Dental materials differ substantially by type and by manufacturing pathway, and the direction is not always the one clinicians expect. A cradle-to-gate assessment of direct restorative materials compared amalgam, resin composite, and glass ionomer cement per restoration, using functional units of 1.14 g, 0.25 g, and 0.54 g respectively, and found distinct impact profiles in which packaging contributed a relevant share of the burden.(28) This last point is easy to overlook in clinical practice: the environmental cost of a restoration includes its packaging and shipping, not only the material placed in the tooth.(28) For implant-supported prostheses, a comparative analysis of four fabrication workflows reported between 31.8 and 35.1 kg CO2e per unit, and found that fully digital workflows were not uniformly lower-carbon than semi-digital ones; the choice of material block mattered as much as the degree of digitalization.(21) Orthodontic retainers showed a clearer ranking, with the Hawley retainer carrying a greater environmental burden than the Essix retainer across the impact categories assessed.(29) Among interdental cleaning aids used daily for five years, floss picks had the largest footprint in 13 of 16 impact categories.(30) Prosthodontic reviews reach the same conclusion, locating substantial emissions in raw material extraction, industrial production, and the management of waste across the value chain.(31) These comparisons, taken together, indicate that material substitution can reduce impact only when the substitute is chosen on evidence rather than on the assumption that digital or bio-based means lower-carbon.(32) Impression-taking shows the same balance: comparisons of conventional and digital impressions treat material waste, resource consumption, and energy use as indicators, and the benefit of scanning depends on the energy and hardware burden of the equipment.(32)
Clinical gases, amalgam, and waste streams
Two clinical inputs stand out as disproportionate contributors for the appointments that use them. Nitrous oxide is a potent greenhouse gas with a global warming potential about 298 times that of carbon dioxide over a 100-year horizon, and a life cycle impact assessment of a 30-minute dental sedation appointment, delivered at 6 L per minute in a 50:50 mixture with oxygen, found that disposable delivery equipment added further environmental burden on top of the gas itself.(27) Because nitrous oxide is used mainly for a minority of appointments, its effect is concentrated: the emissions attach to a small number of visits rather than spreading across the caseload. The wider anaesthesia literature reports the same problem. Nitrous oxide has limited clinical indications in modern anaesthesia, its low purchase price externalizes a climate cost of roughly 698 euros per emitted ton of CO2 equivalent, and European hospitals continue to use it despite this.(33) Modeling of paediatric anaesthesia shows inhalational agents, and nitrous oxide in particular, carrying a substantial share of the carbon footprint of the anaesthetic.(34) Hospital audits attribute more than 80% of anaesthetic gas emissions to nitrous oxide and identify wastage, not clinical use, as the driver.(35) Dentistry inherits this problem through inhalation sedation and inherits the same low-cost, high-impact mitigation: reducing leakage and unnecessary use.
Amalgam connects environmental policy to restorative practice. The Minamata Convention on Mercury, adopted in 2013 and in force since 2017, has driven a global phase-down of dental amalgam, with phase-out dates for mercury-added products set between 2020 and 2025.(36) Implementation, awareness, and preparedness are uneven. Surveys in Nigeria and Kenya found that many dentists knew of the phase-down but differed in their readiness to substitute mercury-free materials, with access and cost as recurring constraints in lower-resource settings.(37,38) The environmental case for phase-down is well established; the clinical consequence is a shift toward adhesive restorative materials whose own environmental profiles, including packaging and microplastic release, are only beginning to be measured.(28) Amalgam therefore illustrates a broader point of this review: reducing one environmental burden can transfer it to another stream unless the substitute is assessed with the same rigor. Policy accompanies the science: governments were tasked to develop guidelines and phase-down plans under the Convention, and the variation in preparedness documented across countries suggests that regulation sets a direction while the pace of change is set by workforce readiness.(36,37)
Waste segregation and recycling produce measurable but partial gains. A 12-month recycling initiative in a Malaysian dental school collected 443.57 kg of recyclable waste, 53.9% of it plastic, and was associated with a decline in clinical waste production over the same period.(39) Reviews of dental solid waste reach the same conclusion: the waste stream is large and heterogeneous, and a meaningful share is recyclable, but segregation is inconsistent and much of what is classified as clinical waste is treated as infectious without evidence.(15,40) The barrier is as much regulatory and behavioral as technical, because infection control rules and habits favor single-use and incineration over recovery. The same tension appears whenever a reusable or lower-waste alternative is proposed against a precautionary infection control default, which is why the evidence on reusability reviewed above is directly relevant to waste policy in the operatory.
The recyclability of dental waste depends on classification as much as on material. Much plastic in the operatory is technically recyclable but is routed to clinical waste streams for precautionary reasons, and reviews of dental solid waste identify the failure to segregate at the point of generation as the recurring weak point.(40) Where segregation was implemented deliberately, as in the Malaysian dental school, the recycled fraction was dominated by plastic and paper and clinical waste declined, indicating that the barrier is procedural rather than physical.(39)
Interventions and their reported reductions
The intervention literature is small but consistent in direction. Where practices removed single-use plastics that were not required for infection control, the change was immediate: a quality improvement project across twelve practices in North London found ten used such plastics at baseline and most could reduce or eliminate them once the financial and environmental cost was made visible.(41) A comparative life cycle assessment of procurement, waste, and water changes recommended by a sustainability toolkit found measurable reductions per patient, including a saving of 30 g CO2e per patient from substituting harvested rainwater for mains supply.(42) These are small per-unit savings that become material when multiplied across the visit volume of a practice or a health system, and the same toolkit logic is what the mitigation literature recommends as a baseline step before any larger redesign.(43)
The synthesis also supports actions that prevent waste rather than manage it. Reviews framed around the reduce, reuse, rethink, and recycle hierarchy argue that the highest-yield sustainability measure is less restorative treatment in the first place, achieved through prevention and minimally invasive care.(15) This connects the environmental agenda to the clinical one: the same lifetime modeling that links high disease experience to a footprint near 2,170 kg CO2e also links low disease experience to a footprint near 285 kg CO2e, making prevention the single intervention with the largest modeled environmental return.(6)
Travel is the largest source, so interventions that avoid travel carry the largest potential saving. A study at a children's hospital quantified the travel distance and carbon emissions avoided when teledentistry replaced in-person visits, supporting remote triage and follow-up as a low-carbon model for the subset of care that does not require physical examination.(44) The same logic applies to professional travel: the four global oral health meetings assessed by Lalloo et al. generated approximately 47,000 t CO2e and 325 million passenger-kilometers, emissions that hybrid or distributed meeting formats could reduce without eliminating the scientific exchange.(7) The estimate is not abstract: 47,000 t CO2e is equivalent to the annual footprint of about 10,000 people, and the 325 million kilometers traveled reflect the global distribution of attendees, which makes meeting design, rather than attendance, the variable to optimize.(7)
Education changes knowledge and reported practice, but its effect on measured emissions is not yet established. A quasi-experimental program among dental interns improved knowledge and practices of eco-friendly dentistry after an educational intervention.(45) Surveys in India and elsewhere consistently find moderate awareness alongside structural barriers such as cost, time, and the absence of local guidance.(46,47) Scoping reviews of awareness and barriers arrive at the same picture: the profession knows the problem and wants guidance, while the constraints to adoption are organizational rather than attitudinal.(12,48) Cost, time, and the absence of local guidance recur as the named obstacles, which suggests that policy and practice infrastructure, not further persuasion, is the limiting factor.(46) Awareness is a necessary condition for adoption, not evidence of reduced emissions, and the intervention literature has so far measured awareness rather than emissions.
Across the four axes, the evidence supports a short list of high-yield actions: measure the practice footprint with a standard tool, target patient and staff travel, remove clinically unnecessary single-use plastics, purchase on environmental as well as financial criteria, control nitrous oxide, and segregate waste. Table 2 synthesizes the axes and the main gaps (Table 2).
Axis | Key findings | Representative evidence | Main gaps |
|---|---|---|---|
Size and measurement | Small per-unit footprint, large aggregate footprint; travel, procurement, and energy dominate | 12 studies, mostly LCA and carbon audits | Heterogeneous methods and functional units |
Materials and single-use consumables | Single-use plastics dominate waste; reusables usually but not always better; digital not automatically lower-carbon | 11 studies, comparative LCA | Few cradle-to-grave comparisons of substitutes |
Clinical gases and waste streams | Nitrous oxide is a concentrated high-impact input; amalgam phase-down uneven; segregation partly effective | 10 studies, LCA and surveys | Measured clinical outcomes of substitutes |
Interventions and reductions | Removing unnecessary plastics, rainwater, and teledentistry reduce emissions; education improves awareness only | 8 studies, quality improvement and before-after designs | Scarcity of measured emission outcomes |
Note: LCA = life cycle assessment. Study counts refer to the distinct sources cited within each axis of the matrix. Source: Elaborated from the evidence matrix of this review.
DISCUSSION
The contradiction that opened this review dissolves once the two scales are placed side by side. The literature is not divided about the size of dental care's footprint; it is divided about the unit in which that footprint is expressed. Studies that measure a single procedure report a few kilograms of CO2e, and studies that measure a practice, a laboratory, or a lifetime of care report hundreds to thousands of kilograms.(6,16,17) Both are true, and both are needed: the per-unit estimate tells a clinician what a single appointment costs the climate, while the aggregate estimate tells a profession what its annual and lifetime volume costs. The same reconciliation applies to the sources. Travel is the largest contributor in practice-level audits in Egypt and in life cycle analyses in the United Kingdom, which is why a per-visit footprint looks small in the operatory but large when the journey to and from the operatory is included.(17,20) That reconciliation, rather than a single headline number, is the main finding of this review. The synthesis earns this conclusion by holding per-unit life cycle assessments alongside practice-level audits and lifetime models, and by keeping intervention studies separate from descriptive ones so that the state of the evidence on reductions is explicit rather than implied.
The finding that travel, procurement, and energy dominate the footprint aligns with what is known about health care more broadly, and diverges from the clinical intuition that treatment itself is the main environmental act. Health-care carbon assessments consistently locate most emissions in supply chains and purchased goods and services, which is why procurement is the largest single scope in many national health systems.(1,2,9) Primary care reviews report the same pattern, with patient travel and consumables outweighing facility energy.(4 8 ) The dental-specific estimates are therefore not an anomaly but a local instance of a general rule: in a service that produces health rather than physical goods, the environmental weight sits in the movement of people and materials, not in the moment of care.
The divergences among studies are explained by the conditions of each setting rather than by conflicting findings. The Egyptian audits rank travel first because clinics there receive many patients over long distances and use calculator-based accounting that includes travel explicitly.(17) The United Kingdom life cycle analyses rank procurement and travel together because their boundaries include the supply chain of purchased goods.(19) The anaesthesia studies rank nitrous oxide first because they isolate the gas rather than the whole visit.(33) Each ranking is correct for its boundary, which is why the field's disagreements are mostly disagreements about what to count, and why a single standardized boundary would resolve more debates than any new estimate.
The review differs from earlier syntheses in one respect that has practical consequences. Scoping reviews published between 2021 and 2025 mapped the field and catalogued awareness, barriers, and best-practice checklists.(11,12,15) They established that the profession is aware of the problem and identified travel, procurement, and waste as priorities. What they could not do, because the studies did not yet exist, was say which changes measurably reduce emissions. The intervention evidence assembled here is thinner but points in a consistent direction: removing clinically unnecessary single-use plastics, substituting harvested rainwater, and avoiding travel through teledentistry all produced measured reductions in the studies that quantified them.(41,42,44) The next step for the field is to treat emission reduction as an outcome to be measured, not a virtue to be assumed.
Two cautions emerge from the comparisons of materials and equipment, and both matter for practice. The first is that reusability is not automatically lower-carbon. The disposable examination kit was worse than the reusable kit, and disposable sedation equipment was worse than reusable, but a reusable gown carried a higher human health burden than a disposable gown when its laundering was included.(25-27) The second is that digital fabrication is not automatically lower-carbon: fully digital implant workflows were not uniformly better than semi-digital ones, because the material block and its production burden could outweigh the savings from fewer steps.(21) These findings argue against checklist-style substitution and for life cycle assessment as the default arbiter when a practice chooses between options. They also explain a tension that surfaces in reviews of green dentistry: the field offers many candidate substitutions and few verified ones, which is why checklists proliferate while measured reductions remain scarce.(10,43)
Nitrous oxide and amalgam deserve emphasis because they are concentrated and policy-relevant. Nitrous oxide attaches a large climate impact to a small number of appointments, and the anaesthesia literature shows that wastage and leakage, not clinical necessity, drive much of the total.(27,33) Amalgam is being phased down under the Minamata Convention, but readiness is uneven across countries, and the substitutes bring their own material and packaging burdens that are only beginning to be quantified.(28,36,38) Both cases illustrate the same risk: an intervention that is environmentally rational at the level of policy can fail, or simply relocate the burden, at the level of the operatory if the substitute is not assessed. Prevention is the other policy lever the synthesis surfaces, because lower disease experience is associated with a markedly lower lifetime footprint, which makes disease prevention a sustainability strategy as well as a clinical one.(6,8)
This review has limitations that follow from its design and from the state of the evidence. It is narrative and non-systematic, with selection performed by one reviewer against explicit criteria, so relevant studies may have been missed despite searches in three sources.(15) A systematic search with dual screening would strengthen confidence and should precede any attempt to pool effect sizes. The evidence is geographically concentrated in the United Kingdom and Egypt, with fewer studies from low- and middle-income settings, which limits generalizability to different travel, energy, and waste infrastructures; expanding measurement to those settings is a research priority.(38) The primary studies use heterogeneous methods and functional units, which prevents formal comparison of magnitudes across procedures.(14) Finally, most intervention evidence reports activity or waste outcomes rather than verified emission reductions, so the size of the achievable saving remains uncertain. Each of these limitations has a concrete remedy: protocol-based dual screening, standardized functional units and system boundaries, reporting emissions as a measured outcome, and replication in under-represented health systems.
The research agenda that follows from these gaps is concrete. Standardized functional units and system boundaries, agreed across the field, would make studies comparable and enable benchmarking. Intervention studies should report greenhouse gas emissions as a measured outcome, not only waste mass or activity counts, so that the size of achievable reductions becomes known. Measurement should extend beyond the United Kingdom and Egypt to low- and middle-income settings, where travel, energy, and waste infrastructures differ and where amalgam substitution is most constrained.(38) Finally, the environmental assessment of amalgam alternatives and digital workflows should be cradle-to-grave, so that burden shifting between material, energy, and waste streams is detected rather than assumed away.(21,28)
In practice, a dental team can act now on the findings that are already consistent. It can measure its footprint with an available calculator, target the two largest sources it controls indirectly, travel and procurement, remove single-use plastics that infection control does not require, manage nitrous oxide as a high-impact gas, and segregate waste.(22,39,41) None of these requires waiting for better data, and together they address the sources that the evidence identifies as dominant. What requires better data is the next layer of decisions: which restorative material, which fabrication pathway, and which reusable substitute are genuinely lower-carbon in a given setting, and those decisions should be guided by life cycle evidence rather than by the green credentials of a product label.
Framing sustainability as quality improvement rather than as sacrifice may be the most useful translation of this evidence. The changes with the strongest measured support, removing unnecessary plastics, capturing rainwater, and offering teledentistry where safe, are also operational simplifications that reduce cost or time.(41,42,44) The framing is not new: the World Dental Federation has argued that environmentally sustainable dentistry and good-quality oral healthcare are the same project, because prevention and minimal intervention reduce both disease and waste.(8) What this review adds is the ordering, that travel and procurement should be addressed first because the data place them first, and the caution that substitution decisions need life cycle evidence rather than intuition.
CONCLUSIONS
The carbon footprint of dental care is small at the level of a single procedure and large at the level of a practice, a laboratory, or a lifetime of care, and the difference is explained by volume, by the inclusion of patient and staff travel, and by procurement. Travel, procurement, and energy consistently outweigh the clinical procedure itself as sources of emissions. Single-use plastics dominate the waste stream, and reusable or digital alternatives reduce impact only when the substitute is assessed rather than assumed, because laundering and material production can offset the savings. Nitrous oxide and amalgam are concentrated, policy-relevant targets whose substitution must be managed with the same rigor as the burden they remove. Measurable reductions are achievable today through unnecessary-plastic removal, low-carbon procurement, rainwater harvesting, teledentistry, and waste segregation, while education alone changes awareness more than emissions. Standardizing measurement and reporting emissions as an outcome are the conditions required to move the field from demonstrated awareness to verified reduction.
References
- 1 Pichler PP, Jaccard IS, Weisz U, Weisz H. International comparison of health care carbon footprints. Environ Res Lett. 2019;14(6):064004. doi: 10.1088/1748-9326/ab19e1
- 2 Karliner J, Slotterback S, Boyd R, Ashby B, Steele K, Wang J. Health care’s climate footprint: the health sector contribution and opportunities for action. European Journal of Public Health. 2020;30(Supplement_5):ckaa165.843. doi: 10.1093/eurpub/ckaa165.843
- 3 Lenzen M, Malik A, Li M, Fry J, Weisz H, Pichler PP, et al. The environmental footprint of health care: a global assessment. The Lancet Planetary Health. 2020;4(7):e271-e279. doi: 10.1016/s2542-5196(20)30121-2
- 4 Rodríguez‐Jiménez L, Romero‐Martín M, Spruell T, Steley Z, Gómez‐Salgado J. The carbon footprint of healthcare settings: A systematic review. Journal of Advanced Nursing. 2023;79(8):2830-2844. doi: 10.1111/jan.15671
- 5 Borglin L, Pekarski S, Saget S, Duane B. The life cycle analysis of a dental examination: Quantifying the environmental burden of an examination in a hypothetical dental practice. Comm Dent Oral Epid. 2021;49(6):581-593. doi: 10.1111/cdoe.12630
- 6 Martin N, Hunter A, Constantine Z, Mulligan S. The environmental consequences of oral healthcare provision by the dental team. Journal of Dentistry. 2024;142:104842. doi: 10.1016/j.jdent.2024.104842
- 7 Lalloo R, Elango P, Nicolau B. The air travel carbon footprint of four recent global oral health meetings – Should we fly less?. Journal of Dentistry. 2025;158:105795. doi: 10.1016/j.jdent.2025.105795
- 8 Martin N, Mulligan S. Environmental Sustainability Through Good-Quality Oral Healthcare. International Dental Journal. 2022;72(1):26-30. doi: 10.1016/j.identj.2021.06.005
- 9 Tennison I, Roschnik S, Ashby B, Boyd R, Hamilton I, Oreszczyn T, et al. Health care's response to climate change: a carbon footprint assessment of the NHS in England. The Lancet Planetary Health. 2021;5(2):e84-e92. doi: 10.1016/s2542-5196(20)30271-0
- 10 Hackley DM, Luca J. Sustainability in Dentistry: An Overview for Oral Healthcare Team Members. Journal of the California Dental Association. 2024;52(1):2422150. doi: 10.1080/19424396.2024.2422150
- 11 Chalotra R, Shenoy R, Dasson Bajaj P, Rao A, Pai M, Jodalli P, et al. A scoping review exploring carbon emissions in dentistry—a step towards sustainability. BMC Oral Health. 2025;25(1):1674. doi: 10.1186/s12903-025-06952-w
- 12 Martin N, Sheppard M, Gorasia G, Arora P, Cooper M, Mulligan S. Drivers, opportunities and best practice for sustainability in dentistry: A scoping review. Journal of Dentistry. 2021;112:103737. doi: 10.1016/j.jdent.2021.103737
- 13 Or Z, Seppänen AV. The role of the health sector in tackling climate change: A narrative review. Health Policy. 2024;143:105053. doi: 10.1016/j.healthpol.2024.105053
- 14 Kouwenberg LHJA, Cohen ES, Hehenkamp WJK, Snijder LE, Kampman JM, Küçükkeles B, et al. The Carbon Footprint of Hospital Services and Care Pathways: A State-of-the-Science Review. Environ Health Perspect. 2024;132(12):126002. doi: 10.1289/ehp14754
- 15 Di Spirito F, Giordano F, Di Palo MP, De Benedetto G, Aulisio L, Boccia G. Sustainable Dental and Periodontal Practice: A Narrative Review on the 4R-Framework—Reduce, Reuse, Rethink, Recycle—And Waste Management Rationalization. Dentistry Journal. 2025;13(9):392. doi: 10.3390/dj13090392
- 16 Duane B, Borglin L, Pekarski S, Saget S, Duncan HF. Environmental sustainability in endodontics. A life cycle assessment (LCA) of a root canal treatment procedure. BMC Oral Health. 2020;20(1):348. doi: 10.1186/s12903-020-01337-7
- 17 Elwan AH, Tantawi ME, Fouda AM. Carbon footprint of private dental clinics in Egypt: a cross-sectional study. BMC Oral Health. 2025;25(1):93. doi: 10.1186/s12903-024-05413-0
- 18 Elwan AH, Fouda AM. Carbon footprint of private dental laboratories in Egypt: A cross-sectional study. BDJ Open. 2025;11(1):40. doi: 10.1038/s41405-025-00316-w
- 19 Duane B, Steinbach I. What is the environmental footprint of a dental practice? A life cycle analysis (Part 1). Br Dent J. 2024. doi: 10.1038/s41415-023-6710-z
- 20 Duane B, Stancliffe R, Miller FA, Sherman J, Pasdeki-Clewer E. Sustainability in Dentistry: A Multifaceted Approach Needed. J Dent Res. 2020;99(9):998-1003. doi: 10.1177/0022034520919391
- 21 Noodaeng S, Petchmedyai P, Janthasen A, Ponthip A, Neamhom T, Patthanaissaranukool W. Comparative carbon footprint analysis of semi-digital and fully digital implant-supported prosthesis fabrication processes. Environmental Challenges. 2025;20:101294. doi: 10.1016/j.envc.2025.101294
- 22 Duane B, Steinbach I, Mackenzie L. A carbon calculator: the development of a user-friendly greenhouse gas measuring tool for general dental practice (Part 2). Br Dent J. 2024;236(1):57-61. doi: 10.1038/s41415-023-6626-7
- 23 Martin N, Mulligan S, Fuzesi P, Hatton PV. Quantification of single use plastics waste generated in clinical dental practice and hospital settings. Journal of Dentistry. 2022;118:103948. doi: 10.1016/j.jdent.2022.103948
- 24 Ivanović T, Meisel HJ, Som C, Nowack B. Material flow analysis of single-use plastics in healthcare: A case study of a surgical hospital in Germany. Resources, Conservation and Recycling. 2022;185:106425. doi: 10.1016/j.resconrec.2022.106425
- 25 Almutairi W, Saget S, Mc Donnell J, Tarnowski A, Johnstone M, Duane B. The planetary health effects of COVID-19 in dental care: a life cycle assessment approach. Br Dent J. 2022;233(4):309-316. doi: 10.1038/s41415-022-4906-2
- 26 Byrne D, Saget S, Davidson A, Haneef H, Abdeldaim T, Almudahkah A, et al. Comparing the environmental impact of reusable and disposable dental examination kits: a life cycle assessment approach. Br Dent J. 2022;233(4):317-325. doi: 10.1038/s41415-022-4912-4
- 27 Fennell-Wells A, Duane B, Ashley P, Morgan E. The environmental impact of nitrous oxide inhalation sedation appointments and equipment used in dentistry. Eur Arch Paediatr Dent. 2024;25(3):393-408. doi: 10.1007/s40368-024-00895-6
- 28 Smith L, Ali M, Agrissais M, Mulligan S, Koh L, Martin N. A comparative life cycle assessment of dental restorative materials. Dental Materials. 2023;39(1):13-24. doi: 10.1016/j.dental.2022.11.007
- 29 Da Tan TY, Duane B, Hussein A, Samsonova A, Sizun G, Shakerdi L, et al. Environmental sustainability of post-orthodontic dental retainers: a comparative life-cycle assessment of Hawley and Essix retainers. European Journal of Orthodontics. 2024;46(2):cjae012. doi: 10.1093/ejo/cjae012
- 30 Abed R, Ashley P, Duane B, Crotty J, Lyne A. An environmental impact study of inter‐dental cleaning aids. J Clinic Periodontology. 2023;50(1):2-10. doi: 10.1111/jcpe.13727
- 31 Shinkai RSA, Biazevic MGH, Michel-Crosato E, de Campos TT. Environmental sustainability related to dental materials and procedures in prosthodontics: A critical review. The Journal of Prosthetic Dentistry. 2025;133(6):1466-1473. doi: 10.1016/j.prosdent.2023.05.024
- 32 Al-Salih ZA, Ibrahem ET. Sustainable Practices in Dental Prosthesis: A Green Dentistry Perspective. Al-Wataniya J Med Sci. 2025;1(1):1-8. doi: 10.66564/ajms.2025.10001
- 33 Lehmann F, Schulz CM, Leicht D, Brady S, Fuhrmann A, Prütting J, et al. Persistent use of nitrous oxide for anaesthesia in European hospitals despite its harmfulness to the climate – how emission taxation can achieve the coupling of cost-effectiveness and climate protection: observational study. BMC Health Serv Res. 2023;23(1):1392. doi: 10.1186/s12913-023-10307-y
- 34 Narayanan H, Raistrick C, Tom Pierce JM, Shelton C. Carbon footprint of inhalational and total intravenous anaesthesia for paediatric anaesthesia: a modelling study. British Journal of Anaesthesia. 2022;129(2):231-243. doi: 10.1016/j.bja.2022.04.022
- 35 Karydi K, Kirkland J. Nitrous oxide mitigation at Horton General Hospital. BJA Open. 2023;6:100182. doi: 10.1016/j.bjao.2023.100182
- 36 Kisumbi BK, Osiro OA, Gathece LW, Maina SW. Dental Amalgam Phase‐Down—Status, Alternatives, Strategies and Preparedness for Implementation: A Review. International Journal of Dentistry. 2025;2025(1):6688410. doi: 10.1155/ijod/6688410
- 37 Makanjuola JO, Umesi DC, Ndukwe AN, Enone LL, Sotunde OA, Omo JO, et al. Managing the phase‐down of amalgam amongst Nigerian dental professionals and students: A national survey. Eur J Dental Education. 2020;24(4):666-678. doi: 10.1111/eje.12554
- 38 Kisumbi BK, Gathece LW, Osiro OA, Maina SW. Knowledge on the Minamata Convention on mercury and dental amalgam phase down, availability, and selection of mercury-free restorative materials among dentists in Kenya: a cross-sectional study. Pan Afr Med J. 2025;52:1-1. doi: 10.11604/pamj.2025.52.1.44453
- 39 Fisal AA, Rohani MM, Nor NAM, Hamzah TNNT. Reductions in clinical waste and environmental emissions through recycling and waste segregation in a dental school: a cross-sectional study. Br Dent J. 2025. doi: 10.1038/s41415-025-8913-y
- 40 Hashemizadeh A, Lyne A, Liddicott M. Reducing single-use plastics in dental practice: a quality improvement project. Br Dent J. 2024;237(6):483-486. doi: 10.1038/s41415-024-7836-3
- 41 Suresh P, Crotty J, Tesanovic S, Alaweed O, Doyle S, Kiandee M, et al. A life cycle analysis of the environmental impact of procurement, waste and water in the dental practice. Br Dent J. 2024;236(7):545-551. doi: 10.1038/s41415-024-7239-5
- 42 Martin N, Smith L, Mulligan S. Sustainable oral healthcare and the environment: mitigation strategies. Dent Update. 2021;48(7):524-531. doi: 10.12968/denu.2021.48.7.524
- 43 Danesh DO, Luca J, Kalady SE, Townsend JA, Hammersmith KJ, Meyer BD. The impact of teledentistry on travel distance and carbon emissions at a children’s hospital. The Journal of the American Dental Association. 2025;156(2):144-150. doi: 10.1016/j.adaj.2024.11.007
- 44 Hassan EH, Lotfy N, Abdou MH, Fetohy EM, Hussein MF. Effectiveness of an environmental educational program on intern dentists’ knowledge and practices regarding eco-friendly green dentistry: a quasi-experimental study. BMC Med Educ. 2025;25(1):32. doi: 10.1186/s12909-024-06523-7
- 45 Thakar S, Kinariwala N, Pandya D, Parekh NH, Patel NK, Patel A. Awareness and Constraints towards the Implementation of Green Dentistry amongst Dental Students and Private Practitioners of West India. J Pharm Bioallied Sci. 2023;15(Suppl 2):S1287-S1290. doi: 10.4103/jpbs.jpbs_116_23
- 46 Mary AV, Kesavan R, T H, S.B B. Green Dentistry: Assessing Carbon Footprint Awareness and Practices Among Dental Professionals. Int J Pharm Sci Rev Res. 2025;85(2). doi: 10.47583/ijpsrr.2025.v85i02.011
- 47 Martin N, Sheppard M, Gorasia G, Arora P, Cooper M, Mulligan S. Awareness and barriers to sustainability in dentistry: A scoping review. Journal of Dentistry. 2021;112:103735. doi: 10.1016/j.jdent.2021.103735
- 48 Walsh SJ, O’Leary A, Bergin C, Lee S, Varley Á, Lynch M. Primary healthcare’s carbon footprint and sustainable strategies to mitigate its contribution: a scoping review. BMC Health Serv Res. 2024;24(1):1630. doi: 10.1186/s12913-024-12068-8
Declarations
Funding
No financing
Conflict of interest
None
Authorship contributions
Drafting – original draft: Greta Cordovi Vallongo, Ana Rodríguez Yanes.
Writing–review and editing: Greta Cordovi Vallongo, Ana Rodríguez Yanes.