

Abstract
Introduction: Access to National Health Service dentistry in England deteriorated during the COVID-19 pandemic, but how activity per population changed across areas and which areas remain persistently under-served is unclear. Methods: Ecological longitudinal study of 287 English local authority districts. Units of dental activity delivered per 1000 population were derived from NHSBSA dental statistics for financial years 2019/20 to 2023/24 and linked to the English Index of Multiple Deprivation 2019. Persistent low activity was defined as activity in the lowest quintile in at least four of five years. Logistic regression and gradient boosting were compared with five-fold cross-validation. Results: Mean activity fell from 1,370.5 per 1000 in 2019/20 to 1,245.5 per 1000 in 2023/24, a decline of −125.0 per 1000, with an acute collapse to 425.0 per 1000 in 2020/21 and only partial recovery. Activity correlated positively with deprivation (r = 0.42). Districts with persistent low activity were less deprived (mean IMD score 16.5 versus 20.4) and smaller (mean population 151,027 versus 188,984). Deprivation and population predicted persistent low activity only modestly (area under the curve 0.61 and 0.54). Conclusions: National Health Service dental activity collapsed during the pandemic and recovered incompletely. Activity is pro-poor in its geographic distribution, and persistently low activity concentrates in less deprived districts, consistent with substitution by private dentistry rather than an inverse care gradient.
Keywords
health services accessibility, dental care, deprivation, machine learning, small-area analysis, England
INTRODUCTION
Access to National Health Service dentistry in England deteriorated through the late 2010s and worsened sharply during the COVID-19 pandemic, when routine care was suspended and many practices never fully reopened to NHS patients.(1,2) Media accounts of patients unable to find an NHS dentist have become common, and the geographic unevenness of this problem has entered public and parliamentary debate.(3,4)
The root causes are contested, but they include a unit-of-dental-activity contract that many argue misaligns incentives, longstanding underfunding relative to need, and a workforce whose distribution follows practice economics rather than population need. Because NHS dental services are commissioned and delivered locally, monitoring activity per population at the level of local authority districts is a natural way to track where access has fallen furthest and where it has failed to recover.
The dental contract itself has been the subject of repeated reform proposals, and the measured decline in activity provides an empirical backdrop against which the success or failure of those reforms can be judged.
The relationship between deprivation and NHS dental activity is central to this debate and is more subtle than it first appears. A long literature documents socioeconomic inequalities in dental attendance and unmet need, with deprived groups less likely to attend and more likely to report unmet need across England and Europe.(5-7)
At the same time, because deprived populations depend on NHS rather than private dentistry, the volume of NHS activity delivered per resident can be higher in deprived areas even while unmet need remains high, a pattern described as the inverse dental care law in Scotland and England.(8,9)
This tension means that a low volume of NHS activity per population does not automatically indicate a shortage of access; it may instead indicate substitution by private care in more affluent areas.(10)
Oral health inequalities are not unique to England: they are among the most persistent gradients in high-income countries, and international comparisons consistently place dental care near the top of the list of services for which access tracks income.(6,11)
The English case is nevertheless distinctive because adult dental care is funded largely out of pocket within a universal system, so the public and private sectors substitute for one another in a way that shapes the geographic footprint of NHS activity.
Ethnicity adds a further dimension to these inequalities. Scoping reviews of oral health in the United Kingdom find that ethnic minority groups bear a disproportionate burden of oral disease and face additional barriers to accessing NHS dental care, patterns that overlap with but are not reducible to socioeconomic position.(12)
The dental workforce itself is unevenly distributed, and the availability of general dental practitioners has long been lower in some areas than in others, a distribution shaped by practice economics rather than population need.(13,14)
Regular dental attendance among older adults is also socially patterned, so the districts where activity is lowest are not necessarily those where need is lowest, and the two must be distinguished rather than conflated.(15)
Measuring dental access at small-area level poses a distinct challenge, because no single indicator captures the relevant concept. Approaches used in the literature include the number of practitioners per resident, the proportion of the population attending within a period, and the volume of treatment delivered per resident; each captures a different aspect of the access pathway from availability through uptake to receipt of care.(16)
Prior neighbourhood-level work in England has combined these sources to show that spatial disparities in NHS dentistry are associated with deprivation and with the local availability of practices.(10,17) The present study uses treatment volume per resident, which reflects the realised end of the pathway, and interprets it alongside deprivation to separate low activity driven by private substitution from low activity driven by genuine shortage.
Machine learning offers a way to interrogate which area characteristics predict persistently low NHS activity and to move beyond single-year cross-sectional description.(18,19) By fitting a model and reporting its out-of-sample performance, an analysis can distinguish the part of the geographic pattern that deprivation can explain from the part that it cannot, which is a more informative claim than a single correlation coefficient. Recent work has used linked administrative dental datasets to describe area-level inequalities in England, and a systematic review of dental deserts has called for better spatial characterisation of workforce and activity.(20,21)
The objective of this study was to describe the change in NHS dental activity per population across English local authority districts between financial years 2019/20 and 2023/24 and to test which area characteristics predict persistent low activity.
METHODS
Design and data
This was an ecological longitudinal study of English local authority districts, chosen because they are the scale at which dental services are commissioned and at which population and deprivation data are routinely published. Units of dental activity (UDA) delivered by patient location were obtained from the NHS Business Services Authority dental statistics, which report activity by financial year and by geography including local authority districts.(22)
A UDA is a weighted measure of dental treatment in which a simple examination carries fewer units than a course of treatment involving fillings or dentures; the measure is therefore a summary of the volume of clinical work delivered rather than a simple count of attendances. Financial years 2019/20 through 2023/24 were analysed, a window that brackets the immediate pre-pandemic year, the pandemic disruption, and the subsequent recovery.
The outcome was UDA delivered per 1000 population, computed by dividing each district's annual UDA total by its mid-2021 population from the Office for National Statistics. Activity was attributed to the patient's area of residence rather than the practice location, so the outcome describes where treated residents live rather than where practices are sited.
Area characteristics were drawn from the English Indices of Deprivation 2019 local authority summaries.(23)
Three characteristics were used: the average Index of Multiple Deprivation (IMD) score, where a higher score indicates greater deprivation and which summarises seven domains including income, employment, education, health, crime, barriers to housing and services, and the living environment; the proportion of lower-layer super output areas in the most deprived 10 percent nationally, which captures the concentration of deprivation rather than its average level; and the district population, which serves as a proxy for the rural and urban character of an area because smaller districts tend to be more rural.
Districts with missing activity in more than one of the five years were excluded. Persistent low activity was defined as activity per 1000 population in the lowest quintile in at least four of the five financial years, a definition chosen to capture sustained rather than transient under-provision. Trends were described with the mean and standard deviation by year, and the unadjusted association between deprivation and activity was quantified with the Pearson correlation coefficient.
Two properties of the data bear on interpretation. The NHSBSA activity records are administrative and therefore complete for contracted NHS care, but they exclude private treatment, which in England accounts for a substantial share of all dental care; the outcome is thus a measure of NHS activity, not of all dental care. The IMD is measured in 2019 and therefore precedes the outcome period, which is appropriate because deprivation is treated as a fixed area characteristic rather than a time-varying exposure, but it means changes in deprivation during the pandemic are not reflected in the predictor.
Statistical analysis
Two classifiers, logistic regression and gradient boosting, were trained to predict persistent low activity from the three area characteristics and compared with five-fold cross-validation using the area under the receiver operating characteristic curve, accuracy, and the F1 score for the low-activity class. Logistic regression provides a linear, transparent baseline, while gradient boosting can represent non-linear and interacting effects among the predictors.
Cross-validation was used because the low-activity class is a minority and an in-sample fit would overstate discrimination; performance was reported on out-of-fold predictions only. Permutation importance described the contribution of each predictor by measuring the drop in the area under the curve when each predictor is randomly shuffled, averaged over ten repeats. All analyses used Python 3.13 with scikit-learn, pandas, and NumPy under a fixed random seed so that the results are reproducible. Because all data are aggregated, anonymised, and publicly available, no ethics approval was required.
Two definitional choices warrant comment. First, activity was attributed to patient location rather than contract location, because the research question concerns where residents obtain care rather than where practices are sited; contract-location activity would describe the distribution of supply rather than realised use, and the two can diverge when patients cross district boundaries to attend. Second, the quintile threshold for persistent low activity was chosen as a relative rather than absolute criterion, so that the analysis identifies the districts at the bottom of the distribution in each year without presupposing a fixed level below which access is inadequate. These choices are transparent and could be varied in a sensitivity analysis, but the substantive conclusions are unlikely to depend on them because the underlying gradient is continuous and positive rather than a threshold effect.
RESULTS
Activity per population declined and recovered only partially
Across 287 local authority districts, mean dental activity was 1,370.5 UDA per 1000 population in 2019/20, with a standard deviation of 212.1 and a median of 1374.4, indicating a relatively tight distribution around a central value of roughly 1370 per 1000 (Table 1). Activity collapsed in the first pandemic year to 425.0 per 1000 in 2020/21, a fall of more than two thirds, and the standard deviation contracted to 62.1 as virtually all districts converged on a uniformly depressed level. Activity then recovered to 998.3 per 1000 in 2021/22 and 1203.9 per 1000 in 2022/23, reaching 1,245.5 per 1000 in 2023/24, which remained −9.1% below the pre-pandemic level (Table 1; Figure 1).
The mean change between 2019/20 and 2023/24 was −125.0 UDA per 1000 (SD 154.8), and the widening standard deviation across the recovery years shows that districts diverged again as the system reopened, with some returning close to their previous level and others lagging. The change was negative for the great majority of districts, indicating that the shortfall relative to 2019/20 was widespread rather than confined to a few areas, but its magnitude ranged widely, so the recovery burden was unevenly shared.
The districts that had the highest activity before the pandemic were not systematically the ones that lost the most, and the post-pandemic ranking of districts by activity remained broadly similar to the pre-pandemic ranking, which is why persistent low activity, rather than a single-year snapshot, is the more meaningful object of analysis. The median followed the mean closely in every year, confirming that the trend was not driven by a small number of extreme districts but reflected a shift in the whole distribution.
Financial year | Mean | SD | Median |
|---|---|---|---|
2019/2020 | 1,370.5 | 212.1 | 1374.4 |
2020/2021 | 425.0 | 62.1 | 421.8 |
2021/2022 | 998.3 | 159.7 | 991.3 |
2022/2023 | 1203.9 | 228.7 | 1206.1 |
2023/2024 | 1,245.5 | 247.3 | 1251.7 |
Note: UDA = units of dental activity delivered by patient location. SD = standard deviation. Source: NHSBSA dental statistics and ONS mid-2021 population estimates.

Figure 1. Mean units of dental activity per 1000 population by financial year.
Note: Error bars show one standard deviation. Source: Own elaboration from NHSBSA dental statistics and ONS population estimates.Persistent low activity was concentrated in less deprived districts
Activity per 1000 population correlated positively with deprivation (r = 0.42), meaning more deprived districts delivered more NHS activity per resident, and this relationship held in every financial year (Figure 2). A correlation of this magnitude indicates that deprivation explains roughly one sixth of the variance in district activity, a moderate but real gradient.
The correlation was stable rather than driven by a few outliers, and the scatter in the figure shows that districts at the affluent end of the deprivation scale had the lowest activity, while the most deprived districts had among the highest.
Using the definition of persistent low activity as activity in the lowest quintile in at least four of the five years, 40 districts met the criterion and the remaining 247 did not. The persistently low-activity districts were less deprived on average than the remainder (mean IMD score 16.5 versus 20.4) and had smaller populations (mean 151,027 versus 188,984) (Table 2).
Their mean activity in 2023/24 was 871.8 per 1000 compared with 1,306.0 per 1000 among other districts, a gap that had widened relative to the pre-pandemic year, indicating that the districts with low activity in 2019/20 remained low and fell further behind.
Group | Districts (n) | Mean IMD score | Mean population | Mean rate 2023/24 |
|---|---|---|---|---|
Persistent low activity | 40 | 16.5 | 151,027 | 871.8 |
Other districts | 247 | 20.4 | 188,984 | 1,306.0 |
Note: IMD = Index of Multiple Deprivation; a higher average score indicates greater deprivation. Persistent low activity is defined as activity per 1000 population in the lowest quintile in at least four of five financial years.
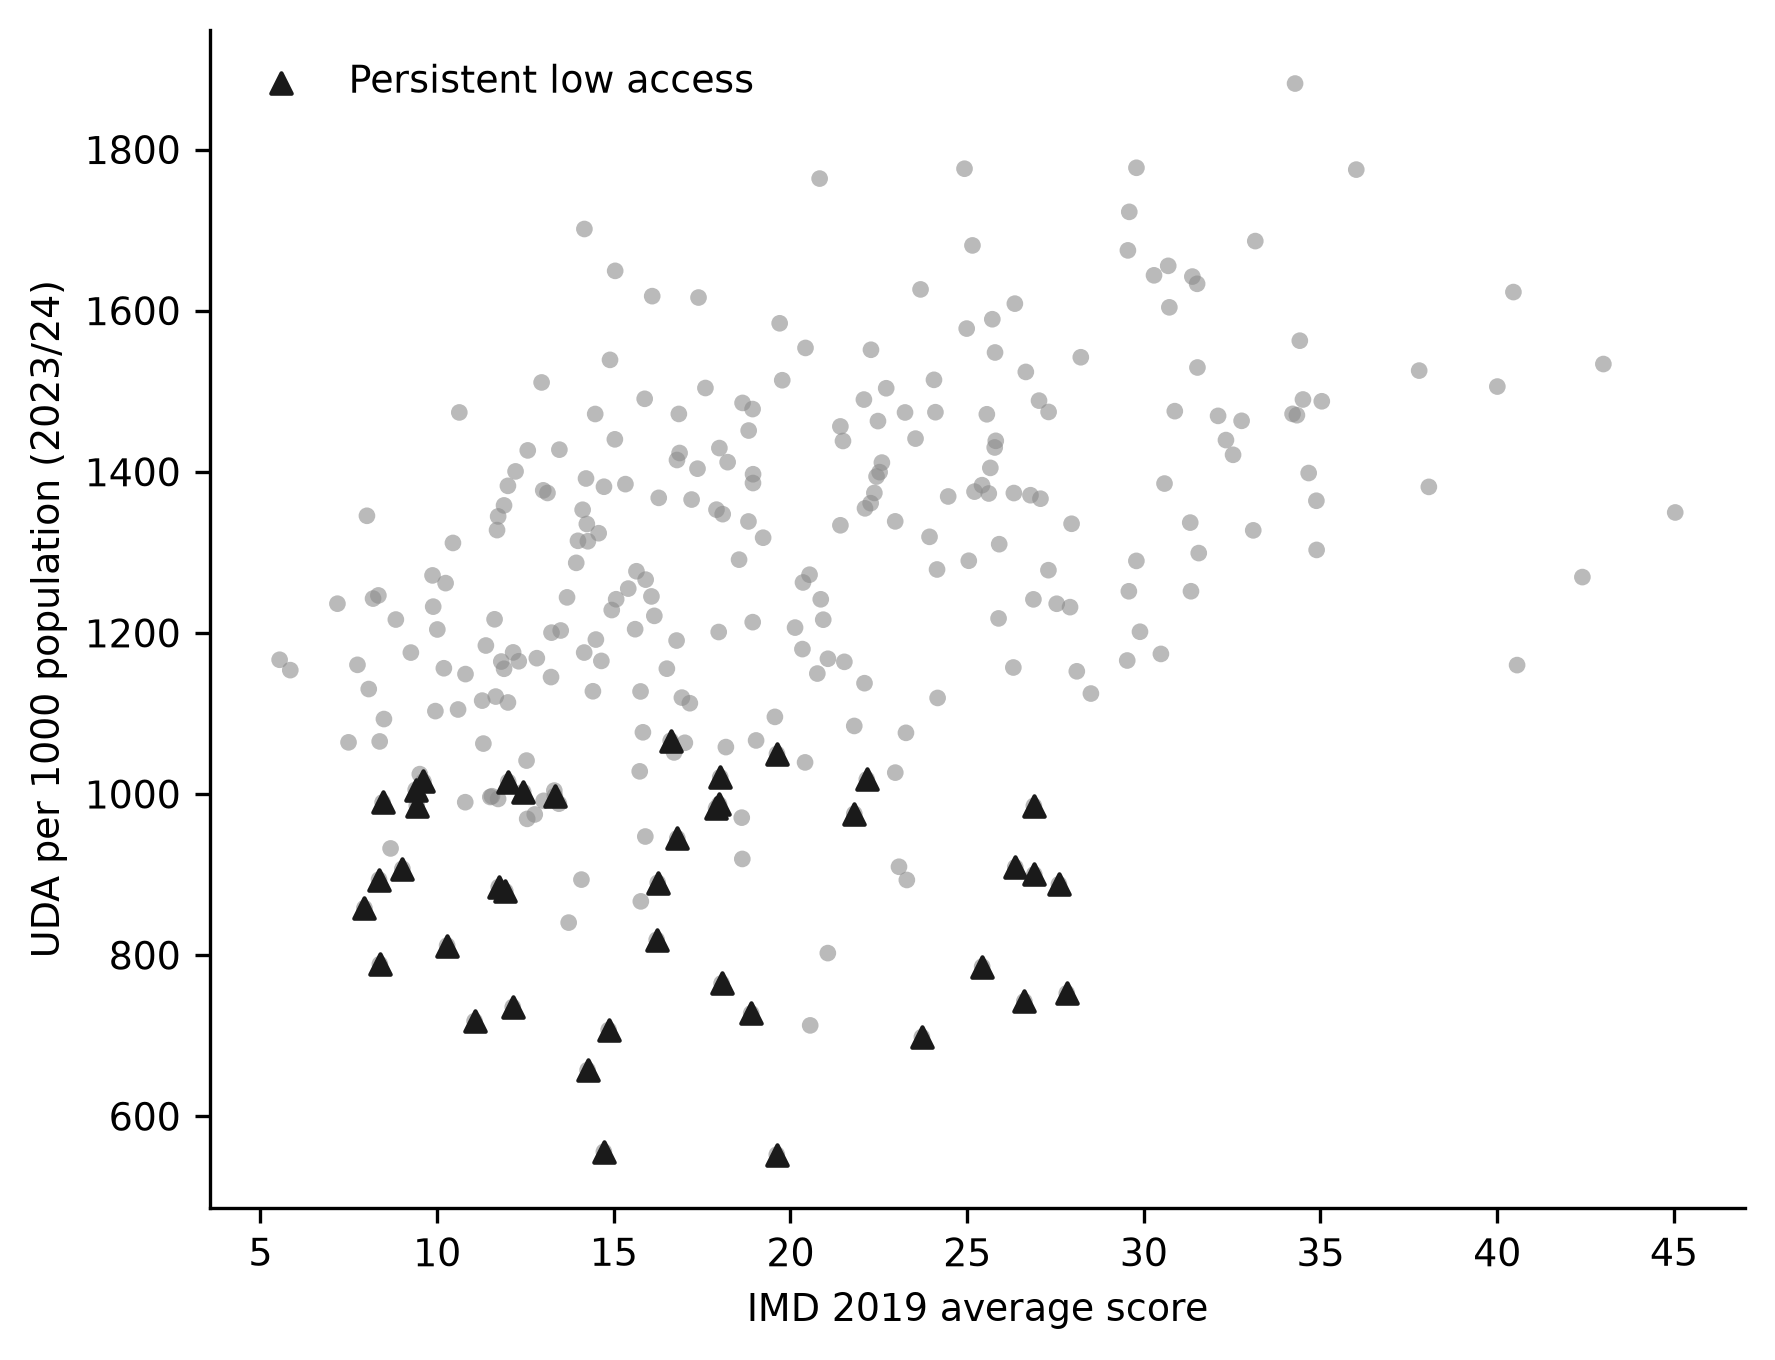
Figure 2. Deprivation and dental activity per 1000 population in 2023/24.
Note: Triangles mark districts with persistent low activity. IMD = Index of Multiple Deprivation; higher score indicates greater deprivation.Area characteristics predicted persistent low activity only modestly
Gradient boosting and logistic regression predicted persistent low activity with cross-validated area under the curve of 0.54 and 0.61, respectively (Table 3). Accuracy was high only because the low-activity class was a minority of the sample; with F1 scores of 0.000 and 0.069 for the minority class, the models almost never identified low-activity districts correctly.
Model | AUC | Accuracy | F1 |
|---|---|---|---|
Logistic regression | 0.61 | 0.861 | 0.000 |
Gradient boosting | 0.54 | 0.819 | 0.069 |
Note: AUC = area under the receiver operating characteristic curve (five-fold cross-validation); F1 = harmonic mean of precision and recall for the low-activity class.
The two models performed similarly, indicating that the weak discrimination was a property of the predictors rather than of the choice of algorithm. In permutation importance, deprivation was the leading predictor (0.195), followed by population size (0.132), while the concentration of deprivation contributed little (0.031) (Table 4).
Deprivation's importance of 0.195 in absolute terms is small, which is consistent with the modest area under the curve and confirms that the three area characteristics, while associated with activity in aggregate, are individually weak discriminators.
Predictor | Importance |
|---|---|
IMD average score | 0.195 |
Population | 0.132 |
Deprived areas (most deprived 10%) | 0.031 |
Note: Importance is the mean decrease in area under the receiver operating characteristic curve after permuting each predictor (10 repeats). IMD = Index of Multiple Deprivation.
DISCUSSION
The first finding is that NHS dental activity per population collapsed during the pandemic and recovered only partially. Activity fell by −125 per 1000 between 2019/20 and 2023/24, driven by an acute drop in 2020/21 and a recovery that stalled roughly −9 percent below the pre-pandemic level. This mirrors national and regional reports that documented a sharp fall in realised access during the pandemic and a recovery that did not return activity to earlier levels.(1-3)
The persistence of the shortfall into 2023/24 indicates that the pandemic did not merely interrupt care but may have accelerated a structural contraction in NHS dentistry, a concern raised in commentary on the post-pandemic recovery.(4)
The Scotland experience is instructive here, because Scottish data likewise showed that access fell during the pandemic and that the fall was uneven across socioeconomic groups, which suggests the contraction is not specific to the English commissioning model.(24)
The second finding is that activity per population is pro-poor in its geographic distribution. More deprived districts delivered more NHS activity per resident, and the districts with persistently low activity were less deprived and smaller than the remainder. This is consistent with the inverse dental care law, in which deprived populations depend on NHS services while more affluent populations substitute private care.(8,9)
It also agrees with neighbourhood-level analyses showing that spatial disparities in NHS dentistry reflect the distribution of the workforce and of private alternatives rather than a simple shortage in deprived areas.(10,13)
The result cautions against equating low NHS activity with an access desert: at the district level, low NHS activity is more often a marker of private substitution than of unmet need among the deprived, and the concentration of NHS orthodontic activity in deprived areas in England points in the same direction.(25)
Older people and other groups who rely on NHS care face the inverse problem, in which high need coexists with barriers to attendance.(26,27) Comparative work on dental coverage for older adults across eight countries shows that England's largely out-of-pocket adult dental care sits alongside public systems that fund care for younger age groups, a design that concentrates financial barriers precisely among the older population with the greatest accumulated need.(28)
The pro-poor gradient should not be read as evidence that access is adequate in deprived areas. Area-level activity measures count treatment delivered, and a high level of NHS activity in a deprived district can coexist with substantial unmet need, because need rises faster than supply. Studies of homeless and otherwise marginalised populations document persistent barriers to entering NHS dentistry even where services exist, including registration, cost, and competing priorities.(29)
Urgent dental care pathways in England similarly show repeated attendance concentrated in deprived populations, a pattern consistent with unmet routine need surfacing as emergency demand.(30) The geographic gradient observed here is therefore best understood as the footprint of who uses NHS care, not as a map of who needs it.
The pro-poor gradient in NHS activity is consistent with the inverse care law as classically formulated, but its interpretation requires care. The law predicts that the availability of good medical care varies inversely with the need of the population served; in dentistry the gradient runs in the opposite direction for NHS activity precisely because private care serves as an escape valve for the affluent.(8)
An area-level analysis that sees only NHS activity would conclude that deprived populations are well served, when in fact the level of need is far higher than the activity delivered. The finding that persistently low NHS activity is associated with affluence, not deprivation, therefore reflects the dual structure of English dentistry rather than an absence of inequality. This dual structure is a long-standing feature of the English system, in which dental care sits outside the universal coverage that applies to most other NHS services, and it explains why dental access repeatedly appears as an outlier in comparisons of health care equity.(9)
The incomplete recovery of dental activity also contrasts with the recovery of other NHS services. Medical general practice and hospital care returned to or above pre-pandemic volumes more quickly, whereas dentistry, which was subject to the longest suspension of routine care, lagged behind.
This divergence reflects both the aerosol-generating nature of dental procedures, which justified early and prolonged infection-control restrictions, and the deeper fragility of a service whose funding and workforce were already under strain before 2020.(1,2)
The persistence of the shortfall into the third year after the acute disruption suggests that the pandemic converted a chronic problem into an acute and visible one rather than creating it anew. Whether the shortfall represents a permanent contraction or a slow recovery that will eventually close the gap cannot be settled from five years of data, but the direction of travel in the most recent year, in which activity remained below baseline, argues against a rapid return to the status quo.
The third finding is that area characteristics predict persistent low activity only modestly. Deprivation and population size together yielded a cross-validated area under the curve of roughly 0.54 to 0.61, and the models rarely identified low-activity districts correctly. An area under the curve of this magnitude is close to chance, so the models offer little discriminatory value beyond what could be achieved by knowing the overall prevalence of low activity.
The weak predictive power is itself informative: persistent low NHS activity is not tightly determined by the deprivation and size characteristics available here, and other factors such as workforce supply, practice ownership, and commissioning decisions are likely to dominate.(21,31) The use of machine learning with cross-validation prevented the over-optimistic performance that an in-sample fit would have suggested, and the permutation ranking confirmed that deprivation, not population or the concentration of deprived neighbourhoods, carries most of the available signal.(18)
This is consistent with broader applications of machine learning to social determinants and small-area estimation, which emphasise that the value of such models lies as much in what they fail to predict as in what they predict.(19,32) Prior work predicting area vulnerability from social determinants in the United States and measuring health inequalities from imagery has shown that deprivation can be a strong predictor of some outcomes and a weak predictor of others, depending on whether the outcome is shaped directly by material conditions or by service organisation.(33,34)
Dental activity belongs to the second category, because it is mediated by commissioning and workforce decisions that are not captured by census-derived deprivation measures. The contribution of the machine learning step is therefore less to build a deployable targeting tool than to demonstrate, with a defensible out-of-sample estimate, how much of the geographic pattern deprivation can and cannot account for on its own.
The modest model performance also has a practical implication for how such models should be built and reported. An in-sample fit on the same districts would have suggested near-perfect discrimination, because the low-activity class is defined by the very activity that the predictors partially track. Reporting only in-sample performance would therefore overstate the utility of deprivation-based targeting. The cross-validated estimate, by contrast, shows that deprivation alone is not sufficient to identify districts that will remain under-served, and that commissioning data on contracts and workforce are the more natural inputs for a targeting model.(17,21)
This is a specific instance of a general lesson in machine learning for health services research, namely that the choice of validation strategy is not a technical afterthought but the step that determines whether a model's apparent accuracy reflects a real relationship or an artefact of how the outcome was defined.
These results also sharpen the meaning of the term dental desert, which has been used loosely to describe areas with poor access. A desert defined by low NHS activity per population turns out to be a different entity from a desert defined by unmet need among deprived residents: the former is associated with affluence and private substitution, the latter with deprivation. Systematic reviews of geographic barriers to dental care have emphasised that the workforce shortfall and the unmet need it produces are distinct problems that require distinct remedies, and the present findings provide empirical support for keeping them separate.(21)
A policy that maps deserts by activity alone would misdirect resources toward affluent areas with private alternatives and away from deprived areas where NHS activity is high but unmet need persists. This distinction is directly relevant to the current policy debate, in which calls to improve NHS dental access are sometimes framed around the number of NHS dentists per head in an area; the present results show that the volume of NHS treatment per resident is highest where deprivation is highest, so a workforce measure and an activity measure would point policy in opposite directions.
The strengths of the study include its use of complete, nationally comprehensive administrative data on dental activity, its longitudinal window that brackets the pandemic, and its transparent distinction between description and prediction through cross-validation. By reporting out-of-fold rather than in-sample performance, the analysis avoids overstating how well area characteristics can identify persistently low-activity districts.
Study Limitations:
The study has limitations:
Activity per population is a proxy for access and conflates need, uptake, and supply; it cannot distinguish a district where residents use private care from one where they cannot obtain NHS care.
The population denominator is held fixed at mid-2021, so population change after 2021 is not reflected, which could distort rates for districts with rapid growth.
The ecological design describes districts rather than individuals and cannot separate compositional from contextual effects, a limitation shared with ecological analyses of dental outcomes.(35)
Local authority boundaries changed during the period and districts with missing data were excluded, so the sample of 287 districts does not cover all of England and the excluded districts may differ systematically from those analysed.
The predictors were limited to deprivation and population, and the omission of workforce and commissioning measures likely explains the modest model performance. Sixth, the binary threshold that defines persistent low activity is a simplification of a continuous gradient, and a different threshold would yield a different but overlapping set of districts.
Each of these limitations points to a specific improvement: linkage of activity to practice supply and waiting data, time-varying population denominators, multilevel individual data, and inclusion of workforce indicators.
Practical implications:
For policy, the findings support two conclusions. Monitoring dental activity per population should be interpreted alongside deprivation, because low activity in affluent areas signals private substitution rather than access failure, while high activity in deprived areas may coexist with high unmet need. And because the pandemic shortfall persisted, any assessment of recovery should measure activity against the pre-pandemic baseline rather than against the depressed pandemic-year figures. The findings also underscore the value of publicly available dental administrative datasets, whose routine publication makes the kind of area-level monitoring reported here reproducible at low cost and feasible for routine commissioning intelligence.(20)
The approach generalises beyond England. Any country that publishes small-area health activity and census indicators could reproduce the analysis, and the central methodological point, that activity-based measures must be interpreted against the structure of public and private provision, applies wherever dental care is delivered through a mixed funding system.(11,28) The pro-poor gradient itself is a general feature of need-based public services rather than a peculiarity of dentistry, so the interpretive caution applies to any activity measure used as a proxy for access in a mixed system. Future work should combine activity data with workforce, contract, and waiting-list information so that the three components of access, availability, uptake, and delivery, can be modelled jointly rather than conflated in a single volume indicator.
The results also carry a lesson for the routine monitoring of dental access. Because the relationship between activity and deprivation flips depending on whether one examines NHS activity or total (public and private) activity, dashboards and public-facing statistics should report the measure they are actually able to compute and state its limits. A statistic presented as a measure of access but computed only from NHS activity will systematically understate the burden in deprived areas and overstate it in affluent ones. The distinction matters for accountability, because commissioners held to a target based on NHS activity will be rewarded for the wrong geographic pattern unless the measure is explicitly framed as NHS-delivered treatment rather than population access.
The weakness of deprivation as a predictor of persistent low activity points to the information that would be needed to build a better targeting model. Workforce data, including the number and distribution of dentists and dental therapists, and contract data describing the value and terms of NHS contracts in each area, are the natural complements to the deprivation measures used here.(14,21) A model that combined these sources could, in principle, separate the districts where low activity reflects a genuine shortage of supply from those where it reflects low uptake among an affluent population, which is precisely the distinction that activity data alone cannot make.
CONCLUSIONS
National Health Service dental activity per population collapsed during the pandemic and recovered only partially by 2023/24, leaving a substantial shortfall against the pre-pandemic baseline that persisted across the whole country and across all levels of deprivation. The geographic distribution of activity was pro-poor, with persistent low activity concentrated in less deprived districts, which indicates that low NHS activity at the district level often reflects private substitution rather than genuine access failure among those in need. Area characteristics predicted persistent low activity only modestly, so deprivation alone does not identify access deserts, and workforce and commissioning data are needed to characterise them. Any policy that maps access using NHS activity alone risks misdirecting resources, because the activity footprint and the burden of unmet need point in opposite directions across the deprivation gradient.
References
- 1 O´Connor R, Landes D, Harris R. Trends and inequalities in realised access to NHS primary care dental services in England before, during and throughout recovery from the COVID-19 pandemic. Br Dent J. 2023. doi: 10.1038/s41415-023-6032-1
- 2 Stennett M, Tsakos G. The impact of the COVID-19 pandemic on oral health inequalities and access to oral healthcare in England. Br Dent J. 2022;232(2):109-114. doi: 10.1038/s41415-021-3718-0
- 3 Hafesji A, Burns L. Waiting in line for a check-up: evaluating access to NHS dental services in England. Br Dent J. 2025. doi: 10.1038/s41415-025-8320-4
- 4 Beeson MJ, Vernazza CR, Sowden SL. At the Deep End of dental inequality. Br Dent J. 2025;239(3):209-213. doi: 10.1038/s41415-025-8503-z
- 5 Lang IA, Gibbs SJ, Steel N, Melzer D. Neighbourhood deprivation and dental service use: a cross-sectional analysis of older people in England. Journal of Public Health. 2008;30(4):472-478. doi: 10.1093/pubmed/fdn047
- 6 Tchicaya A, Lorentz N. Socioeconomic inequalities in the non-use of dental care in Europe. Int J Equity Health. 2014;13(1):7. doi: 10.1186/1475-9276-13-7
- 7 McKenzie KW, Goodwin M, Pretty I. NHS dental service utilisation and social deprivation in older adults in North West England. Br Dent J. 2017;223(2):102-107. doi: 10.1038/sj.bdj.2017.624
- 8 Jones CM, Clouting D, McCartney G. Socio-economic status of patients registered with NHS dental services in Scotland: an inverse 'dental' care law?. Br Dent J. 2013;214(5):E14-E14. doi: 10.1038/sj.bdj.2013.223
- 9 Cookson R, Propper C, Asaria M, Raine R. Socio‐Economic Inequalities in Health Care in England. Fiscal Studies. 2016;37(3-4):371-403. doi: 10.1111/j.1475-5890.2016.12109
- 10 Clark SD. Spatial disparities in access to NHS dentistry: a neighbourhood-level analysis in England. European Journal of Public Health. 2024;34(5):854-859. doi: 10.1093/eurpub/ckae099
- 11 Monteiro CN, Beenackers MA, Goldbaum M, de Azevedo Barros MB, Gianini RJ, Cesar CLG, et al. Socioeconomic inequalities in dental health services in Sao Paulo, Brazil, 2003–2008. BMC Health Serv Res. 2016;16(1):683. doi: 10.1186/s12913-016-1928-y
- 12 Stennett M, Venturelli R, Makhani S, Jones K, Watt RG, Heilmann A, et al. Ethnic inequalities in oral health within the United Kingdom: a scoping review. Br Dent J. 2025. doi: 10.1038/s41415-025-8876-z
- 13 Moles DR, Frost C, Grundy C. Inequalities in availability of National Health Service general dental practitioners in England and Wales. Br Dent J. 2001;190(10):548-553. doi: 10.1038/sj.bdj.4801032
- 14 Godson JH, Williams SA, Csikar JI, Bradley S, Rowbotham JS. Dental therapy in the United Kingdom: part 2. A survey of reported working practices. Br Dent J. 2009;207(9):417-423. doi: 10.1038/sj.bdj.2009.962
- 15 Tu RY, Liang P, Tan AJ, Tran DHG, He AM, Je H, et al. Factors associated with regular dental attendance by aged adults: A systematic review. Gerodontology. 2023;40(3):277-287. doi: 10.1111/ger.12661
- 16 Wang X, Bernabe E, Pitts N, Zheng S, Gallagher JE. Dental caries thresholds among adolescents in England, Wales, and Northern Ireland, 2013 at 12, and 15 years: implications for epidemiology and clinical care. BMC Oral Health. 2021;21(1):137. doi: 10.1186/s12903-021-01507-1
- 17 Clark S. The contract between NHS dentistry and communities and how this varies by neighbourhood types. Br Dent J. 2024. doi: 10.1038/s41415-024-7520-7
- 18 Mhasawade V, Zhao Y, Chunara R. Machine learning and algorithmic fairness in public and population health. Nat Mach Intell. 2021;3(8):659-666. doi: 10.1038/s42256-021-00373-4
- 19 Viljanen M, Meijerink L, Zwakhals L, van de Kassteele J. A machine learning approach to small area estimation: predicting the health, housing and well-being of the population of Netherlands. Int J Health Geogr. 2022;21(1):4. doi: 10.1186/s12942-022-00304-5
- 20 Moore D, Nyakutsikwa B, Allen T, Lam E, Birch S, Tickle M, et al. Effect of fluoridated water on invasive NHS dental treatments for adults: the LOTUS retrospective cohort study and economic evaluation. Public Health Research. 2024;12(5):1-147. doi: 10.3310/rfqa3841
- 21 Edwards JW, Bogale B, Gallagher JE. Tackling geographic barriers to primary dental care (dental deserts): a systematic review. Br Dent J. 2025. doi: 10.1038/s41415-025-8487-8
- 22 NHS Business Services Authority. NHS Dental Statistics England: geographic patient location activity 2019/20 to 2023/24 [Internet]. 2025. Available from: https://opendata.nhsbsa.net/dataset/dental-official-statistics
- 23 Ministry of Housing, Communities and Local Government. English Indices of Deprivation 2019: local authority district summaries (File 10) [Internet]. 2019. Available from: https://www.gov.uk/government/statistics/english-indices-of-deprivation-2019
- 24 Aminu AQ, McMahon AD, Clark C, Sherriff A, Buchanan C, Watling C, et al. Inequalities in access to NHS primary care dental services in Scotland during the COVID-19 pandemic. Br Dent J. 2023. doi: 10.1038/s41415-023-5856-z
- 25 Al-Hammadi Z, Ravaghi V, Hill K, Morris AJ. Area-level inequalities in the provision of NHS orthodontic care in England from 2016 to 2019. Br Dent J. 2023. doi: 10.1038/s41415-023-6273-z
- 26 Borreani E, Wright D, Scambler S, Gallagher JE. Minimising barriers to dental care in older people. BMC Oral Health. 2008;8(1):7. doi: 10.1186/1472-6831-8-7
- 27 Walls AWG, Steele JG. Geriatric oral health issues in the United Kingdom. International Dental Journal. 2001;51(3 Suppl):183-187. doi: 10.1002/j.1875-595x.2001.tb00865.x
- 28 Allin S, Farmer J, Quiñonez C, Peckham A, Marchildon G, Panteli D, et al. Do health systems cover the mouth? Comparing dental care coverage for older adults in eight jurisdictions. Health Policy. 2020;124(9):998-1007. doi: 10.1016/j.healthpol.2020.06.015
- 29 Paisi M, Kay E, Plessas A, Burns L, Quinn C, Brennan N, et al. Barriers and enablers to accessing dental services for people experiencing homelessness: A systematic review. Comm Dent Oral Epid. 2019;47(2):103-111. doi: 10.1111/cdoe.12444
- 30 Currie C, Stone S, Pearce M, Landes D, Durham J. Urgent dental care use in the North East and Cumbria: predicting repeat attendance. Br Dent J. 2022;232(3):164-171. doi: 10.1038/s41415-022-3886-6
- 31 Turnbull J, MacLellan J, Churruca K, Ellis LA, Prichard J, Browne D, et al. A multimethod study of NHS 111 online. Health Soc Care Deliv Res. 2023;11(5):1-104. doi: 10.3310/ytrr9821
- 32 Kino S, Hsu YT, Shiba K, Chien YS, Mita C, Kawachi I, et al. A scoping review on the use of machine learning in research on social determinants of health: Trends and research prospects. SSM - Population Health. 2021;15:100836. doi: 10.1016/j.ssmph.2021.100836
- 33 Mehta M, Julaiti J, Griffin P, Kumara S. Early Stage Machine Learning–Based Prediction of US County Vulnerability to the COVID-19 Pandemic: Machine Learning Approach. JMIR Public Health Surveill. 2020;6(3):e19446. doi: 10.2196/19446
- 34 Suel E, Polak JW, Bennett JE, Ezzati M. Measuring social, environmental and health inequalities using deep learning and street imagery. Sci Rep. 2019;9(1):6229. doi: 10.1038/s41598-019-42036-w
- 35 Ravaghi V, Rezaee A, Pallan M, Morris AJ. Childhood obesity and dental caries: an ecological investigation of the shape and moderators of the association. BMC Oral Health. 2020;20(1):338. doi: 10.1186/s12903-020-01329-7
Declarations
Funding
No financing
Conflict of interest
None
Authorship contributions
Drafting – original draft: Jane E Wainwright.
Writing–review and editing: Jane E Wainwright.