

Abstract
Introduction: Complete tooth loss reflects a lifetime of accumulated oral disease and concentrates among socially disadvantaged older adults, yet county-level evidence on the determinants that best predict its geographic distribution is limited. Methods: Ecological cross-sectional study of 2,946 United States counties combining model-based prevalence of complete tooth loss among adults aged 65 years or older from CDC PLACES with American Community Survey 2017-2021 social determinant measures. A linear ridge regression and a gradient-boosted model were compared with random five-fold and spatial block cross-validation; permutation importance and partial dependence described the contributions of each predictor. Results: Mean complete tooth loss prevalence was 15.6% (SD 5.7). Each standard deviation increase in county poverty was associated with 1.77 percentage points higher prevalence (95% CI 1.52 to 2.02) and each standard deviation increase in low educational attainment with 0.67 percentage points (95% CI 0.46 to 0.88) after adjustment. Under random cross-validation the two models performed similarly (R-squared 0.72 versus 0.72), whereas under spatial cross-validation the gradient-boosted model retained an R-squared of 0.53 compared with 0.34 for the linear model. Poverty was the leading social determinant by permutation importance (0.162). Conclusions: County socioeconomic deprivation independently predicts complete tooth loss in older adults, and machine learning predictions transfer better across space than linear models. Spatial cross-validation should be routine when small-area models are intended to guide resource allocation.
Keywords
tooth loss, edentulism, social determinants of health, machine learning, small-area analysis, aged
INTRODUCTION
Complete tooth loss, the loss of all natural teeth, is the end stage of untreated caries and periodontal disease and remains common among older adults despite decades of improvement in high-income countries. Worldwide, edentulism affects a substantial share of adults aged 60 years and over, with prevalence that varies more than fourfold across regions and that persists as a marker of accumulated oral disadvantage.(1) Estimates from the Global Burden of Disease study document a large and only slowly declining global burden, concentrated among women and older age groups, and national analyses in China and elsewhere confirm that edentulism remains a durable public health problem even as overall oral health improves.(2,3) In the United States, the prevalence of edentulism declined steadily through the twentieth century, but the decline has been uneven, leaving large geographic and social gaps between the groups that retained their teeth and those that did not.(4-6) Complete tooth loss carries functional and systemic consequences, including impaired chewing, dietary restriction, and associations with cognitive decline, frailty, and cardiovascular and all-cause mortality, so its distribution is a tractable target for population surveillance.(7-10) With the rapid aging of populations worldwide, the absolute number of older adults who retain no teeth will keep rising for some time even where prevalence is falling, which keeps the geographic monitoring of edentulism relevant to planning for prosthodontic and supportive care.
The social gradient of tooth loss is among the strongest and most replicated findings in oral epidemiology. Individual-level studies consistently find that income, education, race and ethnicity, and rural residence predict both the number of teeth retained and the odds of becoming edentulous.(11,12) Because complete tooth loss is the accumulated endpoint of a lifetime of disease and treatment decisions, it is a particularly informative outcome for studying how social position shapes oral health, in contrast to point-in-time measures such as untreated caries. These associations are not only compositional; area-level deprivation predicts edentulism above and beyond individual characteristics, as shown in county and census-tract analyses in the United States.(13,14) Comparable geographic gradients in socioeconomic inequality and oral outcomes have been reported across European, Latin American, and Asian settings, indicating that the relationship between place-based disadvantage and tooth loss is not specific to a single health system.(15-17) Decomposition studies further suggest that socioeconomic position, rather than behavioral differences alone, accounts for a large share of the racial and ethnic inequities in oral health.(18) Because public health and social services are planned and funded at the county and subcounty level, understanding the county-level correlates of edentulism is directly actionable for targeting programs where the need is greatest.
Recent advances in small-area estimation and machine learning now make it possible to model the geographic distribution of a condition directly and to interrogate which determinants matter most for prediction. The CDC PLACES project publishes model-based county estimates of chronic disease, health behaviors, and health-related social needs that support local planning without new survey collection.(19,20) Machine learning methods, particularly tree ensembles, have been applied to public health and geriatric problems to capture non-linear and interacting relationships, and explainability tools such as permutation importance and partial dependence make these models auditable for decision makers.(21-23) The appeal of these tools for oral health is that they can be fitted to existing routine data and updated as new small-area estimates are released, rather than requiring new and costly surveys. What remains unclear is whether such models trained on small-area data generalize across space, since random cross-validation can inflate apparent performance when units are spatially autocorrelated.( 24-26)
This study addresses that gap for complete tooth loss among older adults. Prior county-level models of edentulism have not, to our knowledge, combined model-agnostic explainability with spatially grouped validation, so the transferability of such models beyond the counties on which they were trained remains unestablished. The objective was to identify the social determinants that best predict county-level prevalence of complete tooth loss among adults aged 65 years and over and to assess the stability of machine learning predictions under spatial cross-validation. Three hypotheses were tested: H1, county poverty and low educational attainment are positively associated with complete tooth loss prevalence independent of age structure and dental care access; H2, gradient boosting predicts complete tooth loss prevalence more accurately than a linear ridge model; and H3, the gradient-boosting advantage and the ranking of social determinants persist under spatial cross-validation.
METHODS
Design and data sources
This was an ecological cross-sectional study at the county level in the United States. The outcome and health covariates were obtained from the CDC PLACES 2025 release, which provides model-based, small-area prevalence estimates for all counties and county equivalents using multilevel regression and poststratification of Behavioral Risk Factor Surveillance System data.(19,27) The outcome was the crude prevalence of complete tooth loss among adults aged 65 years or older (measure TEETHLOST, expressed as a percentage). Health covariates from the same source were the prevalence of a dental visit in the past year (DENTAL), lack of health insurance among adults aged 18 to 64 years (ACCESS2), current cigarette smoking (CSMOKING), diagnosed diabetes (DIABETES), and fair or poor self-rated health (GHLTH). Social determinants were obtained from the CDC Non-Medical Factor Measures for counties, which are derived from the American Community Survey (ACS) 2017-2021 five-year estimates: the percentage of the population living below 150 percent of the federal poverty level (POV150), adults aged 25 years or older without a high school diploma (NOHSDP), unemployment among adults 16 years and older in the labor force (UNEMP), single-parent households (SNGPNT), persons of racial or ethnic minority status (REMNRTY), crowding among housing units (CROWD), households without broadband internet (BROAD), housing cost burden (HCOST), and persons aged 65 years or older (AGE65).(28) Both sources are published by the Centers for Disease Control and Prevention under open public data terms and require no registration to download. Within the PLACES 2025 release, the dental measures (complete tooth loss and dental visit) are based on survey data through 2022, while the remaining health covariates reflect data through 2023; both are the most recent available for their respective measures. Because the ACS indicators are five-year estimates, they smooth year-to-year fluctuation and carry margins of error that are largest for the least populous counties; this measurement imprecision is a source of attenuation toward the null for the association estimates.
Variables and hypothesis operationalization
The unit of analysis was the county. The outcome and every predictor were expressed as percentages of the relevant population. The nine social determinant measures were chosen because they correspond to the widely used components of area-level social vulnerability: socioeconomic status (poverty, low education, unemployment), household composition (single-parent households, crowding), minority status and language, housing and transportation, and the age structure of the population. The five PLACES health covariates were included to test whether the association of deprivation with tooth loss persists once behaviors and access are held constant. For H1, the exposures were POV150 and NOHSDP, the outcome was TEETHLOST, and the statistical test was an ordinary least squares regression of complete tooth loss prevalence on all standardized predictors, with the criterion that H1 was supported if the 95% confidence interval of each standardized coefficient excluded zero at a two-sided significance level of 0.05. For H2, the measure was out-of-sample R-squared, and H2 was supported if the gradient-boosted model achieved a higher mean R-squared than the ridge baseline under random five-fold cross-validation. For H3, the measure was the change in R-squared between random and spatial cross-validation together with the permutation ranking of the social determinants, and H3 was supported if the gradient-boosted model degraded less than the ridge model and if poverty and low educational attainment remained among the leading predictors.
Data processing
The PLACES and ACS measures were downloaded as tabular records from the CDC open data portal and reshaped from long to wide format so that each county contributed one row. Only the crude prevalence value type was retained for the PLACES measures to avoid duplicate age-adjusted rows. Counties were matched across sources by their five-digit Federal Information Processing Standards code. The geolocation field of each record provided the county centroid coordinates used to construct spatial blocks. Counties missing the outcome, any predictor, or coordinates were excluded, and the number excluded was recorded.
Statistical analysis
All analyses were conducted in Python 3.13 with scikit-learn 1.9, pandas, NumPy, SciPy, and statsmodels. Descriptive statistics were computed as mean and standard deviation or median and range according to distribution. The unadjusted association between each social determinant and complete tooth loss was quantified with the Pearson correlation coefficient. The independent associations were estimated with an ordinary least squares regression of complete tooth loss prevalence on all fourteen standardized predictors, so that each coefficient is interpreted as the change in percentage points of tooth loss per one standard deviation increase in the predictor.
Two predictive models were compared to represent the ends of the flexibility spectrum. The baseline was a ridge regression with standardized predictors and default regularization, a linear model that shrinks coefficients and serves as a transparent reference. The main model was a gradient-boosting regression ensemble of 500 shallow trees with a learning rate of 0.05 and subsampling, a configuration chosen to limit overfitting while retaining the capacity to represent non-linear and interacting effects; tree depth was kept small so that the model remained interpretable through its feature importances. Gradient boosting was preferred over a random forest because its additive structure yields permutation importances and partial dependence that are stable under repeated fitting, which matters when the model is used to communicate determinants to non-specialist audiences. Both models were evaluated with two cross-validation schemes. Random cross-validation used five shuffled folds, which treats counties as exchangeable and estimates performance when the test units are drawn from the same population as the training units. Spatial cross-validation first partitioned counties into ten contiguous blocks by k-means clustering of county centroid coordinates and then used grouped folds so that counties from the same spatial block were never split between training and test sets; this design prevents leakage between neighboring units and mimics prediction for unseen areas.(29-31) A leave-one-state-out scheme was run as an additional sensitivity analysis, because state boundaries are a natural administrative partition that could plausibly correspond to differences in dental coverage policy. Performance was summarized with the coefficient of determination (R-squared), root mean square error, and mean absolute error, all computed on out-of-fold predictions.
Model explainability was assessed with model-agnostic methods. Permutation importance quantified the mean decrease in R-squared after randomly permuting each predictor across ten repeats, and partial dependence described the expected change in predicted prevalence across the observed range of the two leading social determinants.(21,23) A fixed random seed was set for every stochastic step, including the cross-validation fold assignment, the spatial clustering, and the gradient boosting ensemble, so that rerunning the analysis reproduces the reported numbers exactly. Because the data are aggregated, anonymized, and publicly available, this analysis did not involve human subjects.
RESULTS
Study units
After excluding counties with incomplete data, 2,946 counties and county equivalents across 48 states remained for analysis (197 were excluded for missing at least one variable). The mean prevalence of complete tooth loss among adults aged 65 years or older was 15.6% (SD 5.7), ranging from 3.8% to 44.4% across counties (Table 1). The distribution was right-skewed, with a modest number of counties reaching very high prevalence while most clustered near the national average. Mean county poverty was 24.0%, mean low educational attainment 12.0%, and mean dental visit prevalence 58.2% (Table 1).
Variable | Mean | SD | Median | Min | Max |
|---|---|---|---|---|---|
TEETHLOST | 15.6 | 5.7 | 14.9 | 3.8 | 44.4 |
POV150 | 24.0 | 8.4 | 23.1 | 3.7 | 71.0 |
NOHSDP | 12.0 | 6.0 | 10.7 | 0.6 | 81.6 |
UNEMP | 5.2 | 2.7 | 4.8 | 0.0 | 32.4 |
SNGPNT | 5.8 | 2.4 | 5.5 | 0.0 | 21.9 |
REMNRTY | 25.7 | 20.5 | 18.9 | 0.0 | 99.4 |
CROWD | 2.4 | 2.4 | 1.8 | 0.0 | 42.0 |
BROAD | 19.5 | 8.0 | 18.2 | 2.4 | 63.0 |
HCOST | 22.0 | 5.2 | 21.7 | 0.0 | 49.5 |
AGE65 | 19.2 | 4.8 | 18.8 | 3.1 | 57.6 |
DENTAL | 58.2 | 11.0 | 60.1 | 5.1 | 78.3 |
ACCESS2 | 11.1 | 4.7 | 9.9 | 3.6 | 43.5 |
CSMOKING | 15.8 | 3.5 | 15.6 | 6.4 | 39.8 |
DIABETES | 13.6 | 2.8 | 13.3 | 4.9 | 27.1 |
GHLTH | 22.0 | 4.8 | 21.3 | 11.0 | 42.7 |
Note: SD = standard deviation. All variables are percentages of the county population except TEETHLOST (complete tooth loss among adults aged 65 years or older). Source: CDC PLACES 2025 release and ACS 2017-2021 Non-Medical Factor Measures.
Hypothesis 1: association of socioeconomic deprivation with complete tooth loss
County poverty correlated positively with complete tooth loss prevalence (Pearson r = 0.78; p < 0.001), as did fair or poor self-rated health (r = 0.80), current smoking (r = 0.75), diagnosed diabetes (r = 0.72), and low educational attainment (r = 0.62). Lack of broadband internet (r = 0.61) and unemployment (r = 0.44) showed moderate positive correlations, whereas dental visit prevalence correlated inversely (r = −0.61). Single-parent households (r = 0.38), racial or ethnic minority status (r = 0.32), and crowding (r = 0.21) showed weaker positive correlations, and housing cost burden was nearly uncorrelated with tooth loss (r = 0.06). The proportion aged 65 years or older was essentially uncorrelated with tooth loss (r = −0.05).
In the multivariable model including all fourteen predictors, the association of poverty with complete tooth loss remained (standardized coefficient 1.77 percentage points per standard deviation; 95% CI 1.52 to 2.02; p < <0.001), as did the association of low educational attainment (0.67; 95% CI 0.46 to 0.88; p < <0.001). Fair or poor self-rated health (1.39) and current smoking (1.35) showed the largest adjusted coefficients alongside poverty, while dental visit prevalence (−0.34) and the proportion aged 65 years or older (−0.48) showed inverse associations. Several deprivation indicators reversed sign after adjustment because of collinearity among them, so their individual coefficients should not be overinterpreted. The full model explained 0.72 of the variance in county prevalence, supporting H1.
Hypothesis 2: predictive accuracy of machine learning versus linear models
Under random five-fold cross-validation, the ridge baseline and the gradient-boosted model performed almost identically (R-squared 0.72 and 0.72, respectively), with root mean square errors of 2.99 and 3.01 percentage points (Table 2). Mean absolute errors were likewise close, near two percentage points, indicating that both models typically missed the county prevalence by a margin that is modest relative to the observed range of the outcome. The machine learning model therefore did not exceed the linear model under random validation, so H2 was not supported.
Model | Validation | R2 | RMSE | MAE |
|---|---|---|---|---|
Ridge (linear baseline) | Random 5-fold | 0.72 | 2.99 | 2.37 |
Gradient boosting | Random 5-fold | 0.72 | 3.01 | 2.39 |
Ridge (linear baseline) | Spatial blocks (10) | 0.34 | 3.07 | 2.44 |
Gradient boosting | Spatial blocks (10) | 0.53 | 2.94 | 2.34 |
Gradient boosting | Leave-state-out | 0.68 | 2.98 | 2.41 |
Note: R2 = coefficient of determination; RMSE = root mean square error (percentage points); MAE = mean absolute error (percentage points). Random five-fold and leave-state-out values are averaged across folds; spatial blocks were defined by k-means clustering (k = 10) of county centroid coordinates. Source: Own elaboration from the analysis of CDC PLACES and ACS data.
Hypothesis 3: stability under spatial cross-validation
Under spatial block cross-validation, performance declined for both models, but the decline was markedly larger for the linear model. The ridge baseline fell to an R-squared of 0.34, whereas the gradient-boosted model retained an R-squared of 0.53 with a root mean square error of 2.94 percentage points (Table 2; Figure 1). The scatter of out-of-fold predictions against observed values showed reasonable agreement across most of the prevalence range, with the largest scatter at the upper extreme, where few counties lie (Figure 1). The leave-one-state-out sensitivity analysis was consistent, with a gradient-boosting R-squared of 0.68. In permutation importance, self-rated health (0.170), poverty (0.162), and current smoking (0.117) were the three leading predictors, and poverty was the highest-ranked social determinant (Table 3). The partial dependence functions confirmed a monotonic increase in predicted complete tooth loss across the observed range of poverty and low educational attainment (Figure 2). The gradient-boosting advantage and the prominence of socioeconomic deprivation therefore persisted under spatial validation, supporting H3.
Predictor | Importance | SD |
|---|---|---|
GHLTH | 0.170 | 0.006 |
POV150 | 0.162 | 0.006 |
CSMOKING | 0.117 | 0.004 |
DENTAL | 0.045 | 0.003 |
ACCESS2 | 0.030 | 0.002 |
NOHSDP | 0.026 | 0.002 |
REMNRTY | 0.024 | 0.001 |
AGE65 | 0.018 | 0.001 |
DIABETES | 0.017 | 0.001 |
HCOST | 0.014 | 0.001 |
SNGPNT | 0.011 | 0.001 |
CROWD | 0.011 | 0.000 |
BROAD | 0.010 | 0.001 |
UNEMP | 0.010 | 0.001 |
Note: Importance is the mean decrease in the coefficient of determination after permuting each predictor across ten repeats. SD = standard deviation. GHLTH = fair or poor self-rated health; POV150 = below 150% of poverty; CSMOKING = current smoking; DENTAL = dental visit in the past year; ACCESS2 = lack of health insurance; NOHSDP = no high school diploma; REMNRTY = racial or ethnic minority; AGE65 = aged 65 years or older. Source: Own elaboration from the analysis of CDC PLACES and ACS data.
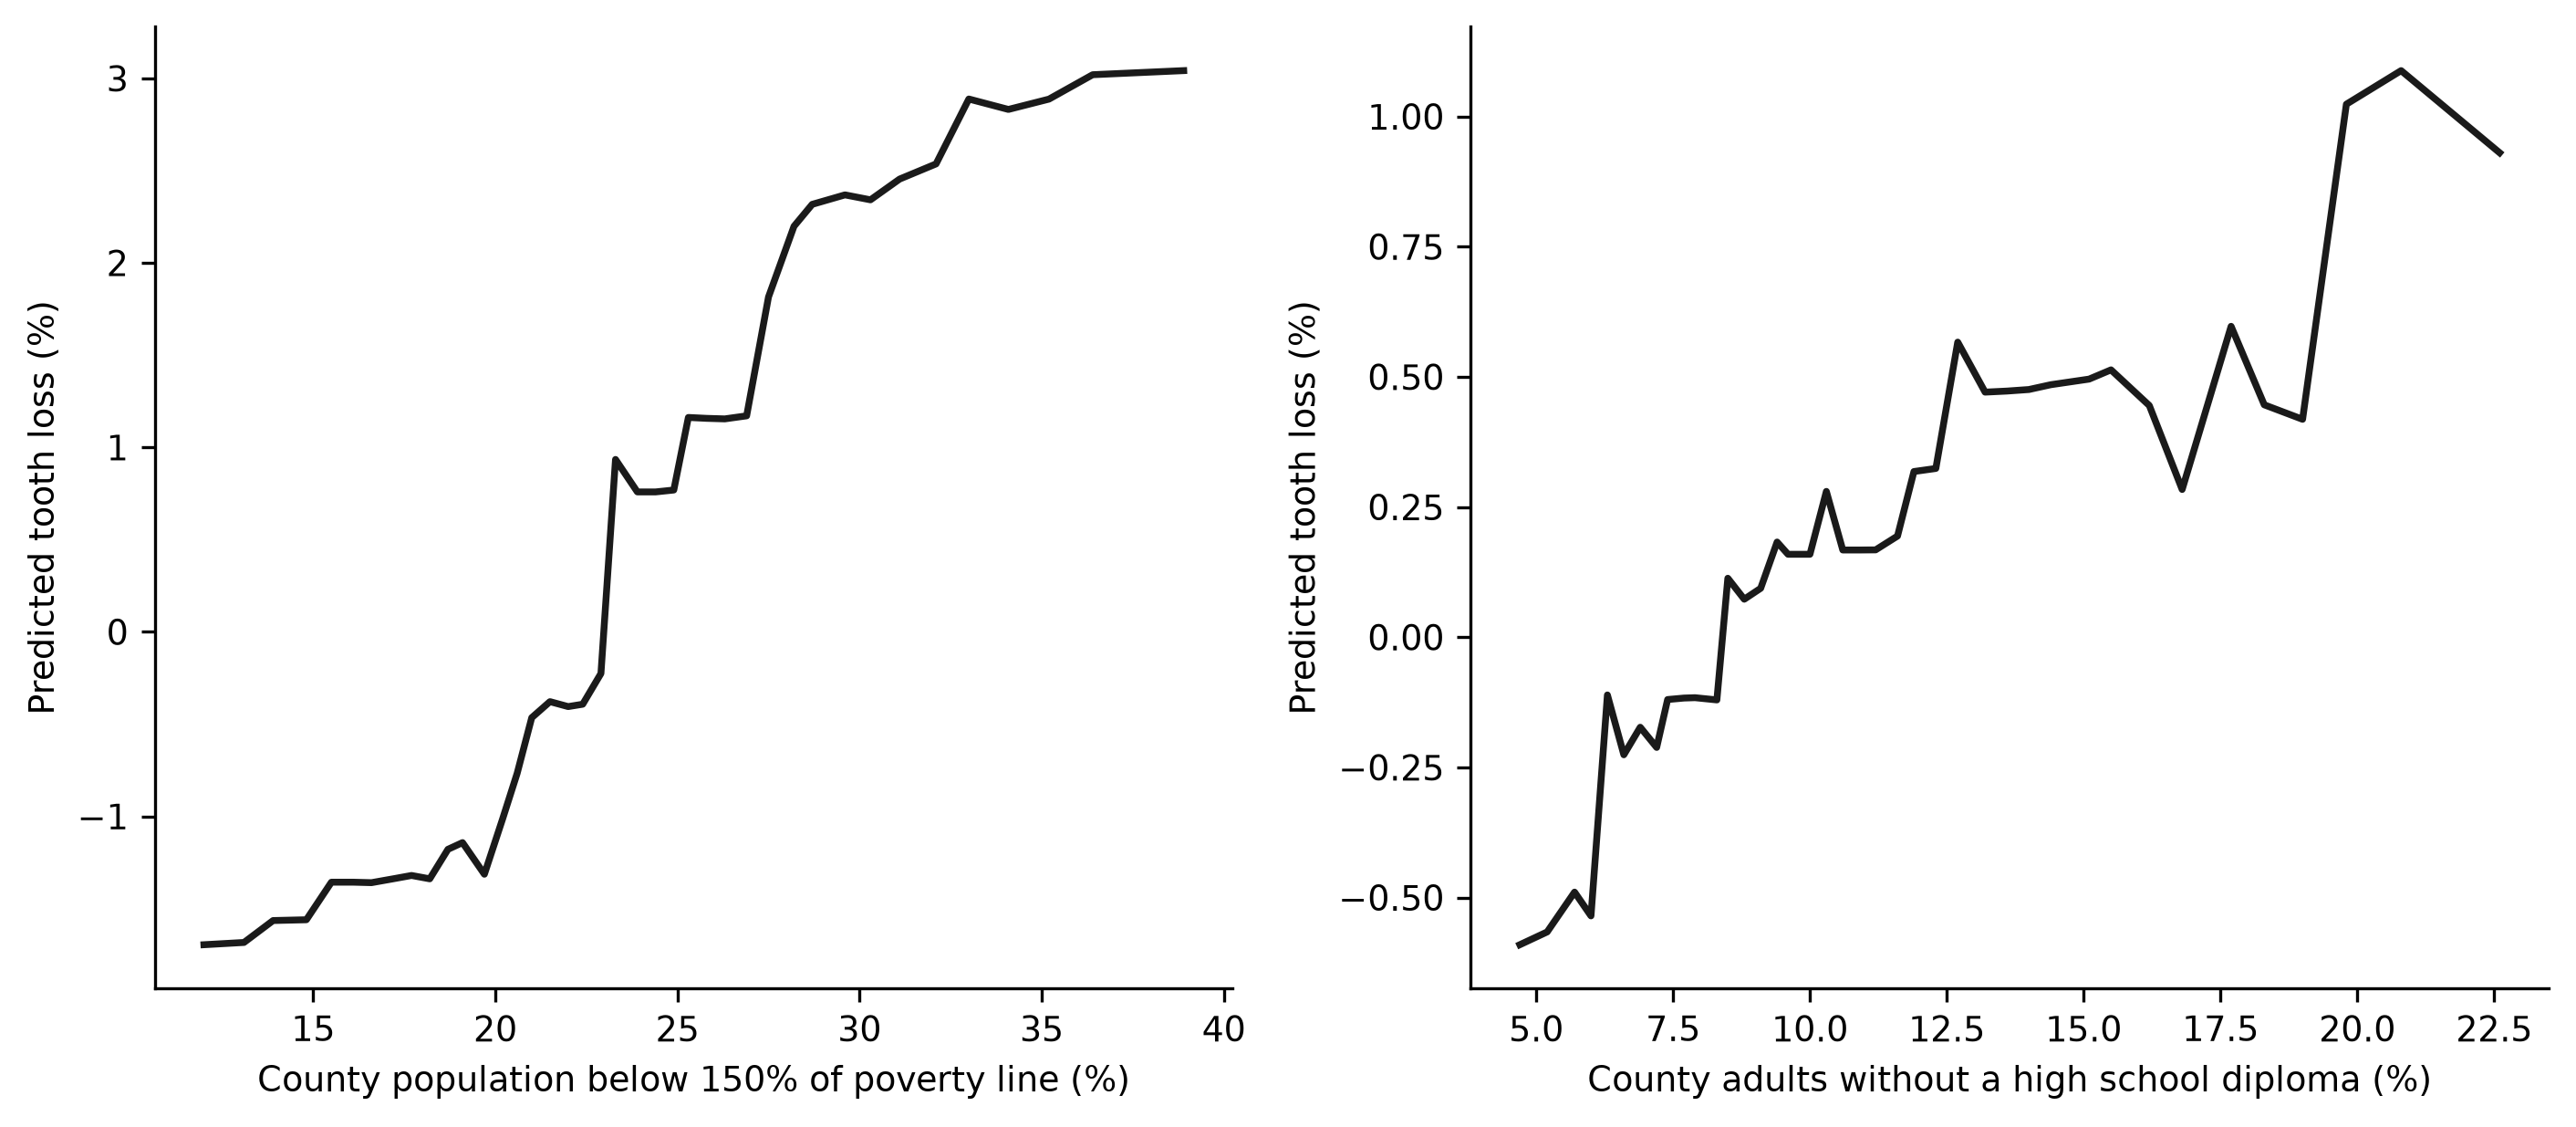
Figure 2. Partial dependence of predicted complete tooth loss prevalence on county poverty and low educational attainment.
Note: Curves show the expected predicted prevalence across the observed range of each predictor with all other predictors held at their average. Source: Own elaboration from the analysis of CDC PLACES and ACS data.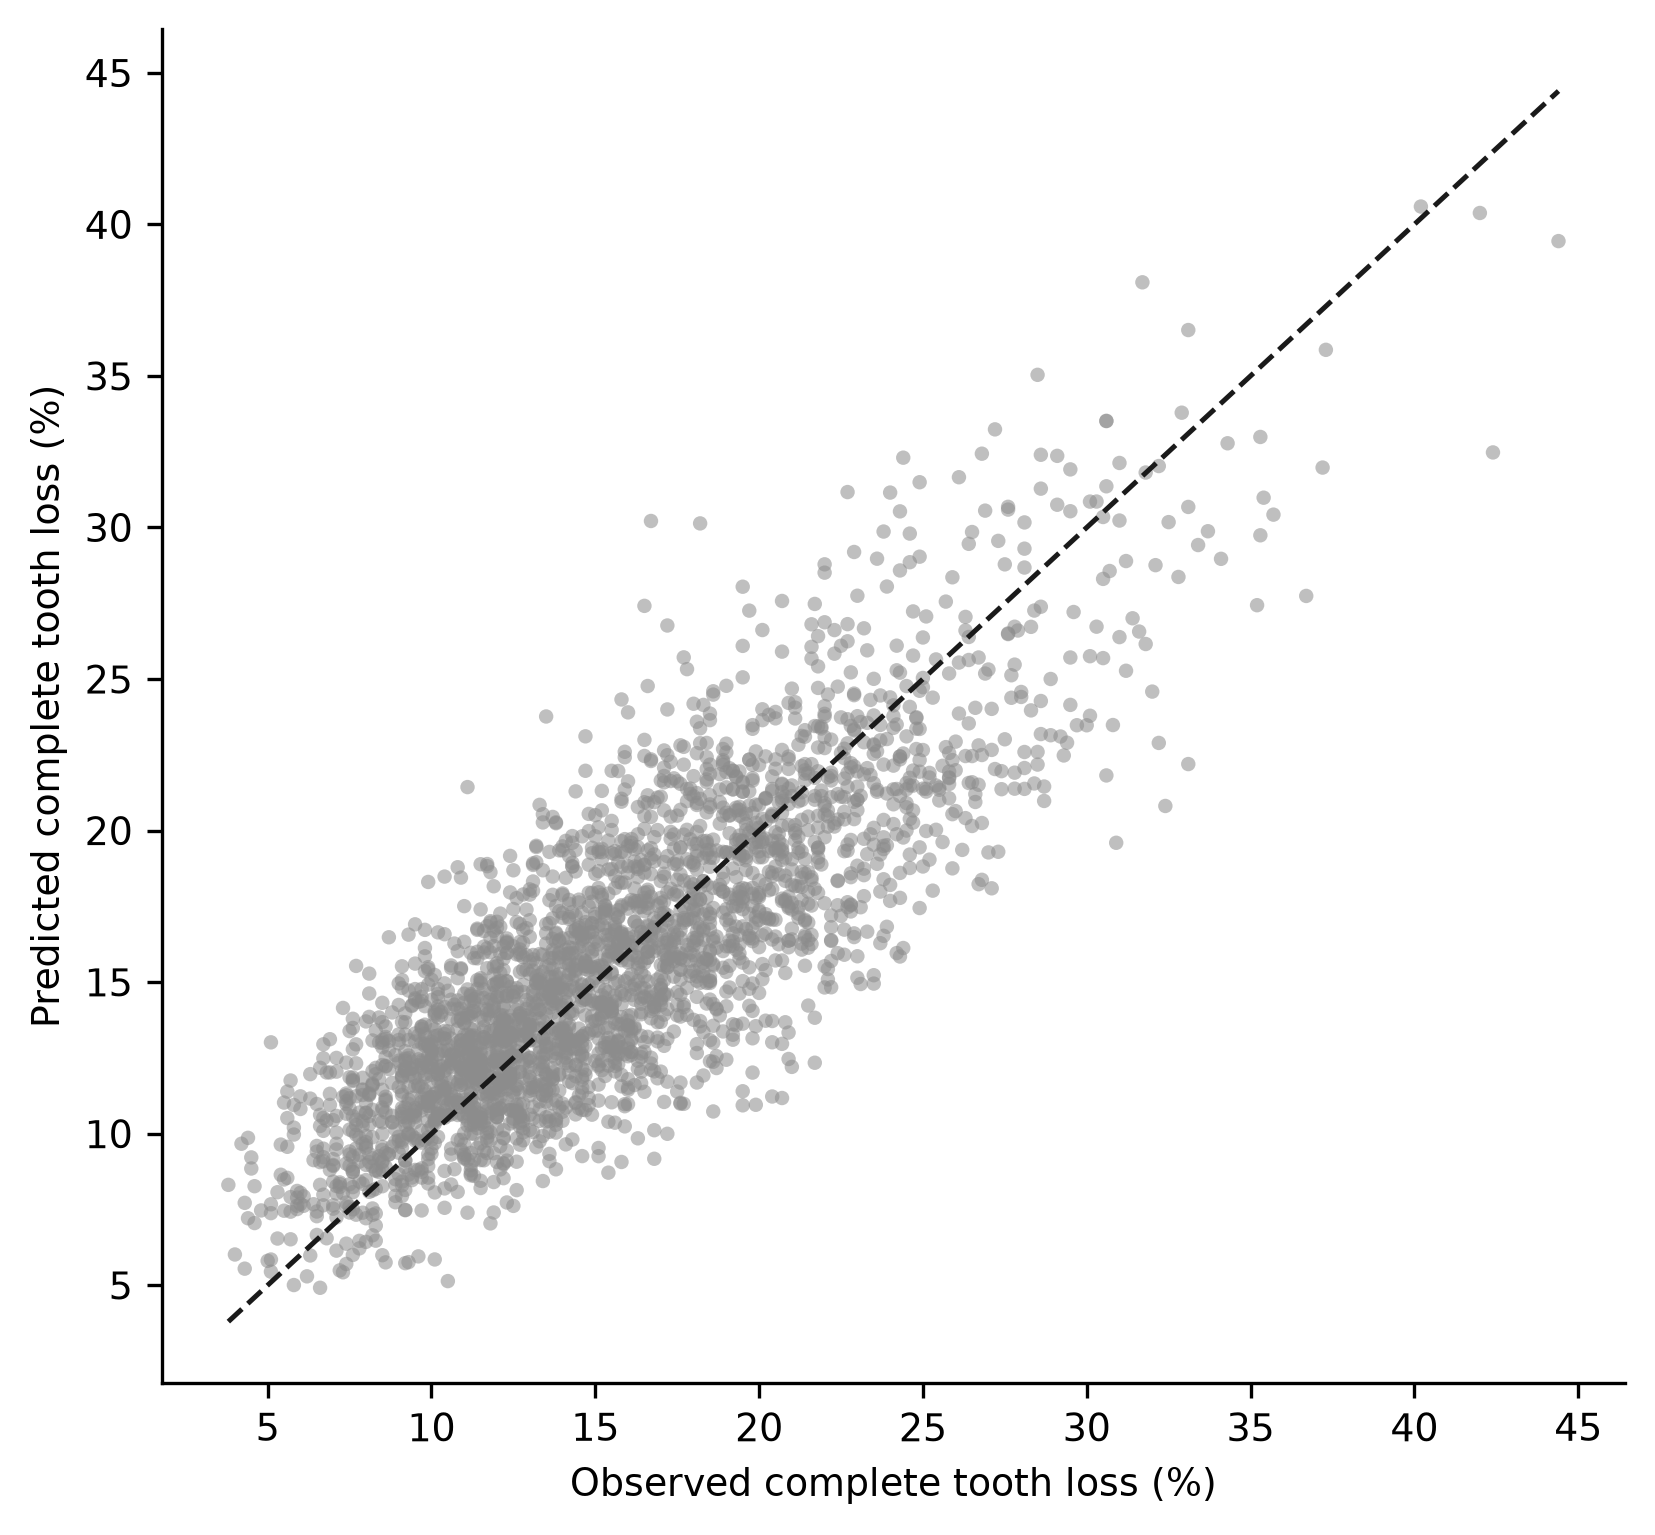
Figure 1. Observed versus predicted complete tooth loss prevalence from spatial block cross-validation.
Note: Predictions are out-of-fold from the gradient-boosted model under spatial block cross-validation; the dashed line marks perfect agreement. Source: Own elaboration from the analysis of CDC PLACES and ACS data.DISCUSSION
The main finding is that county socioeconomic deprivation independently predicts complete tooth loss in older adults, and that a gradient-boosted model transfers across space markedly better than a linear model even though the two are indistinguishable under random validation. Poverty and low educational attainment each showed a robust, adjusted association with complete tooth loss, and poverty was the leading social determinant in the explainability analysis. These results bear directly on the growing use of small-area models to target oral health resources, because they show that the apparent accuracy of such models can be misleading unless validation respects geographic structure.
Hypothesis 1 was supported. The positive association between deprivation and edentulism is consistent with a long line of work. In nationally representative United States data, tooth loss tracks income, education, and racial or ethnic status, and social stratification explains a widening of disparities between advantaged and disadvantaged groups over time.(6,12) County and census-tract analyses likewise found that area-level poverty and other measures of disadvantage predict edentulism among seniors.(13,14) The present estimates are of comparable direction and magnitude, with poverty showing the strongest standardized effect, and they extend earlier work by showing that the association survives adjustment for dental care use, age structure, and several chronic-disease covariates. In absolute terms, moving a county from the 25th to the 75th percentile of poverty corresponds to on the order of two additional percentage points of complete tooth loss, a difference that is meaningful when aggregated across the older population of a county. Cross-national studies of socioeconomic inequality in oral health reached similar conclusions, so the gradient is unlikely to be an artifact of the United States health system.(15,16) A study of older adults in Sichuan Province similarly found socioeconomic status to be the dominant correlate of oral disease, and analyses that decompose racial and ethnic oral health gaps into their components point to socioeconomic position as the principal driver.( 17,18)
Material hardship beyond income shows the same pattern. Food insecurity has been associated with dental caries and periodontitis among middle-aged and older adults in the United States and Korea, and the PLACES platform itself publishes county measures of food and housing insecurity that capture the material dimension of disadvantage.(32) The present model did not include these measures because they are not available for every county at the same resolution as the ACS indicators, but their omission probably means the predictive value of deprivation is underestimated rather than overstated.
Not every study finds a strong area-level effect. Research using individual-level data in some settings reports that neighborhood or county disadvantage contributes comparatively little to tooth loss once individual income and education are accounted for, whereas other studies find that contextual deprivation matters independently. These divergences probably reflect differences in the geographic scale studied, the covariates available for adjustment, and the extent of residential socioeconomic segregation in each setting.(14,16) The present county-level estimates, which lack individual-level adjustment, should be read as capturing the combined individual and contextual dimensions of disadvantage rather than isolating one from the other.
Some individual-level studies emphasize clinical and behavioral mediators such as smoking, diabetes, and dental attendance rather than income itself.(8,12) The permutation ranking here, in which smoking and fair or poor self-rated health also rank highly alongside poverty, is compatible with a pathway in which deprivation operates partly through these intermediate factors. Social support has likewise been linked to severe tooth loss among older adults, suggesting that the relevant exposures extend beyond material resources.(33) That low educational attainment showed a smaller but still substantial independent effect is consistent with education operating through knowledge, health literacy, and lifetime patterns of care seeking rather than through current income alone.(6) The near-zero bivariate correlation of the proportion aged 65 years or older with tooth loss is reassuring, because it indicates that the geographic pattern is not simply an artifact of counties that differ in their age composition.
Hypothesis 2 was not supported. When folds were assigned at random, a well-specified linear model captured most of the predictive signal in these variables, and gradient boosting added no accuracy. This echoes a broader pattern in which simpler models match or approach tree ensembles for many tabular health prediction tasks, particularly when the underlying relationships are close to linear.(22,34) The result is a useful caution against assuming that model complexity confers predictive value in ecological health data, and it also carries a positive implication for practice: where the goal is within-sample ranking and the relationships are linear, a transparent regression whose coefficients can be read directly is preferable to an ensemble precisely because it is easier to communicate and audit. The near-equivalence under random validation also implies that the value of the more complex model lies entirely in its robustness to spatial transfer, a property that would be invisible in a conventional single-validation analysis. The non-linear model earns its place only where it is actually required, which the spatial results below indicate is the case for out-of-area prediction.
Hypothesis 3 was supported, and this is the central methodological contribution. The divergence between models appeared only under spatial validation, where the linear model's R-squared fell to roughly half of its random value while the gradient-boosted model retained more of its performance. The leave-one-state-out result fell between the random and spatial-block estimates, as expected, because state boundaries group counties less tightly than coordinate-based blocks, so they leak less information across folds than a random split but more than a purely spatial partition. This finding aligns with evidence that random cross-validation inflates reported performance for spatially structured data and that spatial validation reveals poor transferability of large-scale mapping models.(24,25) It also matches methodological work showing that the choice of cross-validation strategy changes both the estimated performance and the interpretation of which predictors matter.(26,29) Studies in species distribution modeling and agricultural prediction have reported the same pattern, in which models that appeared accurate under conventional validation degraded sharply once spatial blocking was imposed.(30,31)
Several mechanisms may explain why the machine learning model generalizes better across space. Gradient boosting captures non-linearities and interactions, such as the sharper increase in tooth loss at the extreme of the poverty distribution visible in the partial dependence curve, and its subsampling regularization may be more robust to the spatial clustering of unmeasured regional factors than a global linear fit. The interpretability tools applied here show that the model's spatial generalization does not come at the cost of opacity: poverty and low educational attainment have monotonic, plausible relationships with the outcome, and the ranking of determinants is consistent with the regression analysis. Substantively, the poverty-tooth loss association likely operates through several interlocking channels, including the cost of dental care relative to income, competing demands on household budgets, higher smoking prevalence and diabetes burden, and differential access to preventive services across the life course.(11,12) The inverse association of dental visit prevalence with tooth loss, and the prominence of smoking and self-rated health in the importance ranking, are consistent with these intermediate pathways. The downstream health consequences of edentulism, including frailty, cognitive impairment, and cardiovascular risk, give these predictions clinical weight beyond the oral cavity.( 7,10,35)
Beyond the substantive findings, the study illustrates a methodological point of general relevance. The two models were indistinguishable under random validation and yet differed by roughly twenty percentage points of explained variance under spatial validation. Any small-area model intended to inform decisions outside its training area should therefore report spatial as well as random performance, because the two can lead to opposite conclusions about which model to deploy. This concern extends to county and subnational health models beyond oral health, wherever neighboring units share unmeasured characteristics, and it reinforces the argument that validation strategy is a scientific choice rather than a technical detail.(26,31) Reporting guidance for prediction models now emphasizes validation in settings that differ from the development data, and the present comparison suggests that geographic structure is one of the most consequential dimensions along which a development and an application setting can differ for area-level health models.
Taken together, the three hypotheses point to a practical conclusion for population oral health. If the goal is to rank counties by predicted tooth loss for resource allocation within the area used for training, a linear model is adequate. If the goal is to predict previously unseen counties or regions, the machine learning model is the more defensible choice, and its feature ranking remains interpretable. The difference between the two validation schemes, rather than any property of the algorithm itself, is what separates a model that appears accurate from one that is accurate where it will actually be used. For researchers building small-area oral health models, a simple rule follows: report both random and spatial performance, and choose the model class according to how the model will actually be deployed.
The strengths of the analysis include its national coverage of nearly three thousand counties, the use of open and reproducible data, the direct comparison of a transparent linear baseline against a flexible ensemble, and the inclusion of both random and spatial validation, which allowed the two to be contrasted. The study also has limitations. First, it is ecological, so the associations describe counties rather than individuals and cannot rule out confounding by unmeasured county characteristics; an individual-level multilevel design would be needed to separate compositional and contextual effects. Second, the outcome and several covariates are model-based small-area estimates rather than direct observations, so measurement error and the borrowing of information across neighboring areas may attenuate or, for the outcome, partially induce spatial structure; direct survey or administrative counts would strengthen inference. Third, the analysis is cross-sectional and identifies associations, not causal effects. Fourth, spatial blocks were defined by k-means clustering rather than administrative or ecological boundaries, so results may differ under alternative spatial partitions, although the leave-one-state-out sensitivity was concordant. Fifth, complete-case analysis excluded 197 counties with missing data, most of them small, and their omission could influence the estimated associations; multiple imputation or inclusion of county-equivalent units would address this. Sixth, the set of social determinants was limited to those available from a single ACS-derived source, and it omits measures of area-level wealth, employment quality, and racial residential segregation that may capture additional predictive signal; future models could incorporate these to test whether the ranking of poverty is robust.
Future work could extend this analysis in several directions. Adding county-level measures of dental workforce supply, insurance coverage policy, and water fluoridation would test whether supply-side factors modify the deprivation gradient. Multilevel designs linking individual survey respondents to their counties would separate the compositional and contextual contributions that the ecological design conflates. Applying the same spatially validated framework to other oral outcomes, such as untreated caries or periodontal disease, would indicate whether the spatial transferability advantage of non-linear models is specific to tooth loss or a general feature of small-area oral health modeling.
For practice and policy, these results suggest that county-level models of edentulism can support the geographic targeting of oral health programs for older adults, but only if their performance is reported under spatial validation. The finding that deprivation, and poverty in particular, is the leading social determinant indicates that interventions addressing affordability and access are likely to yield the largest reductions in geographic inequality in tooth loss. For example, a program that subsidizes dentures or expands coverage for older adults could use the predicted county ranking to prioritize outreach to the counties where the expected burden, and therefore the return on each dollar, is highest. Because the predictors are drawn from routine open data, the approach can be reproduced in other countries that publish small-area health and census indicators, which would test whether the social gradient generalizes across health systems.
CONCLUSIONS
County socioeconomic deprivation, and poverty above all, independently predicted complete tooth loss among older adults across United States counties, supporting H1. Gradient boosting did not exceed a linear model under random cross-validation, so H2 was not supported. The machine learning model transferred better across space and retained the ranking of social determinants under spatial validation, supporting H3 and confirming the need for spatially aware evaluation of small-area predictive models.
References
- 1 Borg-Bartolo R, Roccuzzo A, Molinero-Mourelle P, Schimmel M, Gambetta-Tessini K, Chaurasia A, et al. Global prevalence of edentulism and dental caries in middle-aged and elderly persons: A systematic review and meta-analysis. Journal of Dentistry. 2022;127:104335. doi: 10.1016/j.jdent.2022.104335
- 2 Chen H, Jing Y, Song Y, Jia Z, He X, Zhang S, et al. Edentulism Trends in Chinese Women vs US and Global Women: GBD 2021 Outlook. IJWH. 2025;Volume 17:4661-4670. doi: 10.2147/ijwh.s558621
- 3 Qin X, He J, He H, Yuan X, Su X, Zeng X. Long-term trends in the burden of edentulism in China over three decades: A Joinpoint regression and age-period-cohort analysis based on the global burden of disease study 2019. Front Public Health. 2023;11:1099194. doi: 10.3389/fpubh.2023.1099194
- 4 Wu B, Liang J, Plassman BL, Remle C, Luo X. Edentulism trends among middle‐aged and older adults in the United States: comparison of five racial/ethnic groups. Comm Dent Oral Epid. 2012;40(2):145-153. doi: 10.1111/j.1600-0528.2011.00640.x
- 5 Wu B, Liang J, Plassman BL, Remle RC, Bai L. Oral health among white, black, and Mexican-American elders: an examination of edentulism and dental caries. Journal of Public Health Dentistry. 2011;71(4):308-317. doi: 10.1111/j.1752-7325.2011.00273.x
- 6 Wu B, Hybels C, Liang J, Landerman L, Plassman B. Social stratification and tooth loss among middle‐aged and older Americans from 1988 to 2004. Comm Dent Oral Epid. 2014;42(6):495-502. doi: 10.1111/cdoe.12116
- 7 Matsuyama Y, Jürges H, Listl S. Causal Effect of Tooth Loss on Cardiovascular Diseases. J Dent Res. 2023;102(1):37-44. doi: 10.1177/00220345221120164
- 8 Tung H, Ford R. Incident edentulism and number of comorbidities among middle‐aged and older Americans. Gerodontology. 2023;40(4):484-490. doi: 10.1111/ger.12675
- 9 Mira R, Newton JT, Sabbah W. The Longitudinal Relationship between Edentulism and the Progress of Multimorbidity. Nutrients. 2024;16(14):2234. doi: 10.3390/nu16142234
- 10 Dibello V, Lobbezoo F, Lozupone M, Sardone R, Ballini A, Berardino G, et al. Oral frailty indicators to target major adverse health-related outcomes in older age: a systematic review. GeroScience. 2023;45(2):663-706. doi: 10.1007/s11357-022-00663-8
- 11 Gilbert GH, Paul duncan R, Shelton BJ. Social Determinants of Tooth Loss. Health Services Research. 2003;38(6p2):1843-1862. doi: 10.1111/j.1475-6773.2003.00205.x
- 12 Lee H, Kim D, Jung A, Chae W. Ethnicity, Social, and Clinical Risk Factors to Tooth Loss among Older Adults in the U.S., NHANES 2011–2018. IJERPH. 2022;19(4):2382. doi: 10.3390/ijerph19042382
- 13 Mitchell J, Bennett K, Brock‐Martin A. Edentulism in High Poverty Rural Counties. The Journal of Rural Health. 2013;29(1):30-38. doi: 10.1111/j.1748-0361.2012.00440.x
- 14 Chong GTF, Gansky SA. Census tract geospatial analysis comparing social determinants of health with tooth loss in California seniors: An ecologic study. Comm Dent Oral Epid. 2024;52(6):889-899. doi: 10.1111/cdoe.12995
- 15 Pitchika V, Jordan RA, Norderyd O, Rolander B, Welk A, Völzke H, et al. Factors influencing tooth loss in European populations. J Clinic Periodontology. 2022;49(7):642-653. doi: 10.1111/jcpe.13642
- 16 Kailembo A, Preet R, Stewart Williams J. Socioeconomic inequality in self-reported unmet need for oral health services in adults aged 50 years and over in China, Ghana, and India. Int J Equity Health. 2018;17(1):99. doi: 10.1186/s12939-018-0812-2
- 17 Wang L, Cheng L, Yuan B, Hong X, Hu T. Association between socio-economic status and dental caries in elderly people in Sichuan Province, China: a cross-sectional study. BMJ Open. 2017;7(9):e016557. doi: 10.1136/bmjopen-2017-016557
- 18 Jamieson L, Wu B, Chrisopoulos S, Luzzi L, Mejia G, Ju X. Oral health inequities over time among older adults of different racial/ethnic backgrounds: a comparative decomposition analysis across Australia and the United States. BMC Geriatr. 2024;24(1):936. doi: 10.1186/s12877-024-05525-w
- 19 Greenlund KJ, Lu H, Wang Y, Matthews KA, LeClercq JM, Lee B, et al. PLACES: Local Data for Better Health. Prev Chronic Dis. 2022;19:210459. doi: 10.5888/pcd19.210459
- 20 Wang Y, Holt JB, Zhang X, Lu H, Shah SN, Dooley DP, et al. Comparison of Methods for Estimating Prevalence of Chronic Diseases and Health Behaviors for Small Geographic Areas: Boston Validation Study, 2013. Prev Chronic Dis. 2017;14:170281. doi: 10.5888/pcd14.170281
- 21 Rasheed K, Qayyum A, Ghaly M, Al-Fuqaha A, Razi A, Qadir J. Explainable, trustworthy, and ethical machine learning for healthcare: A survey. Computers in Biology and Medicine. 2022;149:106043. doi: 10.1016/j.compbiomed.2022.106043
- 22 Woodman RJ, Mangoni AA. A comprehensive review of machine learning algorithms and their application in geriatric medicine: present and future. Aging Clin Exp Res. 2023;35(11):2363-2397. doi: 10.1007/s40520-023-02552-2
- 23 van Schaik P, Peng Y, Ojelabi A, Ling J. Explainable statistical learning in public health for policy development: the case of real-world suicide data. BMC Med Res Methodol. 2019;19(1):152. doi: 10.1186/s12874-019-0796-7
- 24 Ploton P, Mortier F, Réjou-Méchain M, Barbier N, Picard N, Rossi V, et al. Spatial validation reveals poor predictive performance of large-scale ecological mapping models. Nat Commun. 2020;11(1):4540. doi: 10.1038/s41467-020-18321-y
- 25 Kattenborn T, Schiefer F, Frey J, Feilhauer H, Mahecha MD, Dormann CF. Spatially autocorrelated training and validation samples inflate performance assessment of convolutional neural networks. ISPRS Open Journal of Photogrammetry and Remote Sensing. 2022;5:100018. doi: 10.1016/j.ophoto.2022.100018
- 26 Sweet LB, Müller C, Anand M, Zscheischler J. Cross-Validation Strategy Impacts the Performance and Interpretation of Machine Learning Models. Artificial Intelligence for the Earth Systems. 2023;2(4). doi: 10.1175/aies-d-23-0026.1
- 27 Centers for Disease Control and Prevention. PLACES: Local Data for Better Health, County Data, 2025 release [Internet]. 2025. Available from: https://data.cdc.gov/Public-Health-Surveillance/PLACES-Local-Data-for-Better-Health-County-Data-2/swc5-untb
- 28 Centers for Disease Control and Prevention. Non-Medical Factor Measures for County, American Community Survey 2017-2021 [Internet]. 2023. Available from: https://data.cdc.gov/500-Cities-Places/Non-Medical-Factor-Measures-for-County-ACS-2017-/i6u4-y3g4
- 29 Deppner J, Cajias M. Accounting for Spatial Autocorrelation in Algorithm-Driven Hedonic Models: A Spatial Cross-Validation Approach. J Real Estate Finan Econ. 2024;68(2):235-273. doi: 10.1007/s11146-022-09915-y
- 30 Milà C, Mateu J, Pebesma E, Meyer H. Nearest neighbour distance matching Leave‐One‐Out Cross‐Validation for map validation. Methods Ecol Evol. 2022;13(6):1304-1316. doi: 10.1111/2041-210x.13851
- 31 Yates LA, Aandahl Z, Richards SA, Brook BW. Cross validation for model selection: A review with examples from ecology. Ecological Monographs. 2023;93(1):e1557. doi: 10.1002/ecm.1557
- 32 Lee JJ, Kim Y, Scott JM, Hill CM, Chi DL. The association of food insecurity with tooth decay and periodontitis among middle‐aged and older adults in the United States and Korea. Gerodontology. 2023;40(2):251-262. doi: 10.1111/ger.12651
- 33 Laniado N, Cloidt M, Shah P. Social support and oral health among working‐age and older adults in the United States. J Public Health Dent. 2023;83(3):247-253. doi: 10.1111/jphd.12573
- 34 Bellinger C, Mohomed Jabbar MS, Zaïane O, Osornio-Vargas A. A systematic review of data mining and machine learning for air pollution epidemiology. BMC Public Health. 2017;17(1):907. doi: 10.1186/s12889-017-4914-3
- 35 Choi SE, Mo E, Palmer N, Fox K, Da Silva JD, Nagai S, et al. Cognitive impairment and edentulism among older adults: an observational study using claims data. BMC Geriatr. 2022;22(1):278. doi: 10.1186/s12877-022-02985-w
Declarations
Funding
No financing
Conflict of interest
None
Authorship contributions
Drafting – original draft: Rómulo Esteban Montilla, Rolando Eslava Zapata, Edixon Chacón Guerrero.
Writing–review and editing: Rómulo Esteban Montilla, Rolando Eslava Zapata, Edixon Chacón Guerrero.