

Abstract
Introduction: Periodontitis is a highly prevalent chronic inflammatory disease whose diagnosis relies almost entirely on clinical measures. Gene expression signatures offer a candidate molecular complement, but their transfer across independent cohorts and platforms is seldom tested. Methods: A signature was derived from a public gingival-tissue microarray cohort (GSE10334; 183 periodontitis and 64 healthy sites) by differential expression (FDR below 0.05 and absolute log2 fold change of at least 1). The score, the mean of direction-signed per-gene z-scores, was validated in an independent same-platform microarray cohort (GSE16134; 241 diseased, 69 healthy) and a cross-platform RNA-seq cohort (GSE173078; 12 periodontitis, 12 healthy). Discrimination was quantified by the area under the receiver operating characteristic curve (AUROC) with bootstrap 95% confidence intervals. Results: The signature comprised 190 genes (142 upregulated and 48 downregulated) and was dominated by immunoglobulin and plasma-cell markers. The score reached an AUROC of 0.90 (95% CI 0.85 to 0.95) in internal cross-validation, 0.93 (95% CI 0.89 to 0.96) in the same-platform cohort, and 0.75 (95% CI 0.53 to 0.93) in the cross-platform cohort. Conclusions: A plasma-cell-enriched gene signature generalizes to an independent same-platform cohort but attenuates across platforms, indicating that platform harmonization is required before clinical translation.
Keywords
periodontitis, gene expression profiling, machine learning, transcriptome, biomarkers
INTRODUCTION
Periodontitis is a chronic inflammatory disease of the tooth-supporting tissues and one of the most prevalent human conditions. The Global Burden of Disease study estimated severe periodontitis among the leading contributors to years lived with disability worldwide, with a burden that has continued to rise over the past three decades.( 1) The disease arises when a dysbiotic subgingival biofilm drives a sustained host inflammatory response that destroys periodontal ligament and alveolar bone. Because this destruction is largely irreversible, the clinical value of detection rests on recognizing the disease before attachment loss becomes extensive.( 2) Clinical examination nonetheless remains the principal means of case definition, a circumstance that limits both early identification and population-level surveillance and has motivated the search for molecular complements.
The destructive phase of periodontitis is driven less by the bacteria themselves than by the host response they provoke. Histological and molecular studies describe a lesion dominated by B lymphocytes and plasma cells, with abundant immunoglobulin production, alongside neutrophil infiltration orchestrated by chemokines such as IL-8, CXCL1, and CXCL6.(3-5) These same cell populations and mediators are precisely the features that transcriptomic studies find most strongly overexpressed in diseased gingiva.(6) A gene signature built around them is therefore a readout of the biology that defines the disease rather than a bare statistical discriminator, which is one reason it may be expected to travel beyond the cohort in which it was derived. This biological grounding is what distinguishes a candidate molecular test from a purely empirical classifier and is the basis for the external-validation design described below.
The 2017 World Workshop consolidated the historical distinctions between chronic and aggressive periodontitis into a single category characterized by a multidimensional staging and grading system, yet its case definition still rests on clinical attachment loss, probing depth, and bleeding on probing.(2) Whole-genome transcriptomics of gingival tissue has repeatedly shown that diseased and healthy sites can be separated by their gene expression, with immune and inflammatory programs among the most consistent signals, and dedicated analyses have catalogued the tissue-specific expression profiles of human gingiva.(6-9)
These observations have motivated a growing literature of machine-learning classifiers and gene signatures intended to complement clinical diagnosis, spanning senescence, lactylation, m1A methylation, and neutrophil-degranulation programs.( 10-13) The earliest of these studies used microarrays, and more recent work has moved to RNA-seq, so the field now sits on a boundary between two measurement technologies whose results are not fully interchangeable.
A persistent limitation of this literature is validation. Most signatures are developed and assessed within a single dataset, and the minority that undergo external testing rarely cross technology boundaries; when they do, performance commonly falls because of platform-specific and batch-related variability.( 14,15)
The consequence is that a favorable internal performance can be mistaken for a transportable biomarker, and a signature that survives transfer to a new cohort has a stronger claim to reflect disease biology than one that merely performs well in the cohort where it was tuned. This study was therefore organized around an explicit hierarchy of outcomes. The primary outcome was the discrimination of a gene-signature score for periodontitis versus health in independent cohorts. Secondary outcomes were internal cross-validated discrimination, sensitivity and specificity at a fixed threshold, and the performance of a regularized logistic-regression classifier as a sensitivity analysis.
The aim of this study was to derive a machine-learning gene expression signature for periodontitis from a public gingival-tissue transcriptomic cohort and to validate its discrimination in an independent same-platform cohort and a cross-platform RNA-seq cohort. The design deliberately spans two measurement technologies and three independent sample collections, so that the primary endpoint reflects transportability rather than in-sample fit.
METHODS
Study design and data sources
This was a secondary analysis of three public transcriptomic datasets deposited in the Gene Expression Omnibus (GEO). The datasets contain fully de-identified data already in the public domain, so this analysis required no ethics approval or informed consent. The training cohort, GSE10334, contains gingival tissue samples from systemically healthy non-smokers with moderate to advanced periodontitis, each of whom contributed at least one periodontitis site and one healthy site.(6) The first validation cohort, GSE16134, comprises gingival tissue samples from systemically healthy non-smokers with periodontitis who contributed at least two interproximal papillae; the same cohort has been characterized in parallel for its subgingival bacterial colonization profiles, which allows the host signature to be placed alongside the microbial context.(7,16) The second validation cohort, GSE173078, provides RNA-seq profiles of gingival tissue from sites classified as periodontitis, gingivitis, or healthy.(17) The three datasets were deliberately chosen to span two measurement platforms and to be independent of one another.
Phenotype definition
In the two microarray cohorts the phenotype was taken from the GEO sample annotation. Samples were labeled diseased when bleeding on probing, an interproximal probing depth greater than 3 mm, and concomitant clinical attachment loss were recorded, and healthy when these features were absent.(6,7) In the RNA-seq cohort the annotation distinguishes periodontitis, gingivitis, and healthy tissue; the gingivitis samples were excluded so that the case definition remained binary, leaving only periodontitis and healthy tissue for analysis.(17) This binary definition was held constant across all three cohorts so that the outcome was the same quantity in every dataset. Because the microarray phenotype rests on clinical parameters recorded at the time of tissue harvest, some degree of misclassification is inherent, but the definition is the one used by the original studies and is therefore the most faithful label available.
Preprocessing and gene-level summarization
The two microarray datasets were generated on the Affymetrix Human Genome U133 Plus 2.0 platform (GPL570). Series-matrix files were downloaded from the GEO file transfer protocol server, and probes were mapped to gene symbols with the platform annotation; where several probes mapped to the same gene, the probe with the highest mean expression across samples was retained to obtain a single value per gene, and probes without a gene symbol were excluded. The RNA-seq cohort was analyzed from the deposited raw counts, transformed to log2 counts per million plus one to account for differences in library size; the addition of one before the logarithm stabilizes the transformation for genes with zero or very low counts, which are common in RNA-seq data. Before scoring, each gene was standardized within each cohort to a mean of zero and unit standard deviation, so that the signature did not depend on the absolute scale of any platform and could be applied across microarray and RNA-seq measurements. No imputation of missing expression values was performed; genes absent from a given cohort were simply omitted from the score within that cohort, which left 190 signature genes available in the microarray validation cohort and 165 in the RNA-seq cohort. Batch correction across cohorts was deliberately not applied, because the central question was whether the signature transfers without such correction; the only harmonization step was the within-cohort standardization described above, which aligns the distribution of each gene without borrowing information across cohorts.
Differential expression and signature derivation
Differential expression between periodontitis and healthy samples was computed in the training cohort using Welch's t-tests, with log2 fold changes and Benjamini–Hochberg false discovery rates (FDR) to control the multiplicity of testing across genes. The log2 fold change was defined as the difference in mean expression between the periodontitis and healthy groups on the log2 scale. Welch's t-test was chosen because it does not assume equal variance between the two groups, and the FDR was computed across all genes tested to account for the large number of simultaneous comparisons. No gene was excluded a priori on the basis of prior knowledge, so the signature is data-driven rather than hypothesis-restricted. The signature comprised all genes with an FDR below 0.05 and an absolute log2 fold change of at least 1.0, capped at 200 genes when more met these criteria; each gene was assigned a direction equal to the sign of its log2 fold change. The two thresholds were chosen to balance sensitivity and specificity of gene selection: the FDR floor limits false positives, while the fold-change floor excludes statistically significant but biologically small changes, yielding a signature of interpretable size rather than the many thousands of genes that pass the FDR criterion alone. The signature was locked at this point and was not modified in light of the validation results, so the external cohorts were treated strictly as held-out data.
Signature score
For each sample the signature score was defined as the mean of the direction-signed z-scores across the signature genes available in that cohort. The score is a unit-free summary that combines the standardized expression of each gene weighted by its direction of change, so that high scores indicate a periodontitis-like profile and low scores a healthy profile. Because the score uses only the direction and not the magnitude of differential expression, it is less sensitive to platform-specific differences in dynamic range than a full coefficient-based model, which makes it the more conservative summary for cross-platform comparison.
Internal and external validation
Discrimination was quantified with the area under the receiver operating characteristic curve (AUROC). Internal performance was estimated by apparent discrimination and by stratified 5-fold cross-validation, in which the z-score standardization was recomputed within each training fold so that no information from the validation fold leaked into scoring. External validation was performed in the two independent cohorts without refitting the signature. Sensitivity and specificity were computed at the Youden threshold estimated in the training cohort and applied unchanged to the validation cohorts, together with positive and negative predictive values. The Youden threshold maximizes the sum of sensitivity and specificity and provides an objective, pre-specified operating point rather than one chosen after inspecting the results.
Sensitivity analysis
As a sensitivity analysis, an L2-regularized logistic-regression classifier with balanced class weights was fitted on the 165 signature genes present in all three cohorts, after within-cohort standardization, and was applied to the validation cohorts after the same standardization. This model differs from the signature score in that its coefficients are estimated from the data rather than fixed to the direction of change, and it therefore tests whether a data-estimated model transfers as well as the fixed-direction score.
Statistical analysis
Confidence intervals for the AUROC were obtained from 1,000 bootstrap resamples, stratified by phenotype so that the proportions of diseased and healthy samples were preserved within each resample; the 2.5th and 97.5th percentiles of the bootstrap distribution defined the interval. A two-sided alpha of 0.05 was used throughout. The AUROC was preferred over accuracy because it summarizes discrimination across all possible thresholds and is insensitive to the class imbalance present in the microarray cohorts. Analyses were performed in Python 3.13 with scikit-learn, SciPy, statsmodels, pandas, and NumPy; figures were produced with Matplotlib. The analysis pipeline was executed twice with a fixed random seed and produced identical results.
Data availability and reproducibility
The series-matrix and raw-count files for the three datasets are available without restriction from the Gene Expression Omnibus under their respective accessions. The analysis script, together with the exact parameter choices and the fixed random seed, is self-contained and re-runnable; re-executing it reproduces every number reported here. Tables and figures were generated directly from the analysis output rather than transcribed by hand, so the reported values match the code exactly.
RESULTS
Cohort characteristics
The three cohorts comprised 247, 310, and 24 gingival tissue samples, respectively. The training cohort (GSE10334) contained 183 periodontitis and 64 healthy sites; the first validation cohort (GSE16134) contained 241 diseased and 69 healthy sites; and the cross-platform cohort (GSE173078) contained 12 periodontitis and 12 healthy samples after exclusion of the gingivitis samples. The periodontitis group outnumbered the healthy group in the two microarray cohorts, whereas the two groups were balanced in the RNA-seq cohort after the exclusion of gingivitis. The two microarray cohorts were measured on the same platform and were assembled independently roughly a decade apart from the RNA-seq cohort (Table 1).
Cohort | Platform | Year | Country | Diseased | Healthy |
|---|---|---|---|---|---|
Training (GSE10334) | GPL570 (microarray) | 2008 | USA | 183 | 64 |
Validation 1 (GSE16134) | GPL570 (microarray) | 2010 | USA | 241 | 69 |
Validation 2 (GSE173078) | GPL20301 (RNA-seq) | 2021 | USA | 12 | 12 |
Note: Diseased = periodontitis; healthy = periodontally healthy gingival tissue. GSE173078 is restricted to periodontitis and healthy samples after excluding gingivitis. Source: NCBI Gene Expression Omnibus: GSE10334, GSE16134, GSE173078.
Differential expression and signature
Differential expression analysis across 21,755 genes in the training cohort identified 12,272 genes with an FDR below 0.05, of which 190 also met the fold-change criterion and formed the signature; 142 were upregulated and 48 were downregulated in periodontitis (Figure 1). The most strongly upregulated genes were dominated by immunoglobulin heavy- and light-chain loci, including IGHD, IGHV3-23, IGHM, and IGLJ3, and by plasma-cell markers such as TNFRSF17, MZB1, POU2AF1, and FAM46C. The neutrophil chemokines CXCL6 and CXCL1 were also present in the signature, whereas the epithelial gene DSC1 was the most strongly downregulated (Table 2, Figure 2). The downregulated genes were fewer in number and included epithelial and structural components. The fold changes were large in absolute terms, with the leading genes exceeding a twofold difference between groups.

Figure 1. Differential expression between periodontitis and healthy gingival tissue in the training cohort.
Note: Each point is a gene. Signature genes (FDR < 0.05 and absolute log2 fold change of at least 1) are shown in black. Source: Differential expression analysis of GSE10334.Gene | log2FC | FDR | Direction |
|---|---|---|---|
LOC102725526 | 2.33 | 3.93e-16 | Upregulated |
IGHD | 2.33 | 6.76e-15 | Upregulated |
IGHV3-23 | 2.33 | 9.61e-16 | Upregulated |
IGHV4-31 | 2.28 | 6.16e-15 | Upregulated |
CKAP2 | 2.25 | 5.21e-16 | Upregulated |
IGHM | 2.24 | 2.30e-14 | Upregulated |
IGLJ3 | 2.23 | 2.09e-14 | Upregulated |
POU2AF1 | 2.21 | 1.04e-14 | Upregulated |
BMS1P20 | 2.20 | 2.22e-15 | Upregulated |
TNFRSF17 | 2.17 | 1.02e-14 | Upregulated |
IGLL5 | 2.15 | 2.90e-15 | Upregulated |
FAM46C | 2.14 | 1.09e-15 | Upregulated |
DSC1 | -2.10 | 1.50e-11 | Downregulated |
MLIP | 2.07 | 5.19e-15 | Upregulated |
FAM30A | 2.01 | 1.64e-16 | Upregulated |
AADACL2 | -1.97 | 3.06e-13 | Downregulated |
IGKV1OR2-108 | 1.95 | 2.02e-14 | Upregulated |
SPAG4 | 1.95 | 4.37e-18 | Upregulated |
CXCL6 | 1.94 | 5.76e-12 | Upregulated |
MZB1 | 1.94 | 6.50e-18 | Upregulated |
Note: log2FC = log2 fold change (positive = upregulated in periodontitis); FDR = Benjamini-Hochberg false discovery rate. Source: Differential expression analysis of GSE10334.
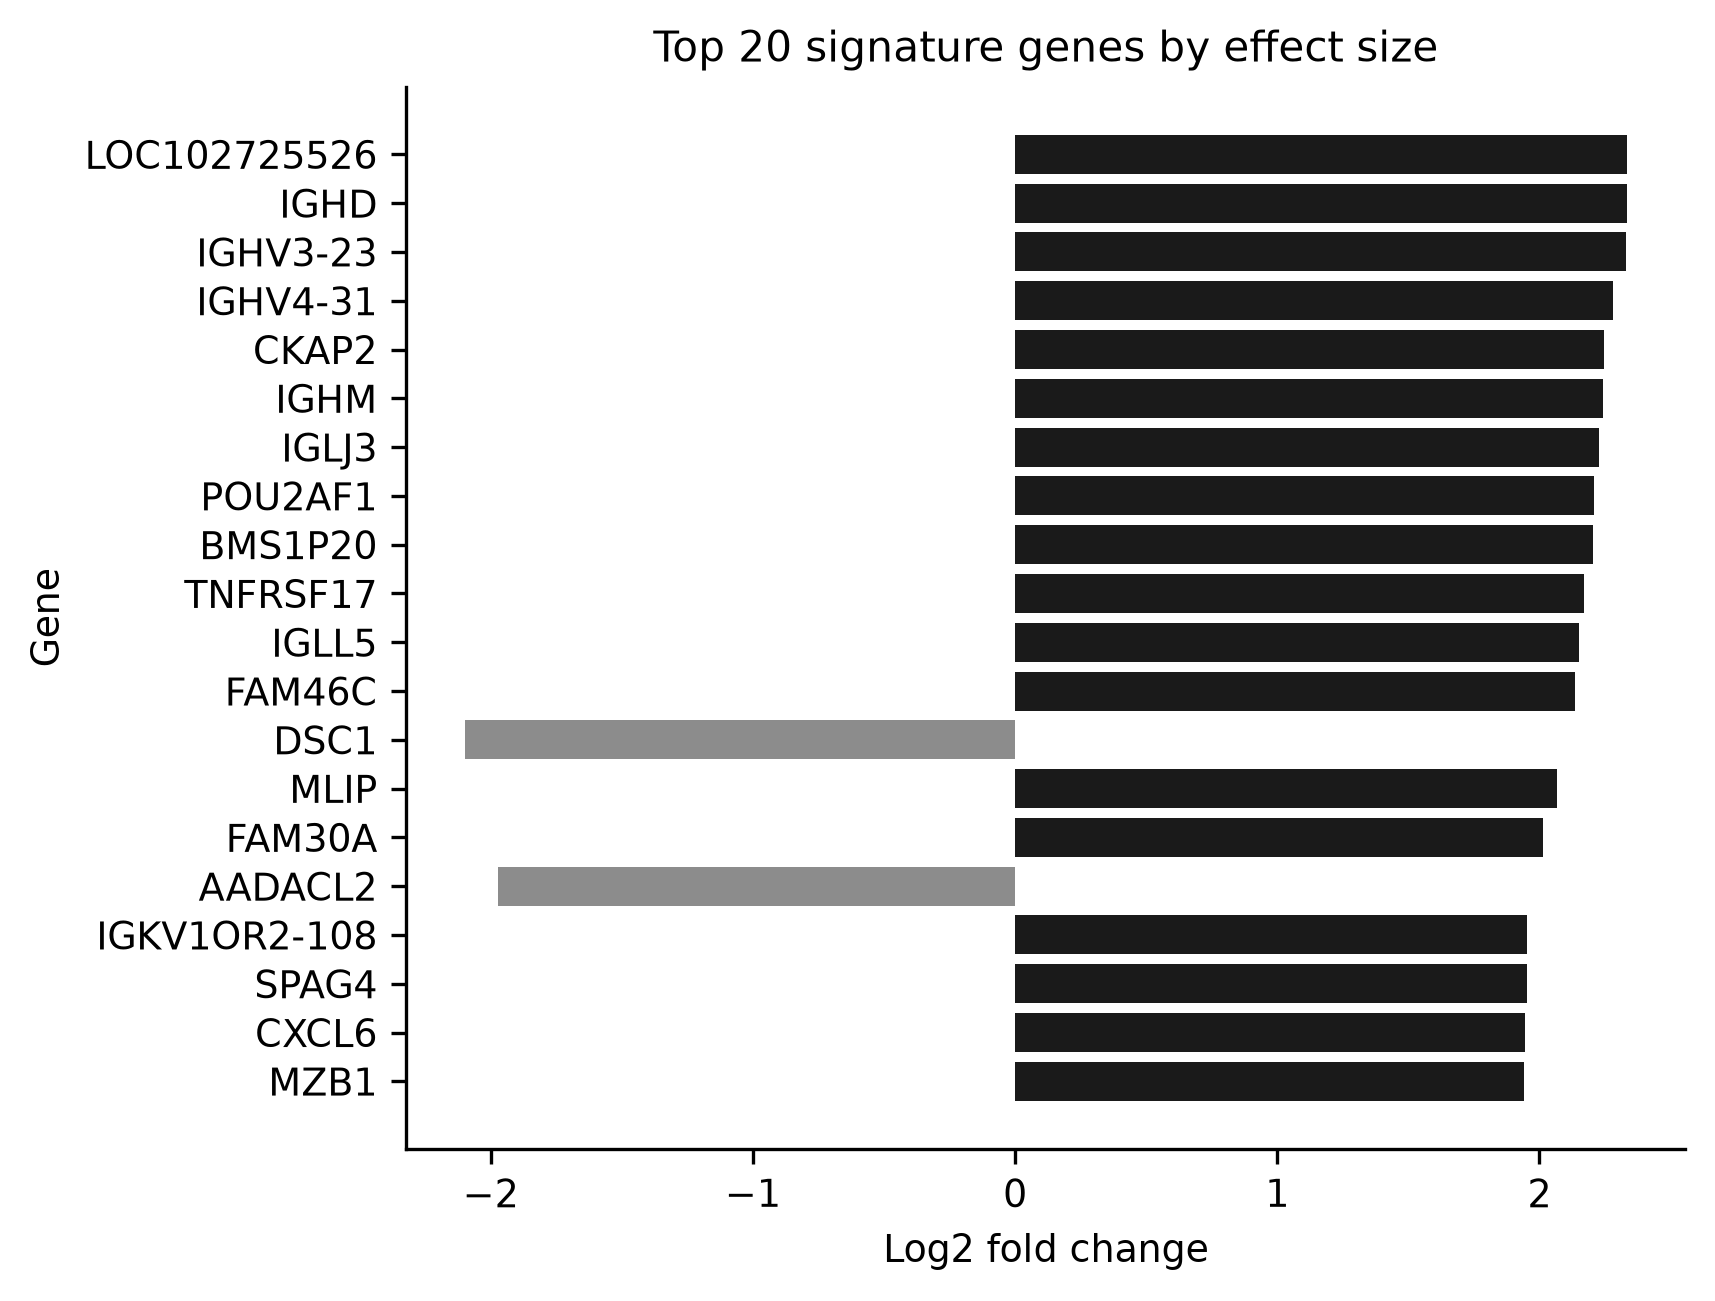
Figure 2. Log2 fold change of the top 20 signature genes.
Note: Positive values indicate upregulation in periodontitis. Source: Differential expression analysis of GSE10334.Primary outcome: external validation
The signature score discriminated periodontitis from healthy gingiva with an AUROC of 0.93 (95% CI 0.89 to 0.96) in the same-platform validation cohort GSE16134 and 0.75 (95% CI 0.53 to 0.93) in the cross-platform RNA-seq cohort GSE173078 (Table 3, Figure 3). The point estimate in the cross-platform cohort was lower and its confidence interval wider than in the same-platform cohort, but the lower bound remained above chance. The receiver operating characteristic curve for the same-platform cohort ran consistently to the left of and above that of the cross-platform cohort across the full range of operating points, so the difference was not confined to any single threshold (Figure 3).

Figure 3. Receiver operating characteristic curves of the signature score across cohorts.
Source: Elaborated from the analysis of GSE10334, GSE16134 and GSE173078.Cohort | AUROC | 95% CI | Sensitivity | Specificity |
|---|---|---|---|---|
Training (apparent) | 0.90 | 0.85 to 0.95 | 0.94 | 0.80 |
Training (5-fold CV) | 0.90 | 0.85 to 0.95 | ||
Validation 1 (GSE16134) | 0.93 | 0.89 to 0.96 | 0.93 | 0.83 |
Validation 2 (GSE173078) | 0.75 | 0.53 to 0.93 | 0.83 | 0.50 |
Note: AUROC = area under the receiver operating characteristic curve; CI = confidence interval. Sensitivity and specificity are at the Youden threshold estimated in the training cohort. Source: Elaborated from the analysis of GSE10334, GSE16134 and GSE173078.
Secondary outcomes
In internal validation the score reached an apparent AUROC of 0.90 (95% CI 0.85 to 0.95) and a cross-validated AUROC of 0.90 (95% CI 0.85 to 0.95). The apparent and cross-validated estimates were nearly identical, indicating that the score was not markedly over-fit to the training samples. At the Youden threshold fixed in the training cohort, the score showed a sensitivity of 0.93 and a specificity of 0.83 in GSE16134, with a positive predictive value of 0.95 and a negative predictive value of 0.76. In GSE173078 the corresponding values were a sensitivity of 0.83, a specificity of 0.50, a positive predictive value of 0.62, and a negative predictive value of 0.75. The score separated the two groups in every cohort, although the separation narrowed and the two distributions overlapped more in the cross-platform cohort (Figure 4). In the training cohort the score separated the two phenotypes with minimal overlap, and the same separation was reproduced in GSE16134. In the RNA-seq cohort several healthy samples received scores comparable to those of diseased samples, consistent with the lower specificity observed in that cohort.
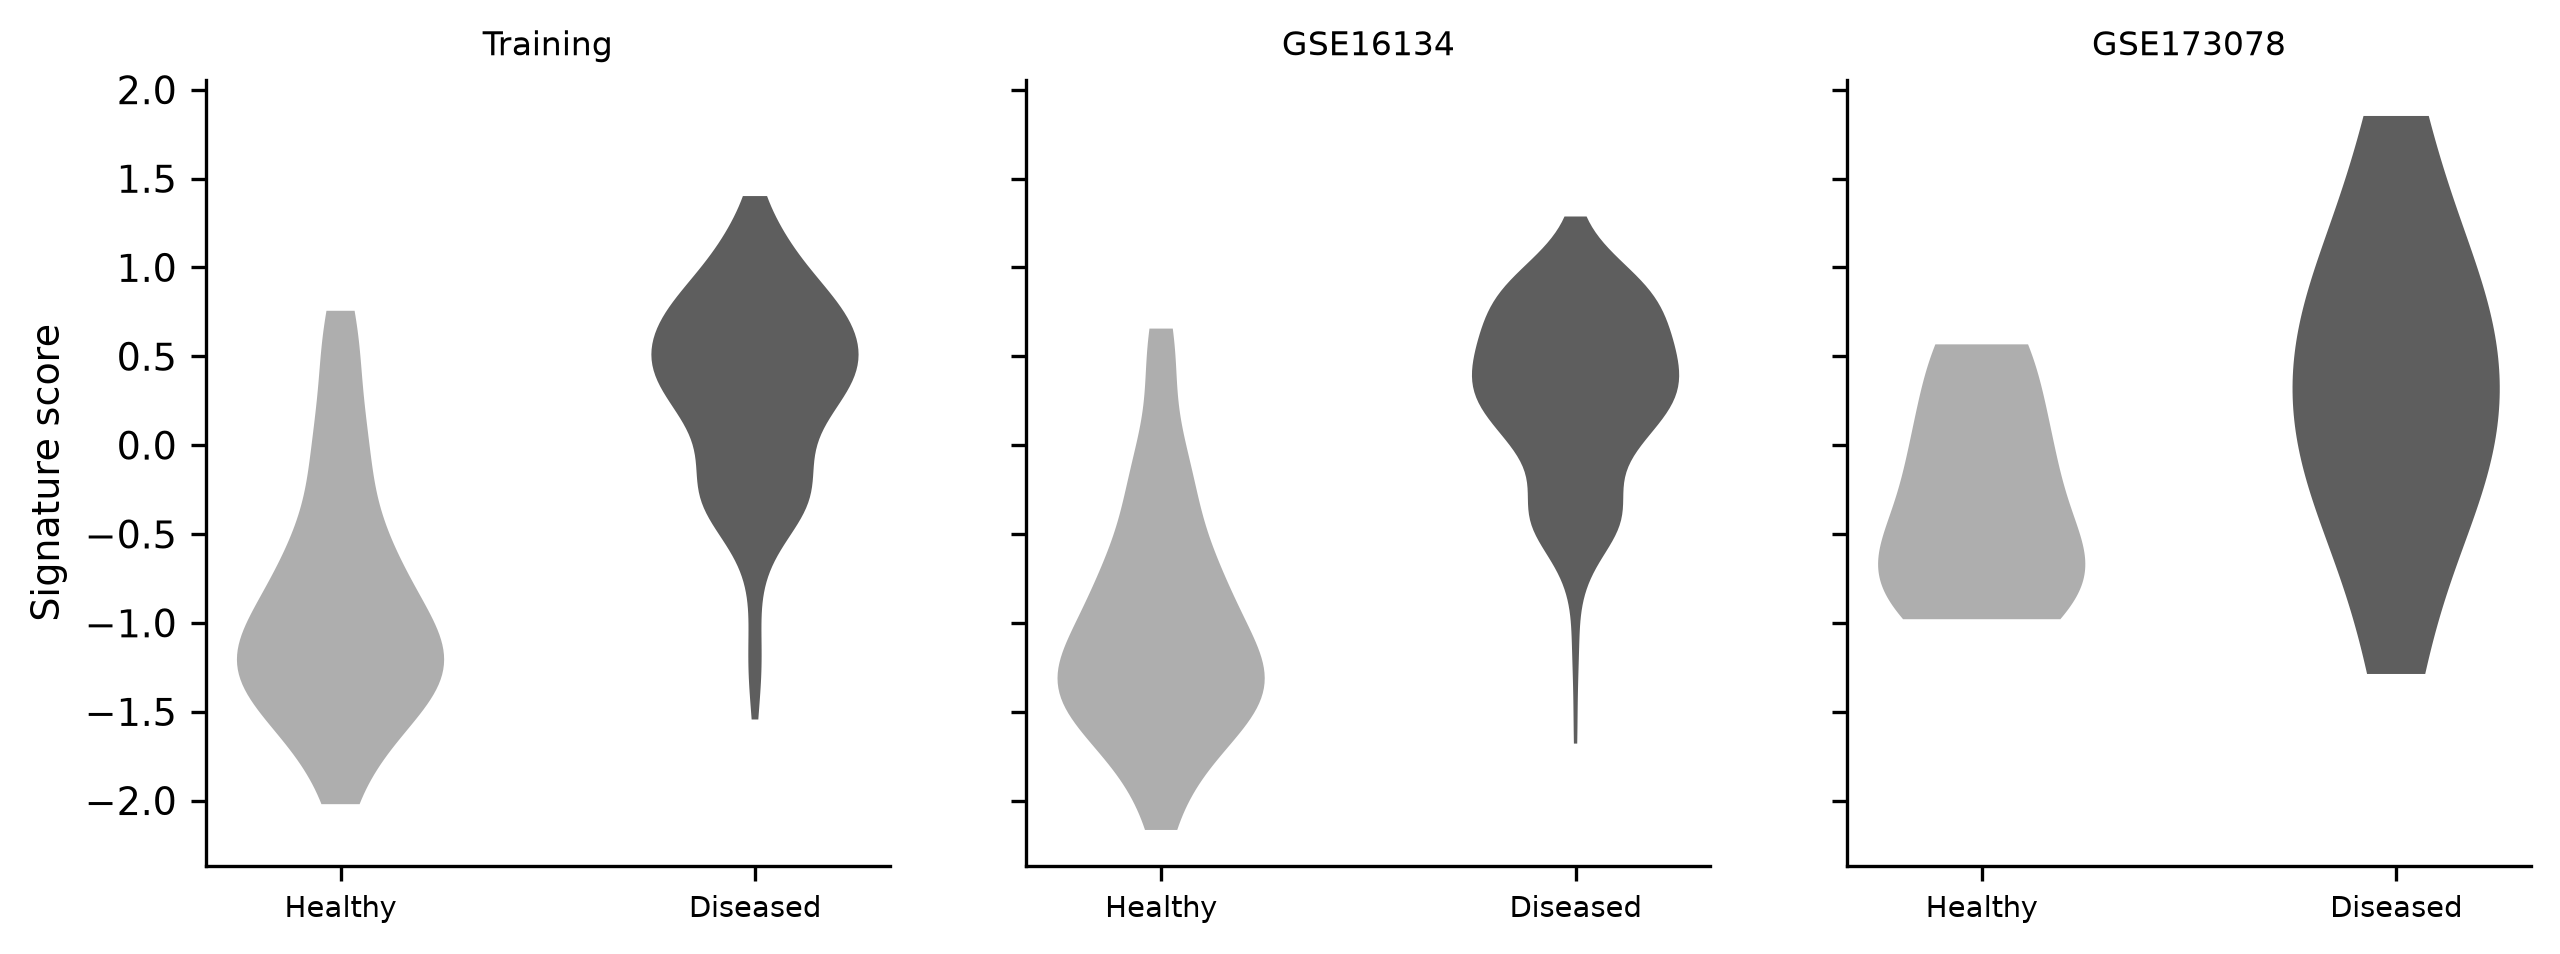
Figure 4. Distribution of the signature score by phenotype in each cohort.
Source: Elaborated from the analysis of GSE10334, GSE16134 and GSE173078.Sensitivity analysis
The regularized logistic-regression classifier reached an apparent AUROC of 1.00 in the training cohort and 0.99 in GSE16134, but 0.56 in GSE173078, degrading to near chance across platforms. The fixed-direction signature score therefore proved more stable than the coefficient-based model when transferred to the RNA-seq cohort. The near-perfect apparent performance of the classifier in the training cohort, followed by a fall to 0.56 in the RNA-seq cohort, illustrates how severely an over-fit coefficient model can degrade when the measurement platform changes and justifies the conservative direction-signed score as the primary analysis.
DISCUSSION
The principal finding of this study is that a gene expression signature derived from one public gingival-tissue microarray cohort discriminated periodontitis from healthy tissue in an independent cohort on the same platform, while its discrimination attenuated but remained above chance in an independent RNA-seq cohort. The signature answers the study question directly: it transfers within a platform but is only partially portable across platforms, and this distinction is exactly what a single-cohort evaluation cannot reveal.
The observation that periodontitis and health are separable at the transcriptome level is well established.(6-8) Earlier supervised and unsupervised analyses of the same Columbia University cohorts showed that transcriptomes distinguish chronic from aggressive periodontitis and stratify disease phenotypes beyond the clinical classification, and microRNA profiling of the same tissues identified additional non-coding regulators that track disease status.(7,18-20) The present signature reproduces that separability while testing a property those studies did not address: portability to a new cohort and a new measurement platform. Its concordant performance in GSE16134, a cohort assembled independently of the training set, confirms that the signal is not specific to the samples used for derivation.
Recent machine-learning studies have proposed diagnostic signatures for periodontitis built on senescence genes,(10) lactylation-related genes,(11) m1A methylation genes,(12) and neutrophil-degranulation programs,(13) and a related body of work has used single-cell and bulk transcriptomics to nominate PANoptosis-associated markers.(21) Non-invasive approaches based on saliva and peripheral blood have likewise been proposed.(22,23) A systematic review of artificial-intelligence models for periodontitis diagnosis concluded that external validation is the exception rather than the rule.(24) The present study differs from most of these in two respects: it reports external validation in cohorts that were never used for derivation, and it crosses from microarray to RNA-seq, which is the harsher of the two tests. Our cross-cohort results align with that concern. The internal metrics were favorable, and the same-platform cohort was required to confirm them, but the cross-platform cohort exposed an instability that a single-cohort report would have hidden. Studies that report only internal or single-cohort performance for transcriptomic signatures should therefore be interpreted cautiously.
The composition of the signature is biologically coherent rather than an artifact of overfitting to a single gene family. It is dominated by immunoglobulin heavy- and light-chain genes and by canonical plasma-cell markers, including TNFRSF17, which encodes B-cell maturation antigen, together with MZB1, CD79A, and IRF4. B-lineage cells, including plasma cells, predominate in the inflammatory infiltrate of chronic periodontitis, and the B-cell survival factors BLyS and APRIL are elevated in diseased tissue.(3) This cellular predominance has been recognized for decades, and other lymphocyte populations, including natural killer T cells, are likewise enriched in periodontitis lesions.(4) The neutrophil chemokines CXCL6 and CXCL1, both present in the signature, align with the role of neutrophil recruitment in periodontitis; IL-8 (CXCL8) and related mediators are consistently elevated in diseased gingiva,(5) and an IL-17-dominated inflammatory network modulates these chemokines in the disease.(25) The epithelial gene DSC1, which encodes desmocollin 1, was the most strongly downregulated member of the signature, consistent with the loss of epithelial integrity that accompanies pocket formation. The signature therefore summarizes several arms of the known host response in periodontitis rather than a single isolated pathway, and its overlap with the immunopathology of the disease is a substantive argument for its validity.
The prominence of immunoglobulin and plasma-cell genes is not unique to this dataset; it has been a recurrent finding across the transcriptomic literature on periodontitis. The earliest studies of gingival tissue already reported B-cell and plasma-cell programs among the strongest disease-associated signals,(6) and the supervised analyses that followed confirmed immune programs as the dominant discriminator between health and disease.(7) A recent comprehensive RNA-seq study of severe periodontitis likewise found immune-related genes, including chemokines and B-cell markers, among the most upregulated.(8) The consistency of this signature across independent cohorts, platforms, and analytic pipelines is itself evidence that it reflects the core immunopathology of the disease rather than the idiosyncrasies of any single study.
Single-cell transcriptomics adds a layer of resolution that a bulk signature such as this one cannot provide. Single-cell studies of gingival tissue have begun to resolve the specific cell types that carry the disease signal, including fibroblast and immune subsets in the periodontitis lesion.(21,26) A bulk signature dominated by plasma-cell genes is consistent with those cell-type findings but cannot by itself attribute the signal to a particular compartment. Integrating bulk signatures with single-cell atlases is a natural next step: it would identify which cells produce the signature genes and would clarify whether the plasma-cell program is a driver of tissue destruction or a downstream consequence of inflammation.
The attenuation across platforms is expected rather than surprising. Microarray and RNA-seq measurements differ systematically in dynamic range, transcript detection, and absolute scale, and predictive models trained on legacy microarray data do not transfer to RNA-seq without explicit harmonization.(14,27,28) Batch effects add further non-biological variation that can mask true biological signal.(15) The collapse of the logistic-regression classifier to near chance in the RNA-seq cohort illustrates this concretely, whereas the direction-signed score, which discards coefficient magnitudes, degraded more gracefully. Within-cohort standardization, applied here, is one of several harmonization strategies; distribution-matching and rank-based approaches have been proposed and could improve portability.(27,28) Future work could apply these harmonization methods explicitly and measure how much of the cross-platform gap they recover, which would separate the contribution of measurement differences from that of true biological differences between the cohorts. The wider confidence interval in the cross-platform cohort also reflects its small sample size rather than a weak signal alone, a point reinforced by the microbial and host heterogeneity documented across periodontitis populations.
The host signature should also be read alongside the subgingival microbiota, because the lesion it reflects is a response to a microbial community that varies between individuals and populations. The GSE16134 cohort was originally assembled to relate gingival gene expression to subgingival bacterial colonization profiles, and host transcriptomes track the composition of the biofilm.(16) Across studies, the subgingival microbiome associated with periodontitis is heterogeneous, with distinct community states observed in different populations,(29) and salivary microbial profiles correlate with host inflammatory mediators.(30) This microbial heterogeneity is a plausible additional reason why a signature trained in one population may shift when applied to another, and it argues for validating molecular signatures together with their microbial context rather than in isolation.
The main strengths of this study are its three independent, publicly available cohorts with clearly defined phenotypes, a pre-specified hierarchy of outcomes with external validation as the primary endpoint, and a fully reproducible analysis pipeline executed with a fixed seed. The signature is compact and biologically interpretable rather than a black box, which matters for a disease whose molecular pathology is still being mapped. Restricting the score to the direction of change, rather than estimated coefficients, is a deliberate choice that trades some flexibility for robustness across measurement technologies, and the sensitivity analysis shows that this trade-off was justified. Using entirely public data also makes the work fully reproducible and auditable by others, and it removes the cost and consent barriers that would accompany a newly collected cohort. The absence of any batch correction also makes the external estimates more conservative than they would have been after harmonization.
One further nuance concerns the sampling design of the microarray cohorts. GSE10334 and GSE16134 compare diseased and healthy sites within the same patients rather than patients with periodontitis against periodontally healthy people, so the signature captures the difference between a diseased site and a healthy site in an affected individual, not the difference between a person with periodontitis and a person without it. This distinction matters for any eventual diagnostic use, because a screening test would need to separate individuals, not sites within an individual. The RNA-seq cohort, which compares periodontitis and healthy subjects, is closer to the latter question, and its lower performance may partly reflect that harder contrast rather than platform differences alone.
Several limitations temper these findings. First, all three cohorts originate from a single institution, so geographic, ethnic, and population generalizability remain unaddressed; future work should test the signature in cohorts from other regions and ancestry groups. Second, the cross-platform cohort is small, with 24 samples, which widens its confidence intervals and limits the precision of the cross-platform estimate; a larger RNA-seq cohort would give a more reliable estimate. Third, the gene-level collapse and within-cohort standardization, although standard, may discard information carried by specific transcript isoforms; alternative summarization and harmonization methods should be compared directly. Fourth, the signature was derived and validated against a clinical case definition, so its value is as a molecular correlate of that definition rather than as a substitute for clinical examination. Finally, the internal training metrics remain optimistic because the signature genes were selected using the full training cohort; selecting features in a held-out set would provide a fully unbiased internal estimate. Sixth, the analysis did not adjust for potential sample-level confounders such as age and sex, because the microarray cohorts were already restricted to systemically healthy non-smokers and the phenotype is defined within sites; covariate-adjusted and stratified models are a direction for future work. Taken together, these limitations outline a clear agenda: geographically and ethnically diverse cohorts, larger cross-platform samples, isoform-level summaries, and feature selection that is itself cross-validated.
More broadly, the pattern observed here, in which strong internal and same-platform performance is followed by attenuation across platforms, is not specific to periodontitis and has been documented repeatedly in the machine-learning biomarker literature.(14,15) It points to a general lesson for transcriptomic biomarker development: the value of a signature is established not by how well it fits the data used to derive it but by how it behaves on data it has never seen, and cross-platform transfer is the most demanding version of that test. Studies that report a favorable area under the curve without stating how the model was validated provide incomplete evidence of utility.
For clinical translation, a tissue signature of this kind faces practical barriers that the present design does not resolve. Gingival tissue requires a biopsy, which is more invasive and more costly than the non-invasive alternatives under active development, including salivary and gingival crevicular fluid markers and machine-learning models built on these fluids.(22,23) The value of a tissue signature is therefore not as a routine screening tool but as a reference standard for the molecular state of the lesion and as a benchmark against which non-invasive surrogates can be calibrated. If a salivary signature can be shown to track the tissue score reported here, the non-invasive test would inherit the biological interpretability of the tissue score.
For practice, these results argue that a transcriptomic signature can support but not yet replace clinical examination, and that any candidate signature must be validated on the platform and in the population where it would be deployed. A signature that performs well in one microarray cohort should not be assumed to perform equally in an RNA-seq cohort, and the direction of that concern is now quantifiable. For the field, the study reinforces that single-cohort machine-learning claims in periodontitis should be read with caution until they are externally confirmed, particularly across platforms, and it supports calls for transparent reporting of model development and validation so that internal-only claims remain distinguishable from externally confirmed ones.
CONCLUSIONS
A plasma-cell-enriched gene expression signature discriminated periodontitis from healthy gingiva and generalized to an independent cohort on the same platform, but its discrimination attenuated across platforms. The signature is biologically coherent, reproducible, and robust within a platform, whereas a coefficient-based classifier over-fit to the training data and failed to transfer. Platform harmonization and geographically diverse validation remain necessary before such transcriptomic signatures can support clinical decisions.
References
- 1 Wang Y, Wu Y, Song J. Global and Regional Burden of Periodontal Disease in Adults (1990-2021). International Dental Journal. 2025;75(6):103883. doi: 10.1016/j.identj.2025.103883
- 2 Papapanou PN, Sanz M, Buduneli N, Dietrich T, Feres M, Fine DH, et al. Periodontitis: Consensus report of workgroup 2 of the 2017 World Workshop on the Classification of Periodontal and Peri‐Implant Diseases and Conditions. J Clinic Periodontology. 2018;45(S20):S162-S170. doi: 10.1111/jcpe.12946
- 3 Abe T, AlSarhan M, Benakanakere MR, Maekawa T, Kinane DF, Cancro MP, et al. The B Cell–Stimulatory Cytokines BLyS and APRIL Are Elevated in Human Periodontitis and Are Required for B Cell–Dependent Bone Loss in Experimental Murine Periodontitis. J Immunol. 2015;195(4):1427-1435. doi: 10.4049/jimmunol.1500496
- 4 Yamazaki K, Ohsawa Y, Yoshie H. Elevated Proportion of Natural Killer T Cells in Periodontitis Lesions. The American Journal of Pathology. 2001;158(4):1391-1398. doi: 10.1016/s0002-9440(10)64090-4
- 5 NOH MK, JUNG M, KIM SH, LEE SR, PARK KH, KIM DH, et al. Assessment of IL-6, IL-8 and TNF-α levels in the gingival tissue of patients with periodontitis. Experimental and Therapeutic Medicine. 2013;6(3):847-851. doi: 10.3892/etm.2013.1222
- 6 Demmer RT, Behle JH, Wolf DL, Handfield M, Kebschull M, Celenti R, et al. Transcriptomes in Healthy and Diseased Gingival Tissues. Journal of Periodontology. 2008;79(11):2112-2124. doi: 10.1902/jop.2008.080139
- 7 Kebschull M, Guarnieri P, Demmer RT, Boulesteix AL, Pavlidis P, Papapanou PN. Molecular Differences between Chronic and Aggressive Periodontitis. J Dent Res. 2013;92(12):1081-1088. doi: 10.1177/0022034513506011
- 8 GURGEL BCDV, VILELA N, SOARES KH, JULIASSE LER, AUKHIL I, DUARTE PM. Comprehensive analysis of transcriptome and pathway interactions in periodontitis. J Appl Oral Sci. 2025;33:e20250396. doi: 10.1590/1678-7757-2025-0396
- 9 Reddy SSP, Dhiman Y, Francis DL, Rathi M, Gupta A, Harish R, et al. Transcriptomic Analysis of Gingival Tissues: Insights Into Gene Expression Profiles. International Journal of Genomics. 2025;2025(1):1427141. doi: 10.1155/ijog/1427141
- 10 Zeng J, Huang J, He J, Tan J, Duan M, Song Y, et al. Integrative Transcriptomic and Machine Learning Analysis Identifies Key Senescence‐Associated Secretory Phenotype Genes Associated With Immune Dysregulation in Periodontitis. Human Mutation. 2025;2025(1):3637248. doi: 10.1155/humu/3637248
- 11 Zhu Y, Zhang X, Wei L, Bai Y, Wang T, Guo Y, et al. Lactylation-related gene signatures define immune heterogeneity and provide diagnostic biomarkers for periodontitis. Sci Rep. 2025;15(1):45516. doi: 10.1038/s41598-025-30213-z
- 12 Wang K, Wang A, Qiu L, Xu L, Wei J. Combined bioinformatics and experimental validation identifies m1A-modified genes as potential diagnostic biomarkers in periodontitis and diabetes. Archives of Oral Biology. 2025;180:106428. doi: 10.1016/j.archoralbio.2025.106428
- 13 Wu H, Huang L, Cai S, Xiong X, He Y. Diagnosis of Periodontitis via Neutrophil Degranulation Signatures Identified by Integrated scRNA-Seq and Deep Learning. Genes. 2025;16(9):1005. doi: 10.3390/genes16091005
- 14 Su Z, Fang H, Hong H, Shi L, Zhang W, Zhang W, et al. An investigation of biomarkers derived from legacy microarray data for their utility in the RNA-seq era. Genome Biol. 2014;15(12):523. doi: 10.1186/s13059-014-0523-y
- 15 Yu Y, Mai Y, Zheng Y, Shi L. Assessing and mitigating batch effects in large-scale omics studies. Genome Biol. 2024;25(1):254. doi: 10.1186/s13059-024-03401-9
- 16 Papapanou PN, Behle JH, Kebschull M, Celenti R, Wolf DL, Handfield M, et al. Subgingival bacterial colonization profiles correlate with gingival tissue gene expression. BMC Microbiol. 2009;9(1):221. doi: 10.1186/1471-2180-9-221
- 17 Kim H, Momen‐Heravi F, Chen S, Hoffmann P, Kebschull M, Papapanou PN. Differential DNA methylation and mRNA transcription in gingival tissues in periodontal health and disease. J Clinic Periodontology. 2021;48(9):1152-1164. doi: 10.1111/jcpe.13504
- 18 Kebschull M, Demmer RT, Grün B, Guarnieri P, Pavlidis P, Papapanou PN. Gingival Tissue Transcriptomes Identify Distinct Periodontitis Phenotypes. J Dent Res. 2014;93(5):459-468. doi: 10.1177/0022034514527288
- 19 Sawle AD, Kebschull M, Demmer RT, Papapanou PN. Identification of Master Regulator Genes in Human Periodontitis. J Dent Res. 2016;95(9):1010-1017. doi: 10.1177/0022034516653588
- 20 Stoecklin-Wasmer C, Guarnieri P, Celenti R, Demmer RT, Kebschull M, Papapanou PN. MicroRNAs and Their Target Genes in Gingival Tissues. J Dent Res. 2012;91(10):934-940. doi: 10.1177/0022034512456551
- 21 Wu E, Zhuo Q, Yin X, Li J, Zhang H, Gu F, et al. Single-cell and bulk transcriptomic analyses reveal PANoptosis-associated immune dysregulation of fibroblasts in periodontitis. Front Immunol. 2025;16:1671919. doi: 10.3389/fimmu.2025.1671919
- 22 Kim EH, Kim S, Kim HJ, Jeong HO, Lee J, Jang J, et al. Prediction of Chronic Periodontitis Severity Using Machine Learning Models Based On Salivary Bacterial Copy Number. Front Cell Infect Microbiol. 2020;10:571515. doi: 10.3389/fcimb.2020.571515
- 23 Cárdenas A, Ardila L, Vernal R, Melgar-Rodríguez S, Hernández H. Biomarkers of Periodontitis and Its Differential DNA Methylation and Gene Expression in Immune Cells: A Systematic Review. IJMS. 2022;23(19):12042. doi: 10.3390/ijms231912042
- 24 Ardila CM, Vivares-Builes AM, Yadalam PK. Artificial Intelligence Models for Diagnosis of Periodontitis Using Non-Invasive Biological Markers: A Systematic Review and Meta-Analysis of Patient-Based Studies. Medical Sciences. 2025;13(3):159. doi: 10.3390/medsci13030159
- 25 Sun L, Girnary M, Wang L, Jiao Y, Zeng E, Mercer K, et al. IL-10 Dampens an IL-17–Mediated Periodontitis-Associated Inflammatory Network. The Journal of Immunology. 2020;204(8):2177-2191. doi: 10.4049/jimmunol.1900532
- 26 Sekiguchi R, Martin D, Yamada KM. Single-cell RNA sequencing reveals genes relevant to periodontal therapy and periodontitis. Physiological Genomics. 2025;57(12):720-733. doi: 10.1152/physiolgenomics.00002.2025
- 27 Thompson JA, Tan J, Greene CS. Cross-platform normalization of microarray and RNA-seq data for machine learning applications. PeerJ. 2016;4:e1621. doi: 10.7717/peerj.1621
- 28 van der Kloet FM, Buurmans J, Jonker MJ, Smilde AK, Westerhuis JA. Increased comparability between RNA-Seq and microarray data by utilization of gene sets. PLoS Comput Biol. 2020;16(9):e1008295. doi: 10.1371/journal.pcbi.1008295
- 29 Altabtbaei K, Maney P, Ganesan SM, Dabdoub SM, Nagaraja HN, Kumar PS. Anna Karenina and the subgingival microbiome associated with periodontitis. Microbiome. 2021;9(1):97. doi: 10.1186/s40168-021-01056-3
- 30 Lundmark A, Hu YOO, Huss M, Johannsen G, Andersson AF, Yucel-Lindberg T. Identification of Salivary Microbiota and Its Association With Host Inflammatory Mediators in Periodontitis. Front Cell Infect Microbiol. 2019;9:216. doi: 10.3389/fcimb.2019.00216
Declarations
Funding
No financing
Conflict of interest
None
Authorship contributions
Drafting – original draft: Flor M Escalante Freitez.
Writing–review and editing: Flor M Escalante Freitez.